1. 前言
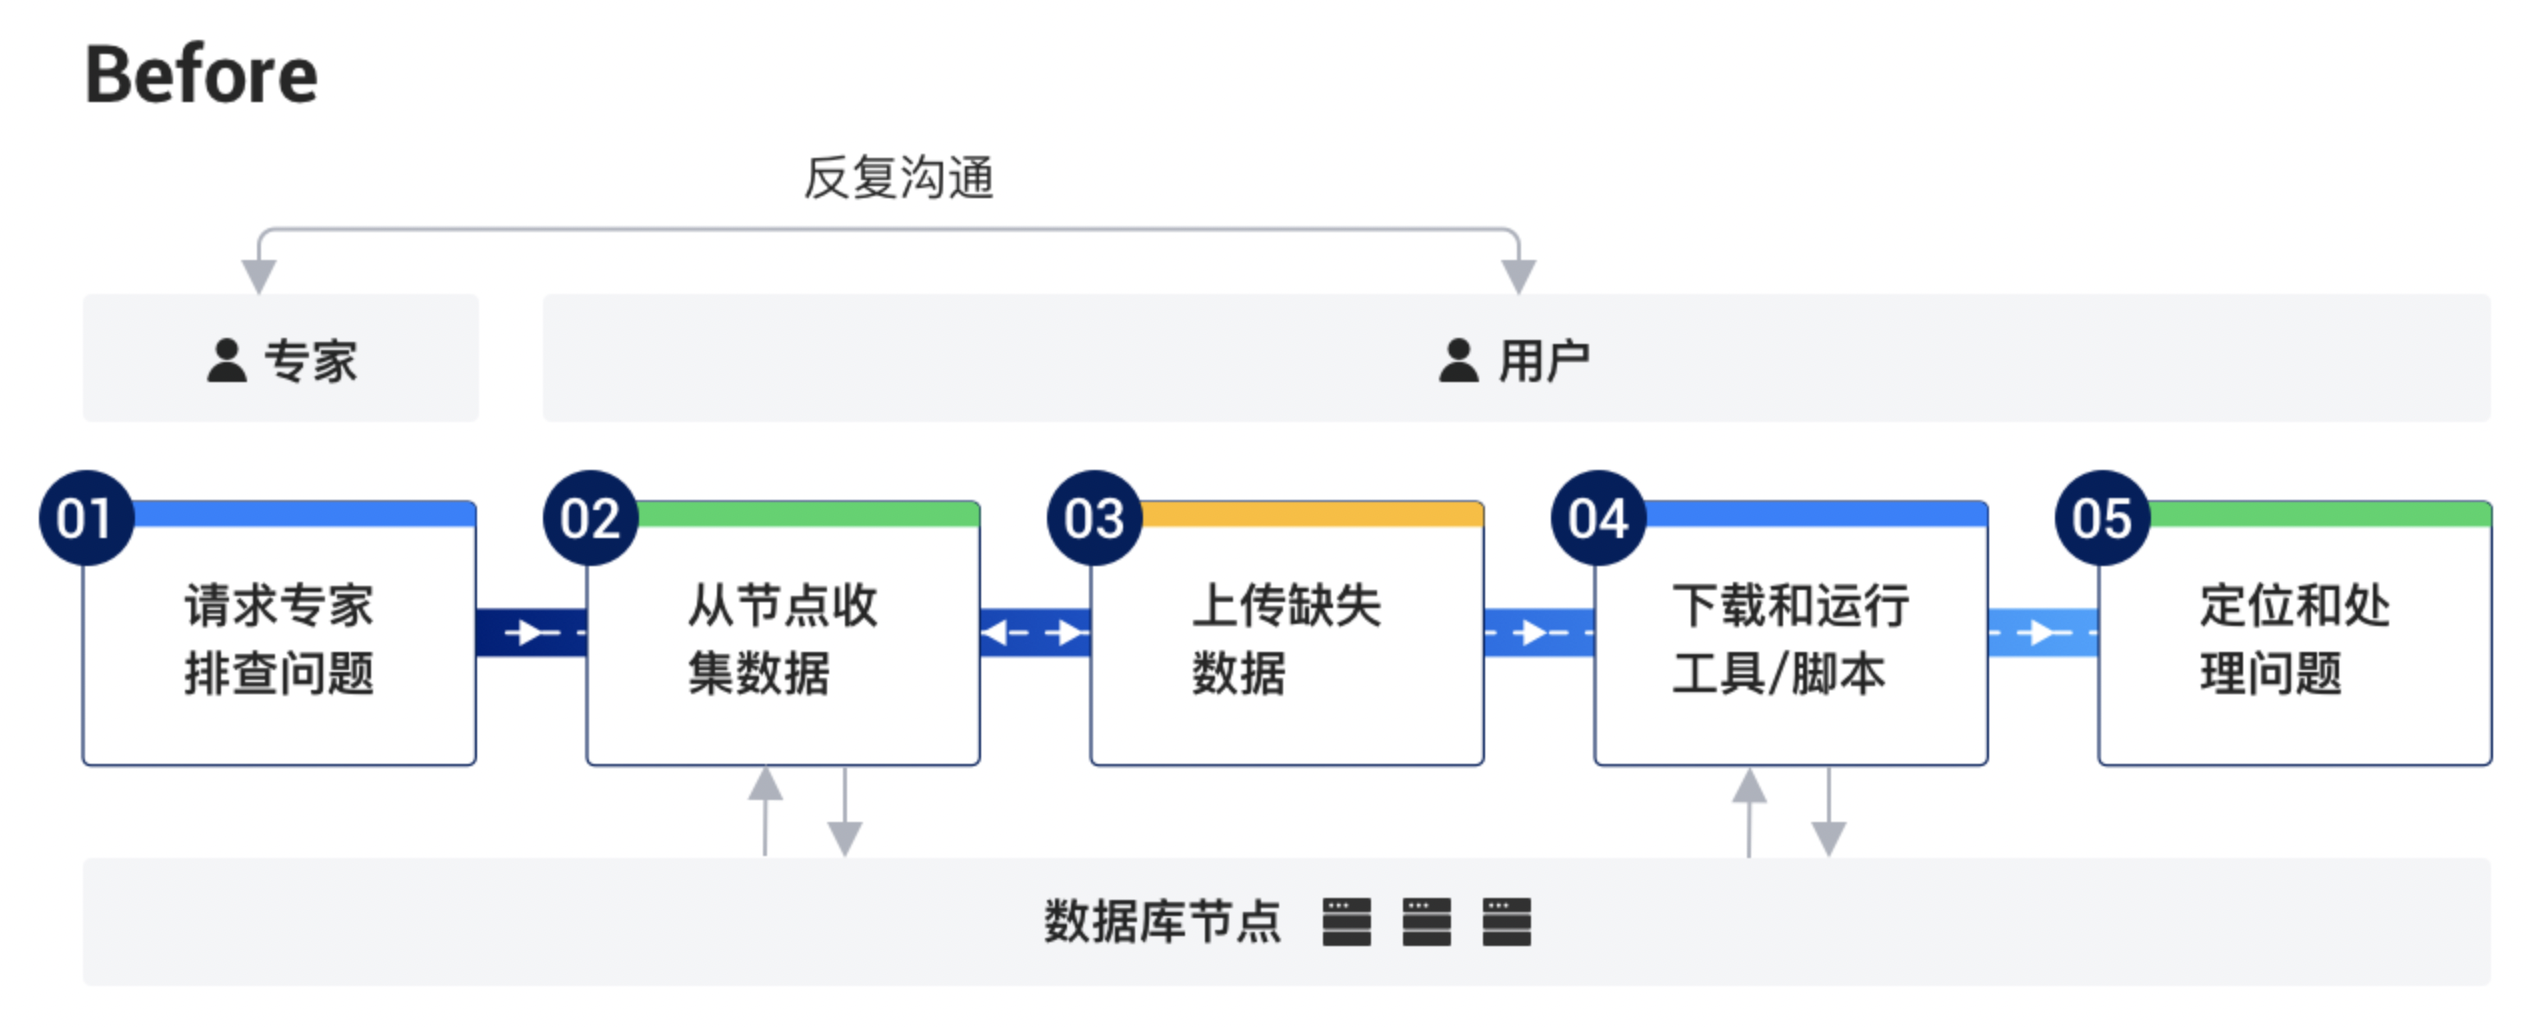
OceanBase论坛问答区或者提交工单支持的时候大部分时间都浪费在了诊断信息的获取交互上,今天我就其中大家比较头疼的SQL问题,给大家讲解一下如何一键收集并行SQL/慢SQL所需要的诊断信息,减少沟通成本,让大家早下班。
2. 补充知识点
并行执行系列的内容大家可以参考以下博客。
| 第一篇 | 并行执行概念 |
| 第二篇 | 设定并行度 |
| 第三篇 | 并发控制与排队 |
| 第四篇 | 并行执行分类 |
| 第五篇 | 并行执行控制参数 |
| 第六篇 | 并行执行诊断及调优技巧 |
| 第七篇 | 并行执行 PoC QuickStart |
3. 一键收集并行SQL/慢SQL诊断信息
并行我们一般情况下遇到并行SQL问题排查不可避免的都会查如下信息:gvob_sql_audit、gvob_plan_cache_plan_stat、gvob_plan_cache_plan_explain、gvsql_plan_monitor、explain extend SQL、trace_id相关的日志、统计信息。看完是不是很头大,到底怎么查,用哪些命令,查哪些东西,这些东西查晚一点还会被过期淘汰掉,头大。。。。。
别着急,往下看,obdiag 帮你搞定一键诊断信息收集。
3.1. 一键收集并行SQL/慢SQL诊断信息
**步骤一:**安装obdiag并配置被诊断集群信息(~/.obdiag/config.yml)
sudo yum install -y yum-utils
sudo yum-config-manager --add-repo https://mirrors.aliyun.com/oceanbase/OceanBase.repo
sudo yum install -y oceanbase-diagnostic-tool
source /usr/local/oceanbase-diagnostic-tool/init.sh

# 配置被诊断集群信息
obdiag config -hxx.xx.xx.xx -uroot@sys -Pxxxx -p*****
**步骤二:**获取需要诊断的SQL的trace_id
从gv$ob_sql_audit中获取或者通过SELECT last_trace_id();获取
通过sql_audit中获取
select query_sql,trace_id from oceanbase.GV$OB_SQL_AUDIT where query_sql like 'xxx%' order by REQUEST_TIME desc limit 5;通过当前session执行SELECT last_trace_id();获取
SELECT last_trace_id();**步骤三:**一键诊断信息收集
obdiag gather plan_monitor [options]选项说明如下:
| 选项名 | 是否必选 | 数据类型 | 默认值 | 说明 |
|---|---|---|---|---|
| --trace_id | 是 | string | 默认为空 | OceanBase 数据库 V4.0.0 以下版本可从 gv$sql_audit 中查看 trace_id,OceanBase 数据库 V4.0.0 及以上版本可从 gv$ob_sql_audit 中查看 trace_id。 |
| --store_dir | 否 | string | 默认为命令执行的当前路径 | 存储结果的本地路径。 |
| -c | 否 | string | ~/.obdiag/config.yml |
配置文件路径 |
| --env | 否 | string | 默认为空 | 要分析的 trace_id 涉及的 SQL 所在的业务租户的连接串,主要用于获取 explain SQL 报告的 |
说明
- 需要确保已经在 obdiag 配置文件
config.yml中配置好需要收集的集群sys连接信息。相关的详细配置介绍,参见 obdiag 配置。
示例:
obdiag gather plan_monitor --trace_id YB420BA2D99B-0005EBBFC45D5A00-0-0 --env "{db_connect='-hxx -Pxx -uxx -pxx -Dxx'}"

gather_plan_monitor start ...

Gather Sql Plan Monitor Summary:
+-----------+-----------+--------+-------------------------------------+
| Cluster   | Status    | Time   | PackPath                            |
+===========+===========+========+=====================================+
| obcluster | Completed | 2 s    | ./obdiag_gather_pack_20240611171324 |
+-----------+-----------+--------+-------------------------------------+
3.2. 举个例子
建测试表
create table game (round int primary key, team varchar(10), score int)
    partition by hash(round) partitions 3;

insert into game values (1, "CN", 4), (2, "CN", 5), (3, "JP", 3);
insert into game values (4, "CN", 4), (5, "US", 4), (6, "JP", 4);
执行并行SQL并获取trace_id
obclient [oceanbase]> select /*+ parallel(3) */ team, sum(score) total from game group by team;
+------+-------+
| team | total |
+------+-------+
| US   |     4 |
| CN   |    13 |
| JP   |     7 |
+------+-------+
3 rows in set (0.006 sec)

obclient [oceanbase]> SELECT last_trace_id();
+-----------------------------------+
| last_trace_id()                   |
+-----------------------------------+
| YF2A0BA2DA7E-000615B522FD3D35-0-0 |
+-----------------------------------+
1 row in set (0.000 sec)
一键诊断信息收集
obdiag gather plan_monitor --trace_id YB420BA2D99B-0005EBBFC45D5A00-0-0 --env "{db_connect='-hxx -Pxx -uxx -pxx -Dxx'}"
gather_plan_monitor start ...
Gather Sql Plan Monitor Summary:
+-----------+-----------+--------+-------------------------------------+
| Cluster | Status | Time | PackPath |
+===========+===========+========+=====================================+
| obcluster | Completed | 2 s | ./obdiag_gather_pack_20240611171324 |
+-----------+-----------+--------+-------------------------------------+
Trace ID: dade865c-27d2-11ef-bc35-cad6cd785756
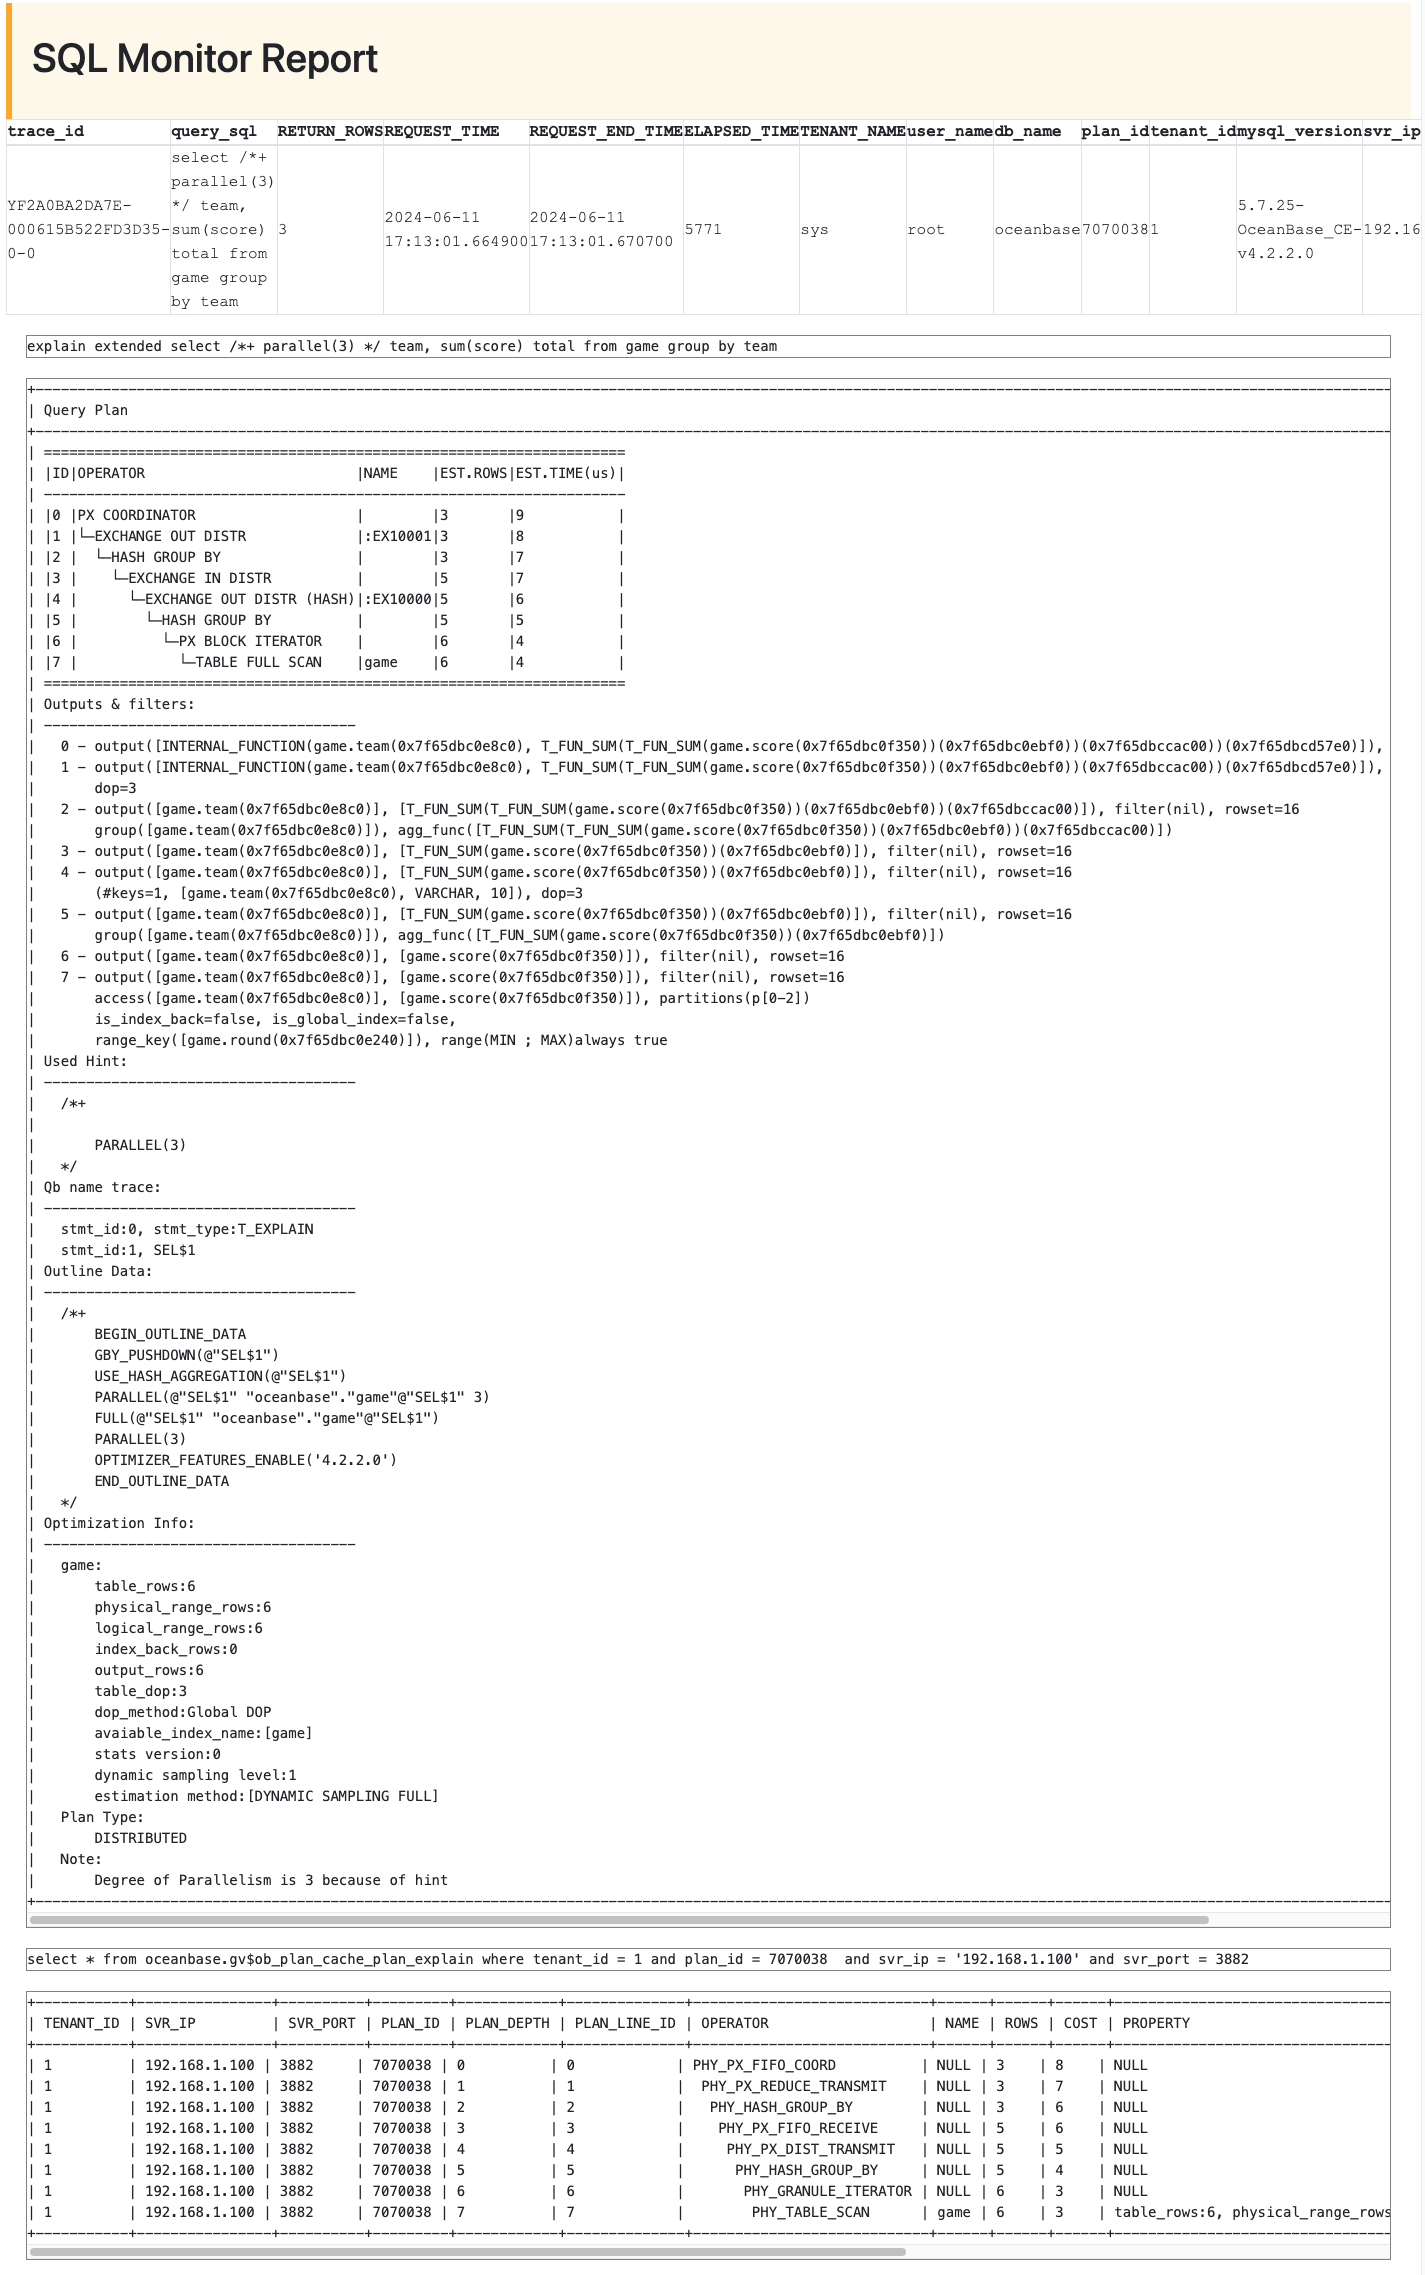
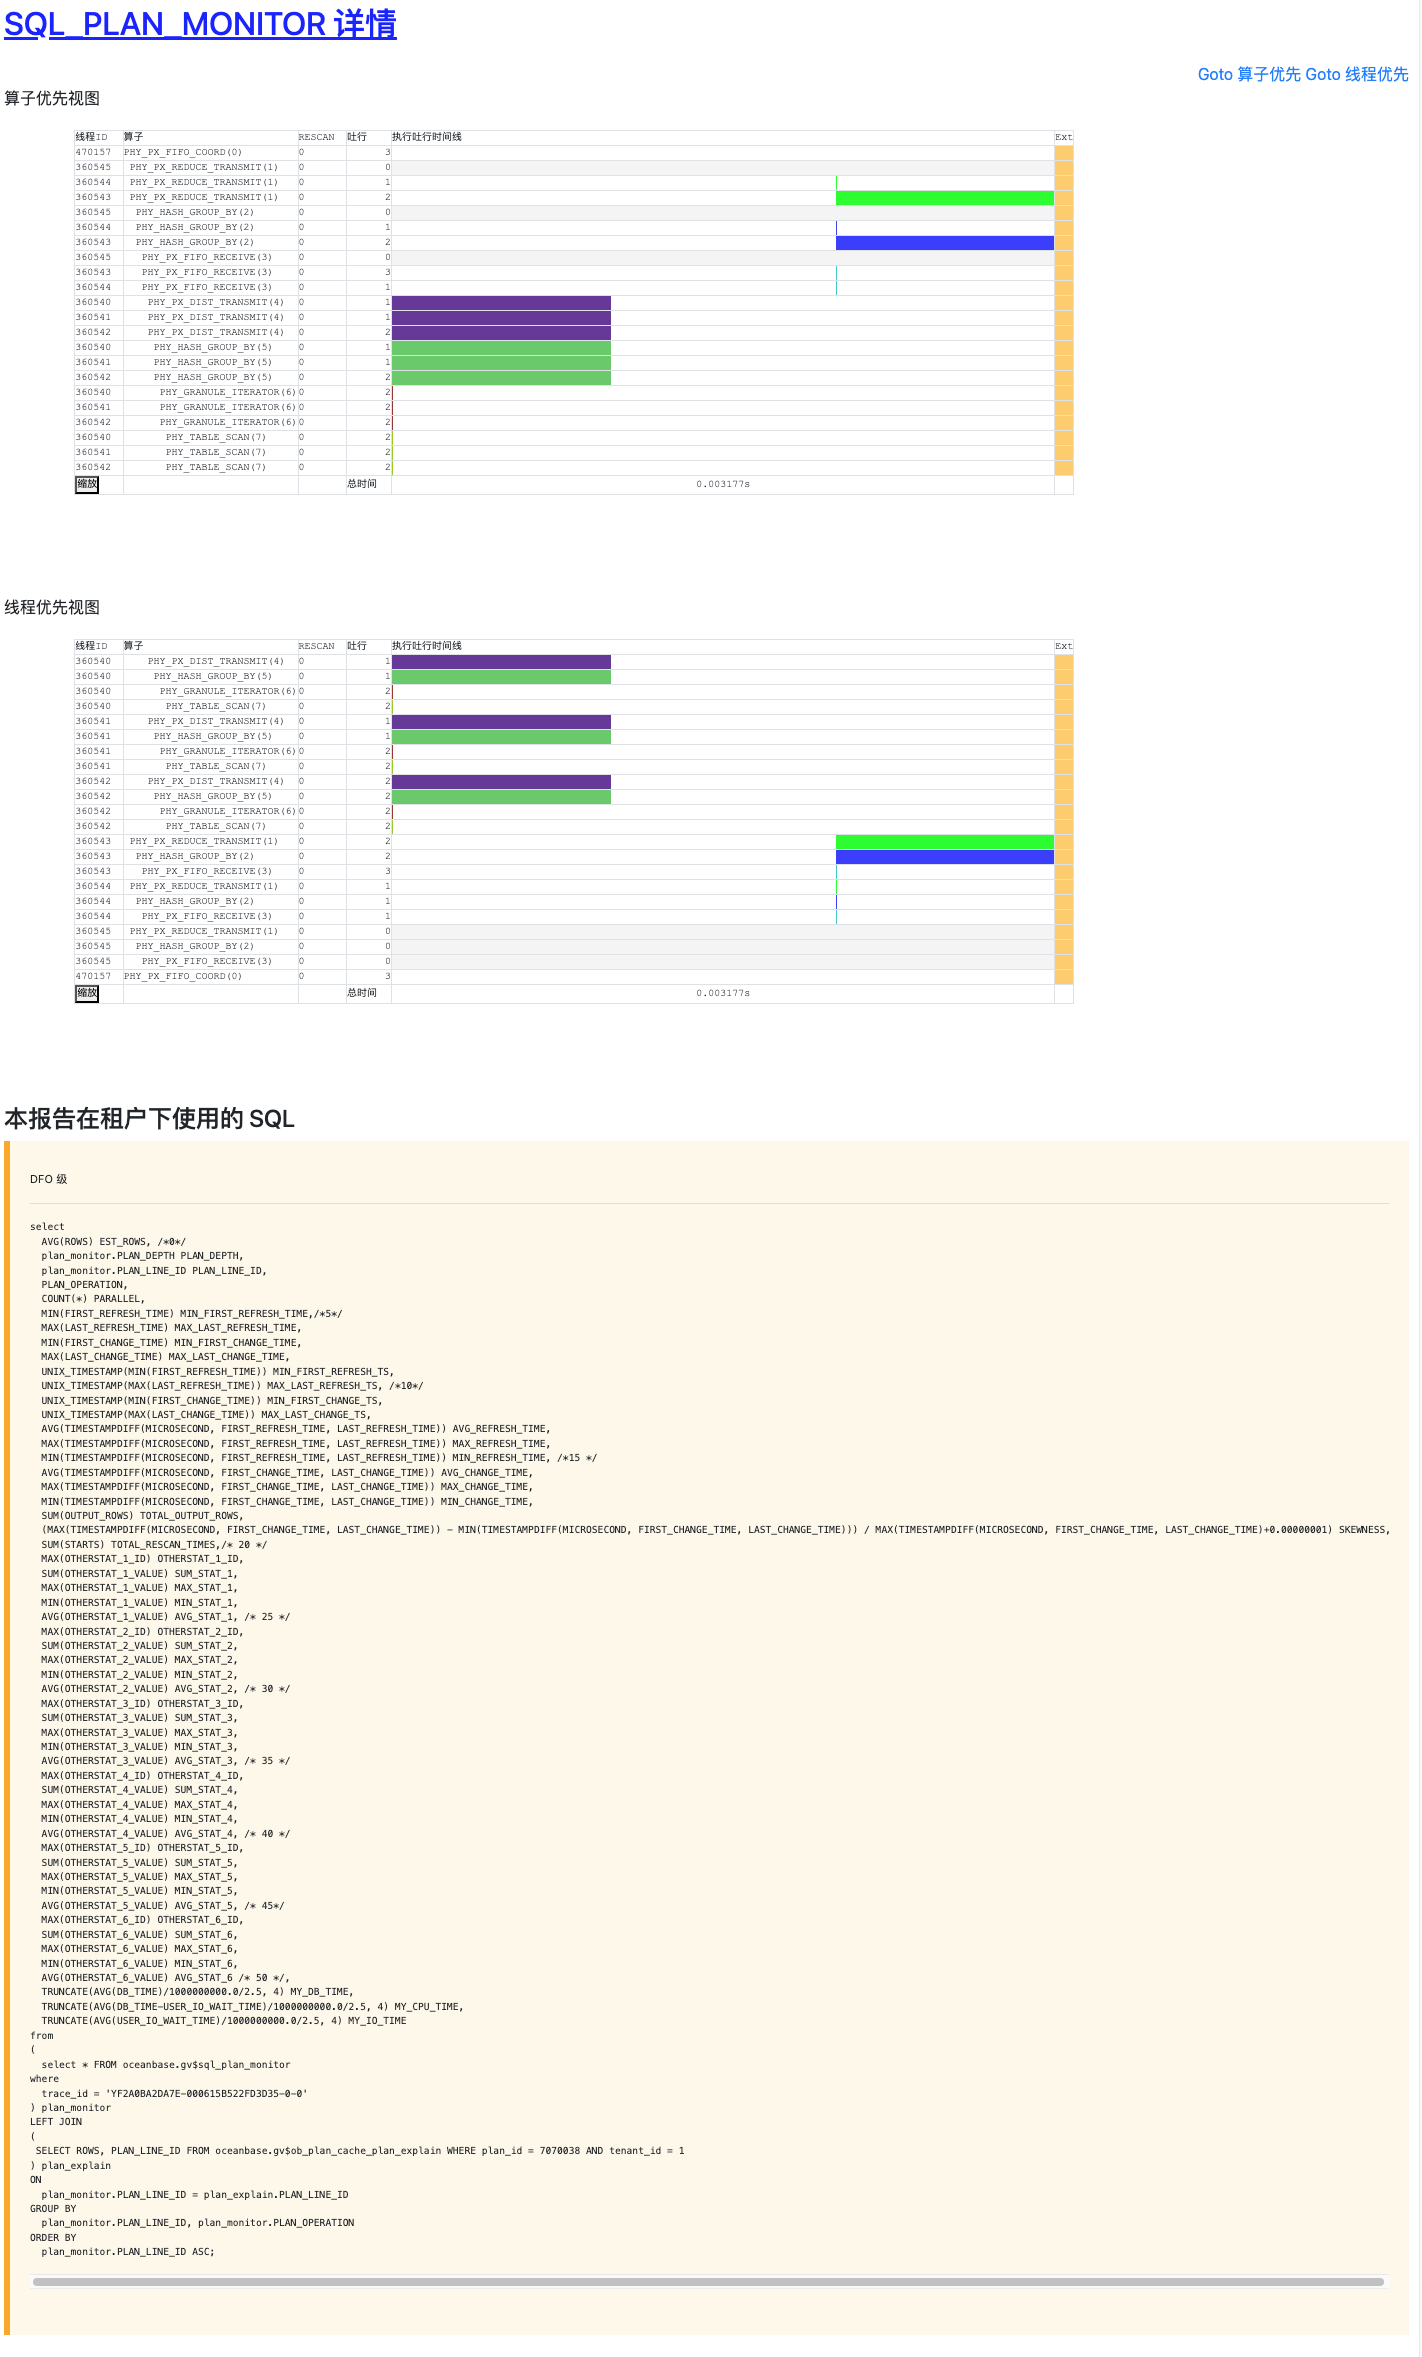
If you want to view detailed obdiag logs, please run: obdiag display-trace dade865c-27d2-11ef-bc35-cad6cd785756结果文件在obdiag_gather_pack_20240611171324中,其中sql_plan_monitor_report.html就是最终的结果,通过浏览器打开可看到完整的报告,不过在浏览器打开的时候请记得将resources问价夹一并放到目录下,否则打开的结果中看不到前端样式
#tree
.
├── resources
│   └── web
│       ├── bootstrap.min.css
│       ├── bootstrap.min.js
│       ├── jquery-3.2.1.min.js
│       └── popper.min.js
├── result_summary.txt
└── sql_plan_monitor_report.html

2 directories, 6 files
结果展示

4. 基于SQL场景的诊断信息收集
上面第三节的内容可以帮助你一条命令就搞定gvob_sql_audit、gvob_plan_cache_plan_stat、gvob_plan_cache_plan_explain、gvsql_plan_monitor、explain extend SQL、show create table、参数等信息的获取,一般情况下分析问题足够了,但是如果你想额外在获取日志等信息,有没有办法一条命令搞定,答案是:必须有。
#obdiag gather scene list

[Other Problem Gather Scenes]:
---------------------------------------------------------------------------------------
command                                                   info_en               info_cn
---------------------------------------------------------------------------------------
obdiag gather scene run --scene=other.application_error   [application error]   [应用报错问题]
---------------------------------------------------------------------------------------

[Obproxy Problem Gather Scenes]:
----------------------------------------------------------------------------------
command                                           info_en             info_cn
----------------------------------------------------------------------------------
obdiag gather scene run --scene=obproxy.restart   [obproxy restart]   [obproxy无故重启]
----------------------------------------------------------------------------------

[Observer Problem Gather Scenes]:
----------------------------------------------------------------------------------------------------------------------------------------------------------------------------------------------------------
command                                                                                                                                   info_en                                       info_cn
----------------------------------------------------------------------------------------------------------------------------------------------------------------------------------------------------------
obdiag gather scene run --scene=observer.backup                                                                                           [backup problem]                              [数据备份问题]
obdiag gather scene run --scene=observer.backup_clean                                                                                     [backup clean]                                [备份清理问题]
obdiag gather scene run --scene=observer.base                                                                                             [cluster base info]                           [集群基础信息]
obdiag gather scene run --scene=observer.clog_disk_full                                                                                   [clog disk full]                              [clog盘满]
obdiag gather scene run --scene=observer.cluster_down                                                                                     [cluster down]                                [集群无法连接]
obdiag gather scene run --scene=observer.compaction                                                                                       [compaction]                                  [合并问题]
obdiag gather scene run --scene=observer.cpu_high                                                                                         [High CPU]                                    [CPU高]
obdiag gather scene run --scene=observer.delay_of_primary_and_backup                                                                      [delay of primary and backup]                 [主备库延迟]
obdiag gather scene run --scene=observer.io                                                                                               [io problem]                                  [io问题]
obdiag gather scene run --scene=observer.log_archive                                                                                      [log archive]                                 [日志归档问题]
obdiag gather scene run --scene=observer.long_transaction                                                                                 [long transaction]                            [长事务]
obdiag gather scene run --scene=observer.memory                                                                                           [memory problem]                              [内存问题]
obdiag gather scene run --scene=observer.perf_sql --env "{db_connect='-h127.0.0.1 -P2881 -utest@test -p****** -Dtest', trace_id='Yxx'}"   [SQL performance problem]                     [SQL性能问题]
obdiag gather scene run --scene=observer.px_collect_log --env "{trace_id='Yxx', estimated_time='2024-06-11 19:25:08'}"                    [Collect error source node logs for SQL PX]   [SQL PX 收集报错源节点日志]
obdiag gather scene run --scene=observer.recovery                                                                                         [recovery]                                    [数据恢复问题]
obdiag gather scene run --scene=observer.restart                                                                                          [restart]                                     [observer无故重启]
obdiag gather scene run --scene=observer.rootservice_switch                                                                               [rootservice switch]                          [有主改选或者无主选举的切主]
obdiag gather scene run --scene=observer.sql_err --env "{db_connect='-h127.0.0.1 -P2881 -utest@test -p****** -Dtest', trace_id='Yxx'}"    [SQL execution error]                         [SQL 执行出错]
obdiag gather scene run --scene=observer.suspend_transaction                                                                              [suspend transaction]                         [悬挂事务]
obdiag gather scene run --scene=observer.unit_data_imbalance                                                                              [unit data imbalance]                         [unit迁移/缩小 副本不均衡问题]
obdiag gather scene run --scene=observer.unknown                                                                                          [unknown problem]                             [未能明确问题的场景]
----------------------------------------------------------------------------------------------------------------------------------------------------------------------------------------------------------
上面的obdiag gather scene list能查看到所有当前版本支持的场景化的信息采集,其中
obdiag gather scene run --scene=observer.perf_sql --env "{db_connect='-h127.0.0.1 -P2881 -utest@test -p****** -Dtest', trace_id='Yxx'}"专门针对的是sql性能问题的时候来一键获取诊断信息的.
例子:
#obdiag gather scene run --scene=observer.perf_sql --env "{db_connect='-h192.168.1.100 -P3881 -uxxxx -p***** -Dxxxxx', trace_id='YF2A0BA2DA7E-000615B522FD3D6E-0-0'}"
gather_scenes_run start ...
gather from_time: 2024-06-11 19:00:54, to_time: 2024-06-11 19:31:54
execute tasks: observer.base
run scene excute yaml mode in node: 192.168.1.100 start
run scene excute yaml mode in node: 192.168.1.100 end
gather log from_time: 2024-06-11 19:00:59, to_time: 2024-06-11 19:31:59

ZipFileInfo:
+----------------+-----------+
| Node           | LogSize   |
+================+===========+
| 192.168.1.100 | 1.222K    |
+----------------+-----------+
Download 192.168.1.100:/tmp/ob_log_192.168.1.100_20240611190059_20240611193159.zip
Downloading [====================] 100.0% [1.22 KB ]

Gather Ob Log Summary:
+----------------+-----------+--------+--------+-------------------------------------------------------------------------------------------------------+
| Node           | Status    | Size   | Time   | PackPath                                                                                              |
+================+===========+========+========+=======================================================================================================+
| 192.168.1.100 | Completed | 1.222K | 5 s    | /home/admin/obdiag_gather_pack_20240611193054/ob_log_192.168.1.100_20240611190059_20240611193159.zip |
+----------------+-----------+--------+--------+-------------------------------------------------------------------------------------------------------+
gather from_time: 2024-06-11 19:01:04, to_time: 2024-06-11 19:32:04
[WARN] No found the qualified log file on Server [192.168.1.100]
[WARN] 192.168.1.100 The number of log files is 0, The time range for file gather from 2024-06-11 19:01:04 to 2024-06-11 19:32:04, and no eligible files were found. Please adjust the query time limit.

Gather ObProxy Log Summary:
+----------------+----------------------+--------+--------+------------+
| Node           | Status               | Size   | Time   | PackPath   |
+================+======================+========+========+============+
| 192.168.1.100 | Error:No files found | 0.000B | 2 s    |            |
+----------------+----------------------+--------+--------+------------+

Gather Sql Plan Monitor Summary:
+-----------+-----------+--------+-----------------------------------------------+
| Cluster   | Status    | Time   | PackPath                                      |
+===========+===========+========+===============================================+
| obcluster | Completed | 0 s    | /home/admin/obdiag_gather_pack_20240611193054 |
+-----------+-----------+--------+-----------------------------------------------+

Gather scene results stored in this directory: /home/admin/obdiag_gather_pack_20240611193054

Trace ID: 1047fe6e-27e6-11ef-bbb0-cad6cd785756
If you want to view detailed obdiag logs, please run: obdiag display-trace 1047fe6e-27e6-11ef-bbb0-cad6cd785756

cd /home/admin/obdiag_gather_pack_20240611193054
.
├── ob_log_192.168.1.100_20240611190059_20240611193159.zip
├── resources
│   └── web
│       ├── bootstrap.min.css
│       ├── bootstrap.min.js
│       ├── jquery-3.2.1.min.js
│       └── popper.min.js
├── result_summary.txt
└── sql_result.txt
结果中除了第三章节的Planmonitor报告之外还会将trace_id相关的日志捞出来,同时会将集群的基本信息捞出来,sql_result.txt。真正做到了一条命令搞定SQL相关的所有信息,不需要再来回交互了。
5.附录
- obdiag 下载地址: OceanBase分布式数据库-海量数据 笔笔算数
- obdiag 官方文档: OceanBase分布式数据库-海量数据 笔笔算数
- obdiag github地址: GitHub - oceanbase/obdiag: obdiag (OceanBase Diagnostic Tool) is designed to help OceanBase users quickly gather necessary information and analyze the root cause of the problem.
- obdiag SIG 营地: 诊断工具 · OceanBase 技术交流