介绍[1](#介绍1)
R和python是两种不同的编程语言,前者是统计学家发明并且服务数学统计计算,后者则是最万能的胶水语言。随着大数据时代的到来,两者在数据分析领域存在越来越多的共同点且可以相互使用,为了破解二者的编程壁垒,CRAN收录了具有R接口的python包,从而使得两类语言的数据能共同使用。
reticulate[2](#2) 是用于Python和R之间协同操作的全套工具,在R和Rstudio中均可使用;要求Rstudio必须在1.2版本以上;
R
install.packages("reticulate")
library(reticulate)
特性
- reticulate 在R中支持多种方式调用python;
- 实现R和python对象之间的转换;
- 随意切换不同版本的python;
- R内使用
$调用python对象; - python内使用
.调用R对象; - 使用import函数导入python模块
import("os"); - source_python()获取任何Python脚本;
- 使用repl_python()交互使用python;
范例
R和python对同一数据进行可视化,可视化图形包括scatterplot,boxplot,barplot和heatmap等
散点图
R代码
R
library(dplyr)
library(ggplot2)

iris %>% mutate(Species=factor(Species, levels = c("setosa", "versicolor", "virginica"))) %>%
  ggplot(aes(x=Sepal.Width, y=Petal.Width, color=Species))+
  geom_point()+
  guides(color=guide_legend("", keywidth = .5, keyheight = .5))+
  labs(title = 'Scatter plot')+
  theme_bw()+
  scale_color_manual(values = c("red", "green", "blue"))+
  theme(plot.title = element_text(size = 10, color = "black", face = "bold", hjust = 0.5),
      axis.title = element_text(size = 10, color = "black", face = "bold"),
      axis.text = element_text(size = 9, color = "black"),
      text = element_text(size = 8, color = "black"),
      strip.text = element_text(size = 9, color = "black", face = "bold"),
      panel.grid = element_blank(),
      legend.position = c(1, 1),
      legend.justification = c(1, 1),
      legend.background = element_rect(fill="white", color = "black"))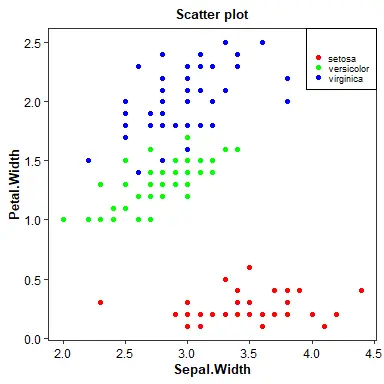
Python代码
python
dat = r.iris  # Python调用R内嵌数据使用r.data
species_map = {'setosa':1, 'versicolor':2, 'virginica':3}
dat['Species'] = dat['Species'].map(species_map)

import numpy as np
import matplotlib.pyplot as plt
# plt.scatter(dat['Sepal.Width'], dat['Petal.Width'], c=dat['Species'],
#      alpha=0.8, edgecolors='none', s=30, label=["1", "2", "3"])
# plt.title('Scatter plot in iris')
# plt.xlabel('Sepal.Width (cm)')
# plt.ylabel('Petal.Width (cm)')
# plt.legend(loc=1)
# plt.show()

dat1 = (np.array(dat[dat.Species==1]['Sepal.Width']),
        np.array(dat[dat.Species==1]['Petal.Width']))
dat2 = (np.array(dat[dat.Species==2]['Sepal.Width']),
        np.array(dat[dat.Species==2]['Petal.Width']))
dat3 = (np.array(dat[dat.Species==3]['Sepal.Width']),
        np.array(dat[dat.Species==3]['Petal.Width']))

mdat = (dat1, dat2, dat3)
colors = ("red", "green", "blue")
groups = ("setosa", "versicolor", "virginica")

# step1 build figure background
fig = plt.figure()

# step2 build axis
ax  = fig.add_subplot(1, 1, 1, facecolor='1.0')

# step3 build figure
for data, color, group in zip(mdat, colors, groups):
  x, y = data
  ax.scatter(x, y, alpha=0.8, c=color,
      edgecolors='none', s=30, label=group)

plt.title('Scatter plot')
plt.legend(loc=1)

# step4 show figure in the screen
plt.show() 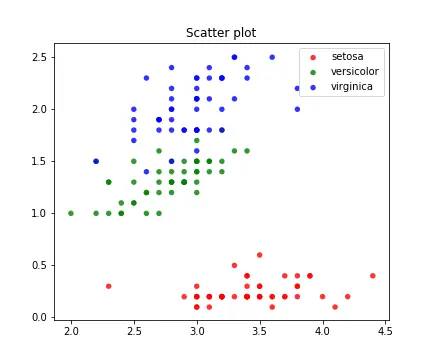
箱形图
R代码
R
library(dplyr)
library(ggplot2)

iris %>% mutate(Species=factor(Species, levels = c("setosa", "versicolor", "virginica"))) %>%
  ggplot(aes(x=Species, y=Sepal.Width, fill=Species))+
  stat_boxplot(geom = "errorbar", width = .12)+
  geom_boxplot(width = .3, outlier.shape = 3, outlier.size = 1)+
  guides(fill=guide_legend(NULL, keywidth = .5, keyheight = .5))+
  xlab("")+
  theme_bw()+
  scale_fill_manual(values = c("red", "green", "blue"))+
  theme(plot.title = element_text(size = 10, color = "black", face = "bold", hjust = 0.5),
      axis.title = element_text(size = 10, color = "black", face = "bold"),
      axis.text = element_text(size = 9, color = "black"),
      text = element_text(size = 8, color = "black"),
      strip.text = element_text(size = 9, color = "black", face = "bold"),
      panel.grid = element_blank(),
      legend.position = c(1, 1),
      legend.justification = c(1, 1),
      legend.background = element_rect(fill="white", color = "black"))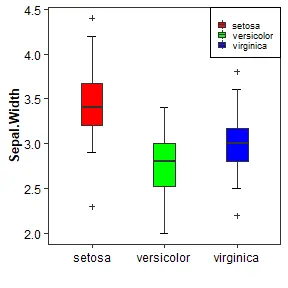
Python代码
python
dat = r.iris  # Python调用R内嵌数据使用r.data
species_map = {'setosa':1, 'versicolor':2, 'virginica':3}
dat['Species'] = dat['Species'].map(species_map)

import numpy as np
import matplotlib.pyplot as plt
import matplotlib.patches as mpatches

dat11 = (np.array(dat[dat.Species==1]['Sepal.Width']))
dat21 = (np.array(dat[dat.Species==2]['Sepal.Width']))
dat31 = (np.array(dat[dat.Species==3]['Sepal.Width']))

mdat2 = (dat11, dat21, dat31)
colors = ("red", "green", "blue")
groups = ("setosa", "versicolor", "virginica")

fig = plt.figure()
axes = fig.add_subplot(facecolor='1.0')
bplot = axes.boxplot(mdat2, patch_artist=True, notch=0, sym='+', vert=1, whis=1.5,
  whiskerprops = dict(linestyle='--',linewidth=1.2, color='black'))

# color
for patch, color in zip(bplot['boxes'], colors):
  patch.set_facecolor(color)

# axes labels
plt.setp(axes, xticks=[1,2,3],
         xticklabels=["setosa", "versicolor", "virginica"])

red_patch = mpatches.Patch(color='red', label='setosa')
green_patch = mpatches.Patch(color='green', label='versicolor')
blue_patch = mpatches.Patch(color='blue', label='virginica')

plt.legend(handles=[red_patch, green_patch, blue_patch], loc=1)

plt.show()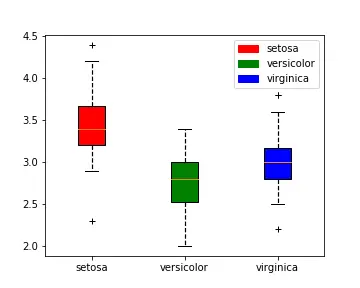
条形图
R代码
R
library(dplyr)
library(ggplot2)

iris %>% mutate(Species=factor(Species, levels = c("setosa", "versicolor", "virginica"))) %>%
  select(Species, Sepal.Width) %>% group_by(Species) %>%
  summarize(avg=mean(Sepal.Width), n=n(), sd=sd(Sepal.Width), se=sd/sqrt(n)) %>%
  ungroup() %>%
  ggplot(aes(x=Species, y=avg, fill=Species))+
  geom_bar(stat="identity", width=.4, color="black")+
  geom_errorbar(aes(ymin=avg-sd, ymax=avg+sd), width=.15,
                 position=position_dodge(.9), size=1)+
  guides(fill=guide_legend(NULL, keywidth = .5, keyheight = .5))+
  xlab("")+
  ylab("Sepal.Width")+
  scale_y_continuous(breaks=seq(0, 3.5,0.5), limits=c(0, 4.4),expand = c(0,0))+
  theme_bw()+
  scale_fill_manual(values = c("red", "green", "blue"))+
  theme(axis.title = element_text(size = 10, color = "black", face = "bold"),
      axis.text = element_text(size = 9, color = "black"),
      text = element_text(size = 8, color = "black"),
      strip.text = element_text(size = 9, color = "black", face = "bold"),
      panel.grid = element_blank(),
      legend.position = c(1, 1),
      legend.justification = c(1, 1),
      legend.background = element_rect(fill="white", color = "black"))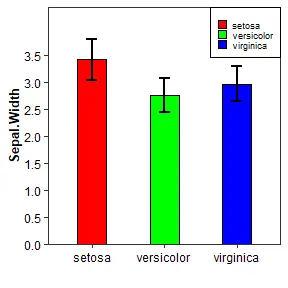
Python代码
python
dat = r.iris  # Python调用R内嵌数据使用r.data
species_map = {'setosa':1, 'versicolor':2, 'virginica':3}
dat['Species'] = dat['Species'].map(species_map)

import numpy as np
import pandas as pd
import matplotlib.pyplot as plt

mean = list(dat['Sepal.Width'].groupby(dat['Species']).mean())
sd   = list(dat.groupby('Species').agg(np.std, ddof=0)['Sepal.Width'])

df = pd.DataFrame({'mean':mean}, index=["setosa", "versicolor", "virginica"])
df.plot(kind='bar', alpha=0.75, rot=0, edgecolor='black',
        yerr=sd, align='center', ecolor='black', capsize=5,
        color=("red", "green", "blue"),
        ylim=(0.0, 4.4),
        yticks=list(np.arange(0, 4.0, 0.5)))

# xlabel
plt.xlabel('')
plt.ylabel('Sepal.Width')

# legend
red_patch = mpatches.Patch(color='red', label='setosa')
green_patch = mpatches.Patch(color='green', label='versicolor')
blue_patch = mpatches.Patch(color='blue', label='virginica')
plt.legend(handles=[red_patch, green_patch, blue_patch],   # color and group
    loc=1,                # location
    prop={'size': 8})     # size
plt.show()
心得
初次使用reticulate的感觉还不错,可以比较完美串联R和Python,尤其是在Rmarkdown文件内使用R和Python代码,但缺点也很明显:
- 运行Python cell没有详细报错信息;
- 粗略的报错提示行信息不以Rmd文件整体行作为开始;
- 无法兼容带有汉字的注释信息;
- 无法像R一样查看python环境下变量;
- 出错后有时无任何报错信息
根据visual studio code的最新python插件公布情况看,以后vsc可以完美兼容Jupyter notebook格式文件,因此如果想单独使用python但无较好交互编辑器,可以使用vsc的python插件读取ipynb文件[3](#3)