Dataset Information
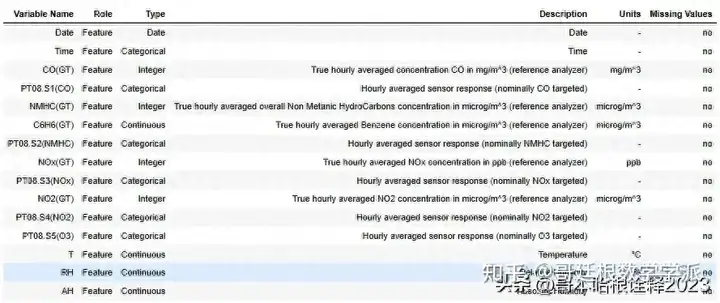
Importing
import pandas as pd
import numpy as np
import matplotlib.pyplot as plt
from sklearn.preprocessing import MinMaxScaler
from sklearn.metrics import mean_squared_error, r2_score, mean_absolute_error
from keras.models import Sequential
from keras.layers import Dense, LSTM
from tensorflow.keras.callbacks import EarlyStopping
from tensorflow.keras.layers import Dropout
from tensorflow.keras.optimizers import Adam
from sklearn.model_selection import train_test_split
import seaborn as sns
import warnings
warnings.filterwarnings("ignore")
Loading the dfset
# pip install ucimlrepo
from ucimlrepo import fetch_ucirepo
# fetch dataset
air_quality = fetch_ucirepo(id=360)

df = air_quality.data.features
Exploring and Preprocessing the dfset
df.shape
(9357, 15)
df.head()
df['DateTime'] = pd.to_datetime(df['Date'] + ' ' + df['Time'])
df.drop(['Date', 'Time'], axis=1, inplace=True)
df['DateTime'].head(2)
0   2004-03-10 18:00:00
1   2004-03-10 19:00:00
Name: DateTime, dtype: datetime64[ns]
Missing Values
# List of columns to check for missing values
columns = df.columns


# Loop through each column and replace -200 with NaN
for column in columns:
    df[column].replace(-200, np.nan, inplace=True)


df.head()
def missing_vals(df):
    total_miss_vals = df.isnull().sum()
    percent_miss_vals = (df.isnull().sum() / len(df)) * 100

    miss_val_dtframe = pd.concat([total_miss_vals , percent_miss_vals] , axis = 1)
    miss_val_dtframe = miss_val_dtframe.rename(columns = {0 : 'Missing Counts', 1: 'Missing %'})
    miss_val_dtframe = miss_val_dtframe[miss_val_dtframe['Missing Counts'] != 0]
    miss_val_dtframe = miss_val_dtframe.sort_values(by = 'Missing Counts' , ascending=False)

    print(f"{len(miss_val_dtframe)} out of {df.shape[1]} columns have missing values")

    return miss_val_dtframe
missing_vals(df)
|---------------|----------------|-----------|
| | Missing Counts | Missing % |
| NMHC(GT) | 8443 | 90.231912 |
| CO(GT) | 1683 | 17.986534 |
| NO2(GT) | 1642 | 17.548360 |
| NOx(GT) | 1639 | 17.516298 |
| PT08.S1(CO) | 366 | 3.911510 |
| C6H6(GT) | 366 | 3.911510 |
| PT08.S2(NMHC) | 366 | 3.911510 |
| PT08.S3(NOx) | 366 | 3.911510 |
| PT08.S4(NO2) | 366 | 3.911510 |
| PT08.S5(O3) | 366 | 3.911510 |
| T | 366 | 3.911510 |
| RH | 366 | 3.911510 |
| AH | 366 | 3.911510 |
Handling Missing Values in Time Series Data
df.drop(['NMHC(GT)'] ,axis = 1 ,  inplace = True)
# Replace missing values with forward fill method
df.fillna(method='ffill', inplace=True)


# Verify if there are any remaining missing values
print("Missing values count after handling:")


missing_values_after = missing_vals(df)
print(missing_values_after)
Missing values count after handling:
0 out of 13 columns have missing values
Empty DataFrame
Columns: [Missing Counts, Missing %]
Index: []
Purpose of the Graphs
# Get column names except for the last column ('Date')
groups = df.columns[:-1]  # Exclude the last column assuming it's 'Date'


plt.figure(figsize=(25, 50))


# Iterate over each column and plot
for i, group in enumerate(groups, start=1):
    plt.subplot(len(groups), 1, i)
    plt.plot(df['DateTime'], df[group])
    plt.title(group, y=0.5, loc='right', fontsize=25)
    plt.xlabel('DateTime', fontsize=20)
    plt.ylabel(group, fontsize=20)
    plt.xticks(fontsize=20)
    plt.yticks(fontsize=20)


plt.tight_layout()
plt.show()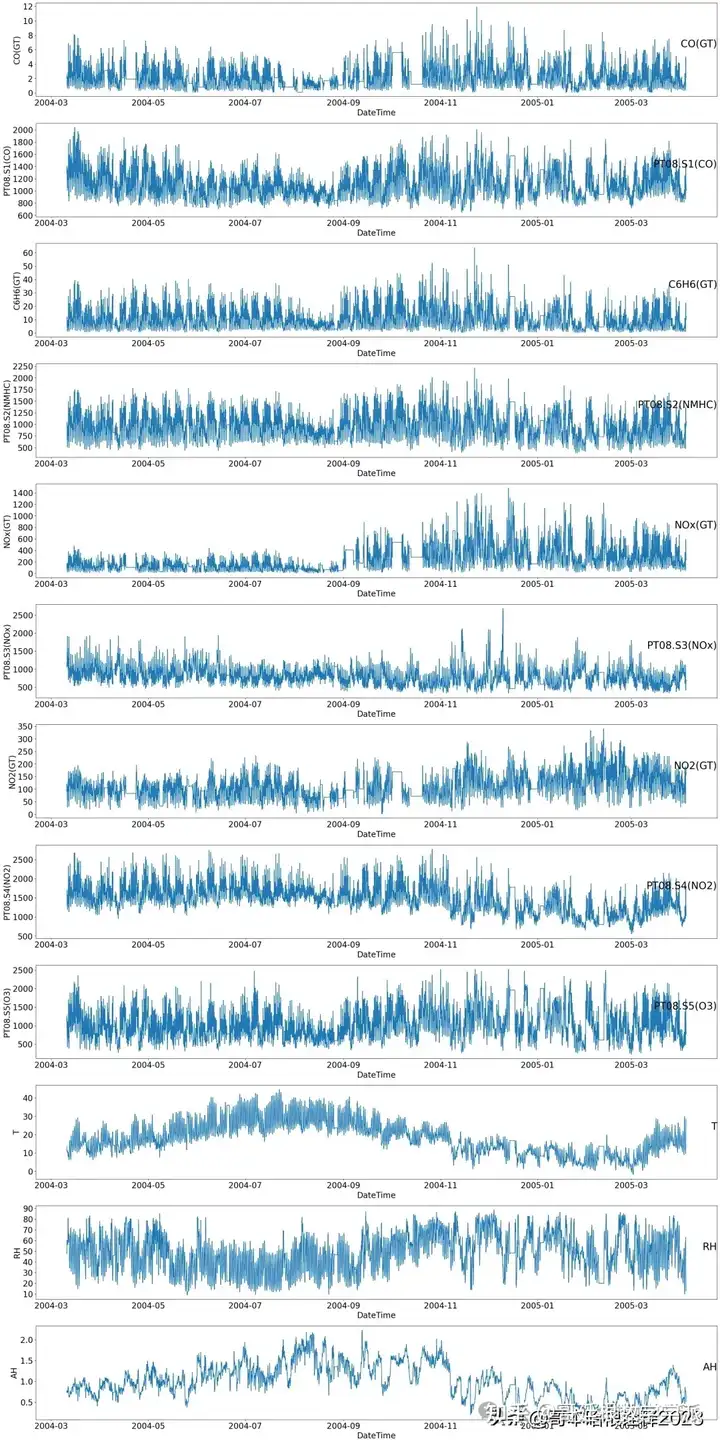
plt.figure(figsize=(25, 50))


# Iterate over each column and plot histogram
for i, group in enumerate(groups, start=1):
    plt.subplot(len(groups), 1, i)
    df[group].hist(bins=50 , edgecolor='black')
    plt.title(group, fontsize=25)
    plt.xlabel(group, fontsize=20)
    plt.ylabel('Frequency', fontsize=20)
    plt.xticks(fontsize=20)
    plt.yticks(fontsize=20)


plt.tight_layout()
plt.show()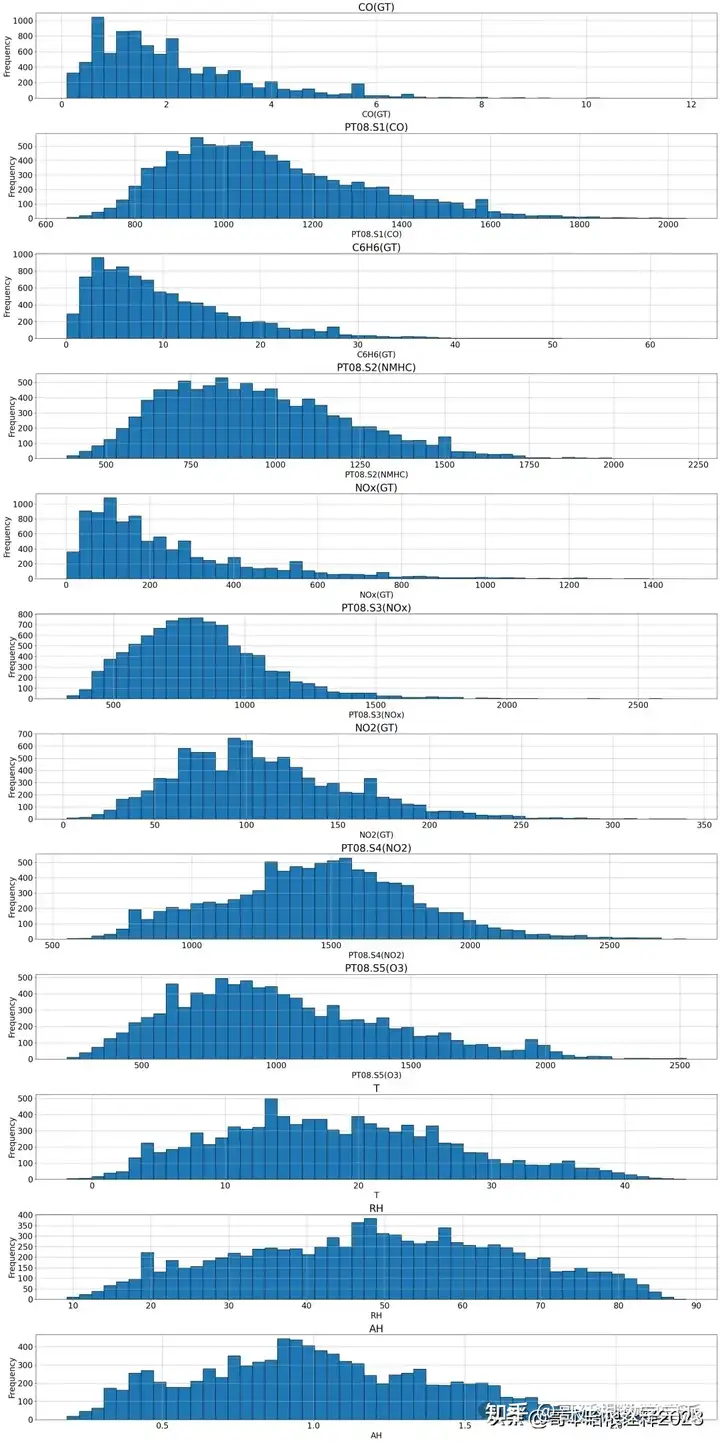
Data Types Distribution
dtype_counts = df.dtypes.value_counts()
print(dtype_counts)
Correlations
sns.set(style="white")


corr = df.corr()
corr['RH'].sort_values()
T               -0.570775
NO2(GT)         -0.098619
PT08.S2(NMHC)   -0.082087
PT08.S3(NOx)    -0.060581
C6H6(GT)        -0.054949
PT08.S4(NO2)    -0.015158
CO(GT)           0.041975
PT08.S1(CO)      0.120042
PT08.S5(O3)      0.137821
AH               0.180512
NOx(GT)          0.184418
RH               1.000000
Name: RH, dtype: float64
plt.figure(figsize=(10, 6))


# Plot the bar graph for correlation coefficients with RH
bar = df.corr()['RH'].sort_values()
bar.plot(kind='bar', color='blue', edgecolor='black')  # Add edgecolor parameter for edges


# Customize the plot
plt.title('Correlation Coefficients with Relative Humidity (RH)', fontsize=16)
plt.xlabel('Variables')
plt.ylabel('Correlation Coefficient')
plt.xticks(rotation=45)
plt.grid(axis='y', linestyle='--', alpha=0.7)


plt.tight_layout()
plt.show()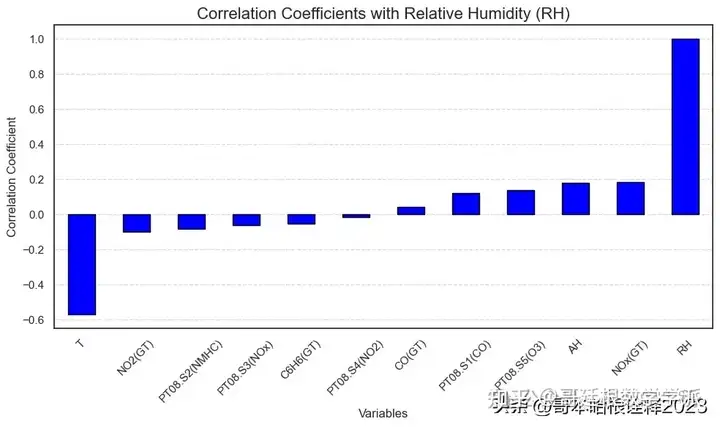
# Set up the matplotlib figure
f, ax = plt.subplots(figsize=(11, 9))


# Generate a custom diverging colormap
cmap = sns.diverging_palette(220, 10, as_cmap=True)


# Draw the heatmap with the correct aspect ratio, including annotations
sns.heatmap(corr, cmap=cmap, center=0,
            square=True, linewidths=.5, cbar_kws={"shrink": .5},
            annot=True, fmt=".2f", annot_kws={"size": 10})


plt.title('Correlation Matrix Heatmap', fontsize=16)
plt.show()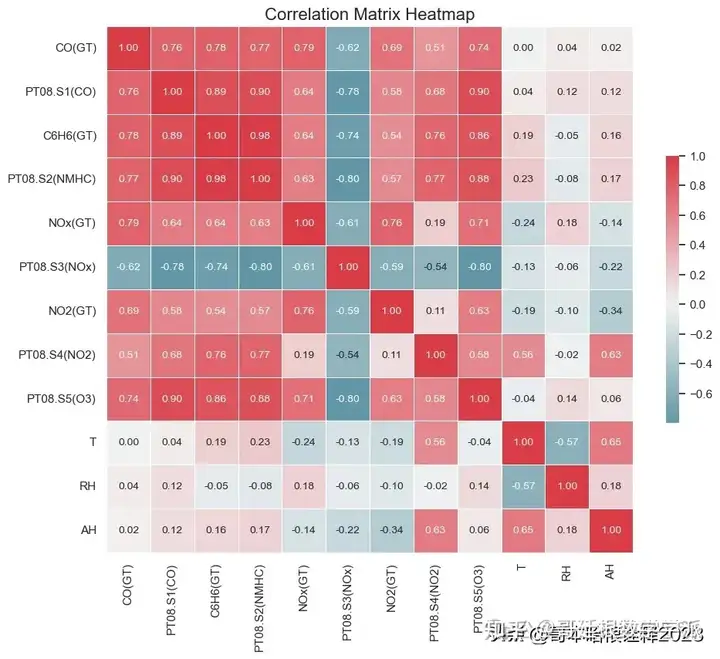
Histogram of Relative Humidity (RH)
plt.figure(figsize=(10, 6))


# Plot the histogram for RH
(df['RH']).plot.hist(bins=30, edgecolor='black')


# Customize the plot
plt.title('Histogram of Relative Humidity (RH)', fontsize=16)
plt.xlabel('Relative Humidity')
plt.ylabel('Frequency')


# Display the plot
plt.show()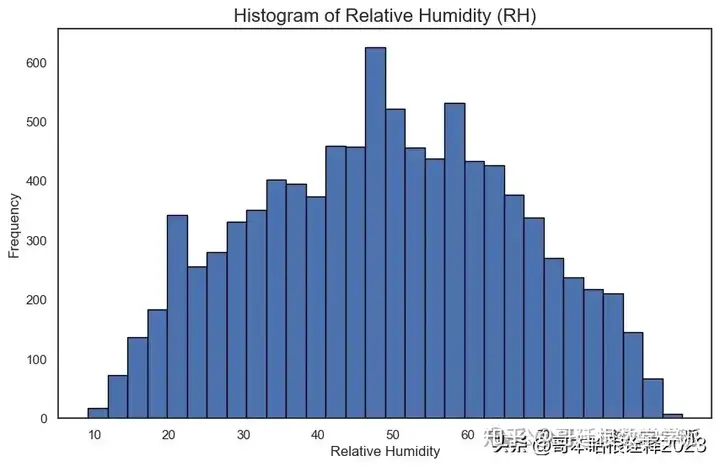
df = df[['T', 'NO2(GT)', 'PT08.S2(NMHC)', 'PT08.S3(NOx)', 'C6H6(GT)', 'PT08.S4(NO2)', 'CO(GT)', 'PT08.S1(CO)', 'PT08.S5(O3)', 'AH', 'NOx(GT)', 'RH']]

担任《Mechanical System and Signal Processing》审稿专家,担任《中国电机工程学报》,《控制与决策》等EI期刊审稿专家,擅长领域:现代信号处理,机器学习,深度学习,数字孪生,时间序列分析,设备缺陷检测、设备异常检测、设备智能故障诊断与健康管理PHM等。


知乎学术咨询:https://www.zhihu.com/consult/people/792359672131756032?isMe=1