基于Spark 的零售交易数据挖掘分析与可视化
本文将带你通过 PySpark 进行电商数据的分析处理,并将结果保存为 JSON 文件,供前端展示。我们将从数据的读取、处理、分析到结果保存和网页展示,覆盖完整的数据流。项目结构如下:
1、Spark 分析数据
2、生成 JSON 文件
3、使用 Bottle 框架搭建简单 Web 服务器
项目简介
我们使用了 PySpark 来处理一个电商数据集,数据存储在 HDFS 上。通过 SQL 和 RDD 操作实现了多个业务需求分析,并最终将结果保存为 JSON 文件,用于前端展示。后端 Web 服务采用 Bottle 框架,提供静态文件服务和页面展示。
数据集介绍
数据集包括了以下字段:
InvoiceNo: 订单号
StockCode: 商品编码
Description: 商品描述
Quantity: 数量
InvoiceDate: 订单日期
UnitPrice: 商品单价
CustomerID: 客户编号
Country: 国家

1. 数据读取
首先,我们从 HDFS 中读取 CSV 文件作为 Spark 的 DataFrame,并通过 createOrReplaceTempView 创建 SQL 查询视图。代码如下:
python
# 从HDFS中读取数据集为DataFrame
df = spark.read.format('com.databricks.spark.csv').options(header='true', inferschema='true').load('../data/E_Commerce_Data.csv')
df.createOrReplaceTempView("data")
2. 分析任务
通过 SQL 查询和 RDD 操作,项目实现了以下 10 项数据分析任务:
- 客户数最多的 10 个国家
通过 SQL 查询,统计每个国家的客户数,并选出客户数最多的 10 个国家:
python
def countryCustomer():
    countryCustomerDF = spark.sql("SELECT Country,COUNT(DISTINCT CustomerID) AS countOfCustomer FROM data GROUP BY Country ORDER BY countOfCustomer DESC LIMIT 10")
    return countryCustomerDF.collect()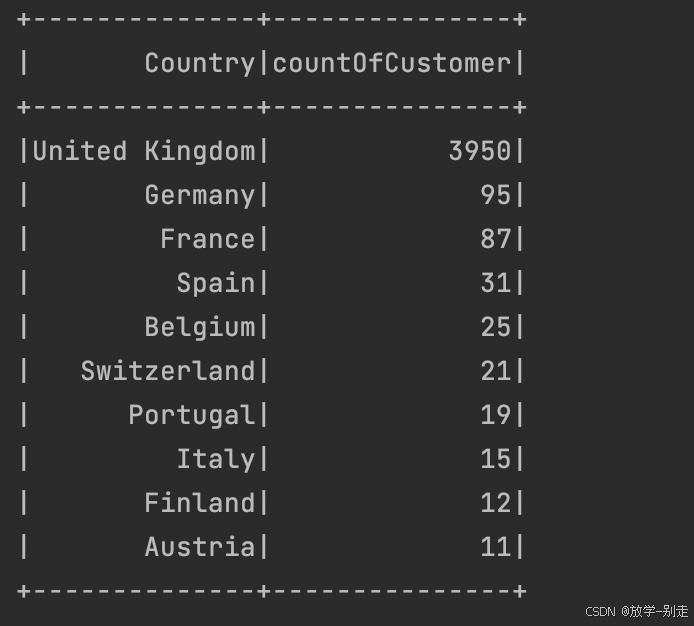
- 销量最高的 10 个国家
统计每个国家的商品销量,并选出销量最高的 10 个国家:
python
def countryQuantity():
    countryQuantityDF = spark.sql("SELECT Country,SUM(Quantity) AS sumOfQuantity FROM data GROUP BY Country ORDER BY sumOfQuantity DESC LIMIT 10")
    return countryQuantityDF.collect()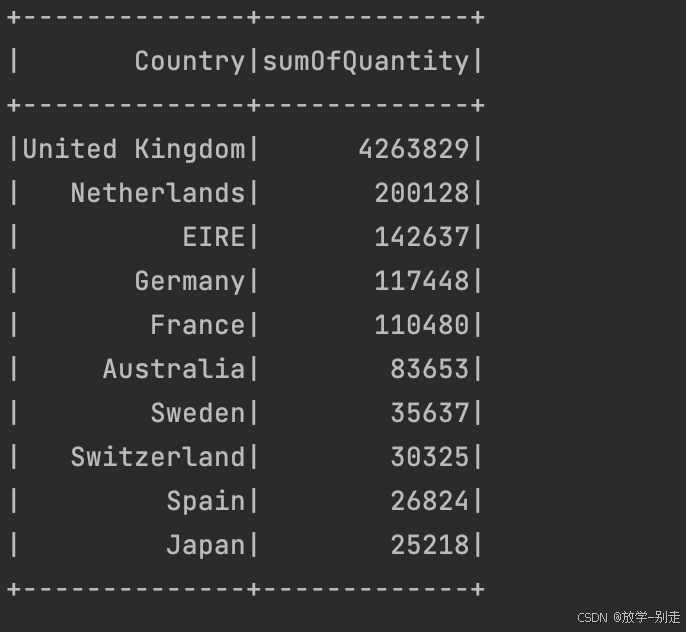
- 各国总销售额分布
计算每个国家的销售额,结果按销售额大小进行排序:
python
def countrySumOfPrice():
    countrySumOfPriceDF = spark.sql("SELECT Country,SUM(UnitPrice*Quantity) AS sumOfPrice FROM data GROUP BY Country")
    return countrySumOfPriceDF.collect()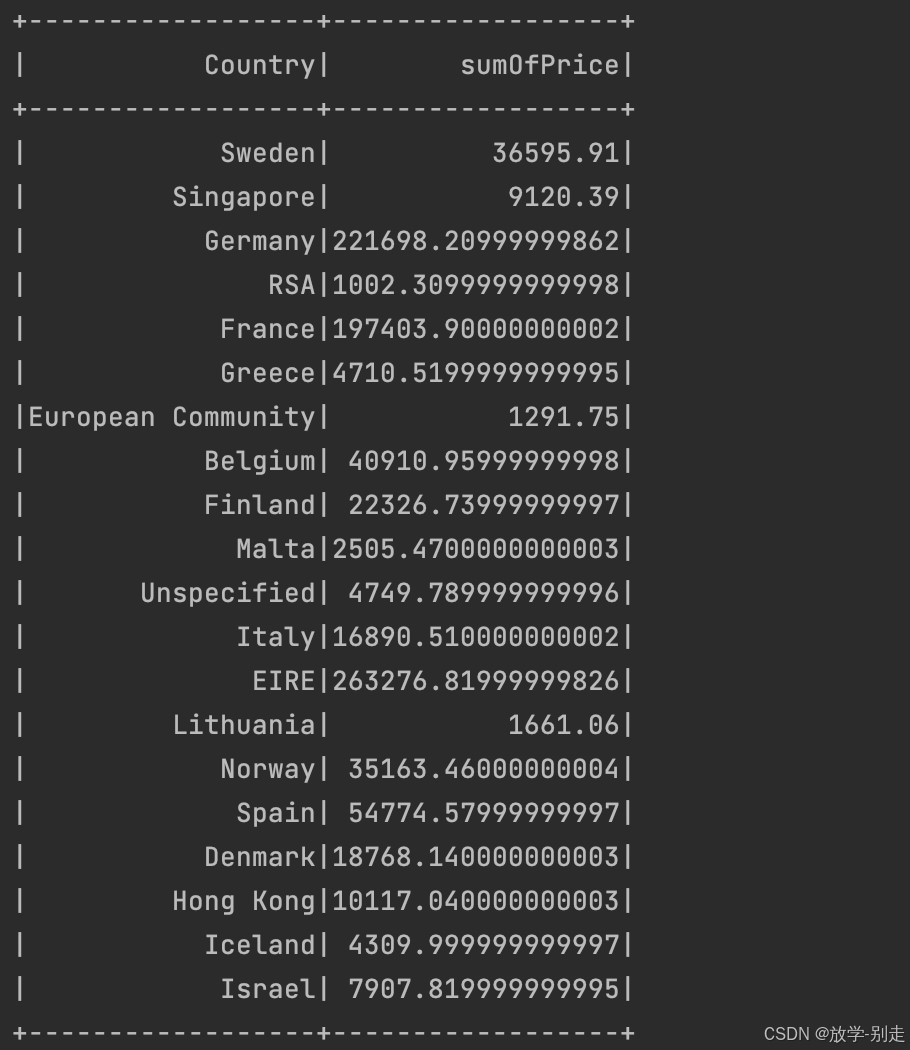
- 销量最高的 10 个商品
统计商品的销量,按销量大小选出销量最高的 10 个商品:
python
def stockQuantity():
    stockQuantityDF = spark.sql("SELECT StockCode,SUM(Quantity) AS sumOfQuantity FROM data GROUP BY StockCode ORDER BY sumOfQuantity DESC LIMIT 10")
    return stockQuantityDF.collect()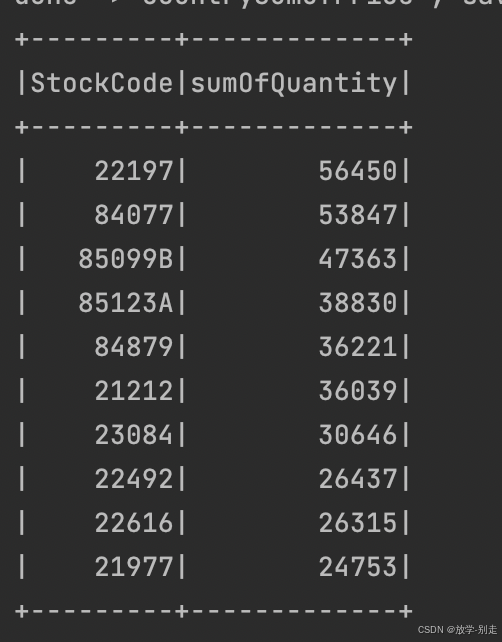
- 商品描述的热门关键词 Top 300
通过对商品描述字段进行分词和词频统计,得到最热门的 300 个关键词:
python
def wordCount():
    wordCount = spark.sql("SELECT LOWER(Description) as description from data").rdd.filter(lambda line:line['description'] is not None).flatMap(lambda line:line['description'].split(" ")).map(lambda word:(word,1)).reduceByKey(lambda a,b:a+b).repartition(1).sortBy(lambda x:x[1],False)
    wordCountSchema = StructType([StructField("word", StringType(), True),StructField("count", IntegerType(), True)])
    wordCountDF = spark.createDataFrame(wordCount, wordCountSchema)
    return wordCountDF.take(300)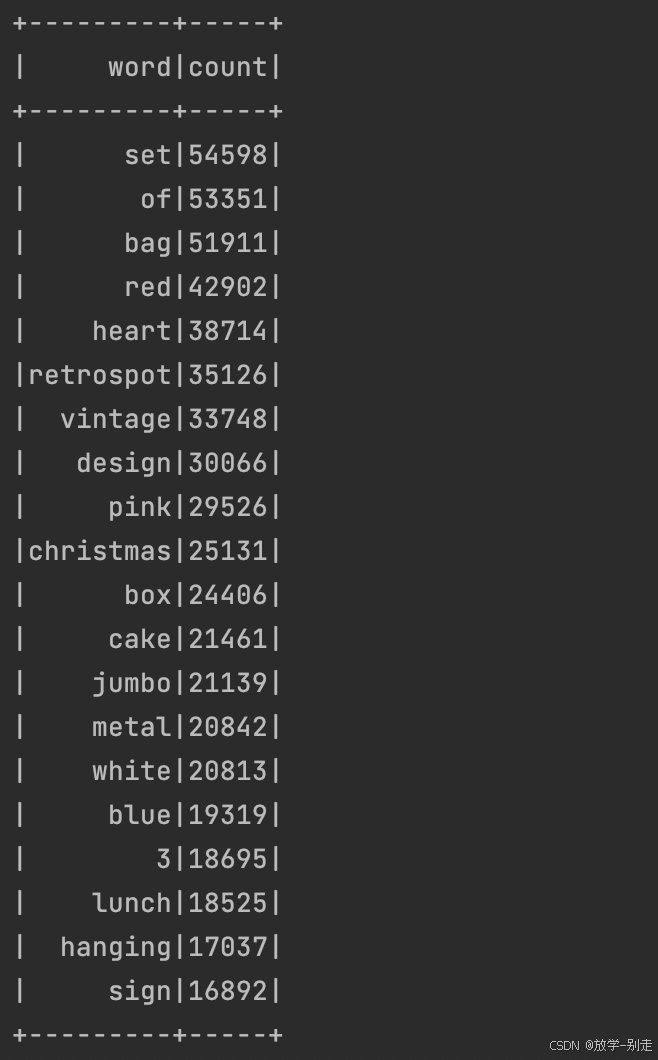
- 退货订单数最多的 10 个国家
统计退货订单数量最多的 10 个国家,退货订单的 InvoiceNo 以 'C' 开头:
python
def countryReturnInvoice():
    countryReturnInvoiceDF = spark.sql("SELECT Country,COUNT(DISTINCT InvoiceNo) AS countOfReturnInvoice FROM data WHERE InvoiceNo LIKE 'C%' GROUP BY Country ORDER BY countOfReturnInvoice DESC LIMIT 10")
    return countryReturnInvoiceDF.collect()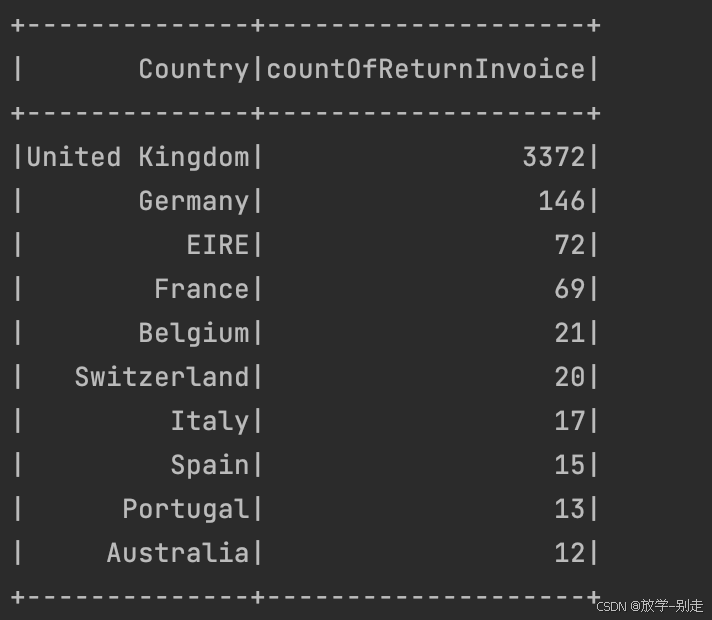
- 月销售额随时间的变化趋势
通过提取 InvoiceDate 中的年份和月份,计算每月的销售额:
python
def tradePrice():
    result3 = formatData()
    result4 = result3.map(lambda line:(line[0]+"-"+line[1],line[3]*line[4]))
    result5 = result4.reduceByKey(lambda a,b:a+b).sortByKey()
    schema = StructType([StructField("date", StringType(), True),StructField("tradePrice", DoubleType(), True)])
    tradePriceDF = spark.createDataFrame(result5, schema)
    return tradePriceDF.collect()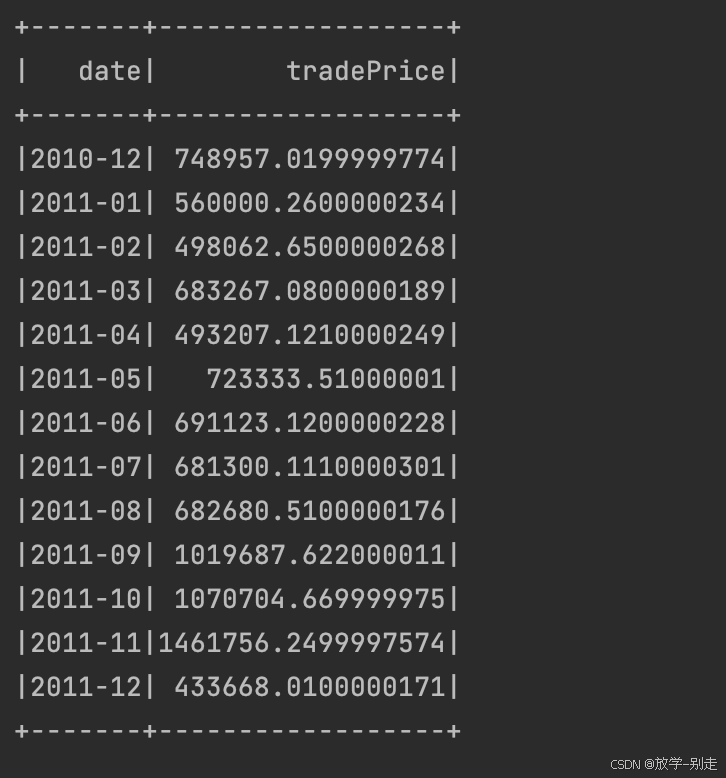
- 日销量随时间的变化趋势
计算每天的销售量变化趋势,提取 InvoiceDate 的年、月、日,并进行汇总:
python
def saleQuantity():
    result3 = formatData()
    result4 = result3.map(lambda line:(line[0]+"-"+line[1]+"-"+line[2],line[3]))
    result5 = result4.reduceByKey(lambda a,b:a+b).sortByKey()
    schema = StructType([StructField("date", StringType(), True),StructField("saleQuantity", IntegerType(), True)])
    saleQuantityDF = spark.createDataFrame(result5, schema)
    return saleQuantityDF.collect()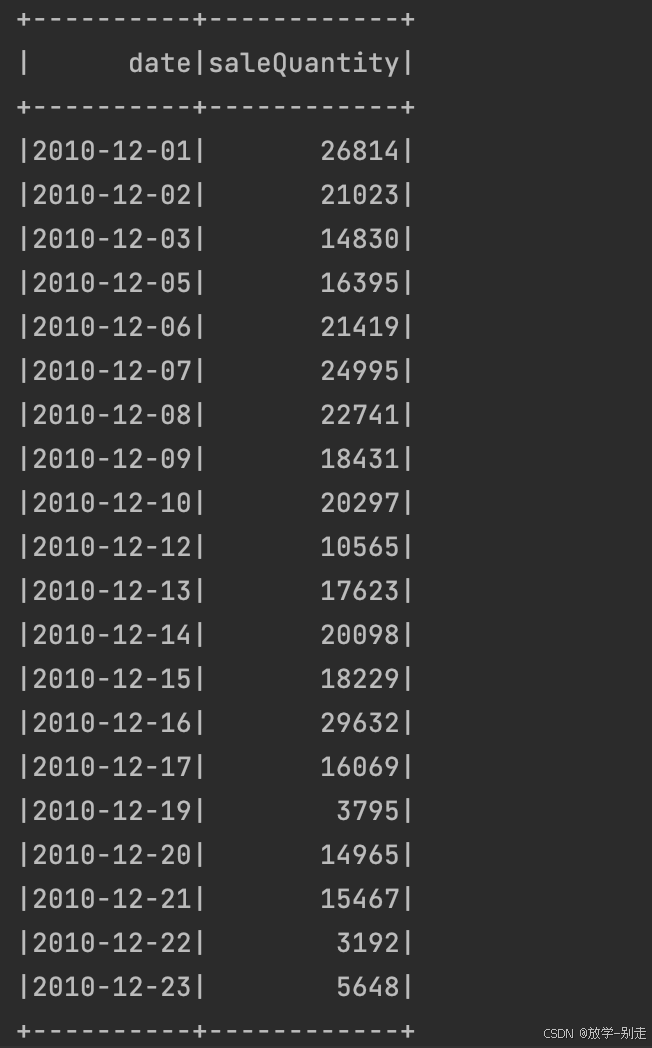
- 各国购买订单量与退货订单量的关系
通过联表查询,展示每个国家的购买订单量与退货订单量的关系:
python
def buyReturn():
    returnDF = spark.sql("SELECT Country AS Country,COUNT(DISTINCT InvoiceNo) AS countOfReturn FROM data WHERE InvoiceNo LIKE 'C%' GROUP BY Country")
    buyDF = spark.sql("SELECT Country AS Country2,COUNT(DISTINCT InvoiceNo) AS countOfBuy FROM data WHERE InvoiceNo NOT LIKE 'C%' GROUP BY Country2")
    buyReturnDF = returnDF.join(buyDF, returnDF["Country"] == buyDF["Country2"], "left_outer")
    buyReturnDF = buyReturnDF.select(buyReturnDF["Country"],buyReturnDF["countOfBuy"],buyReturnDF["countOfReturn"])
    return buyReturnDF.collect()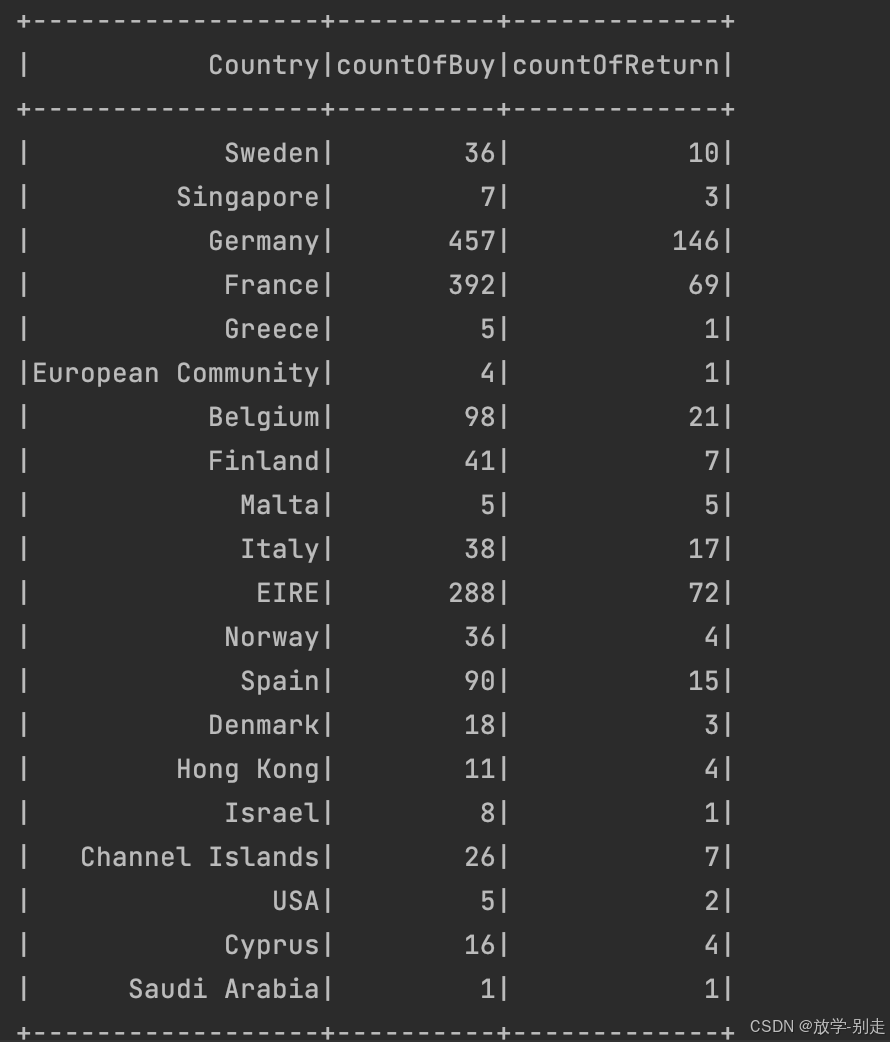
- 商品的平均单价与销量的关系
通过计算每个商品的平均单价和总销量,展示二者的关系:
python
def unitPriceSales():
    unitPriceSalesDF = spark.sql("SELECT StockCode,AVG(DISTINCT UnitPrice) AS avgUnitPrice,SUM(Quantity) AS sumOfQuantity FROM data GROUP BY StockCode")
    return unitPriceSalesDF.collect()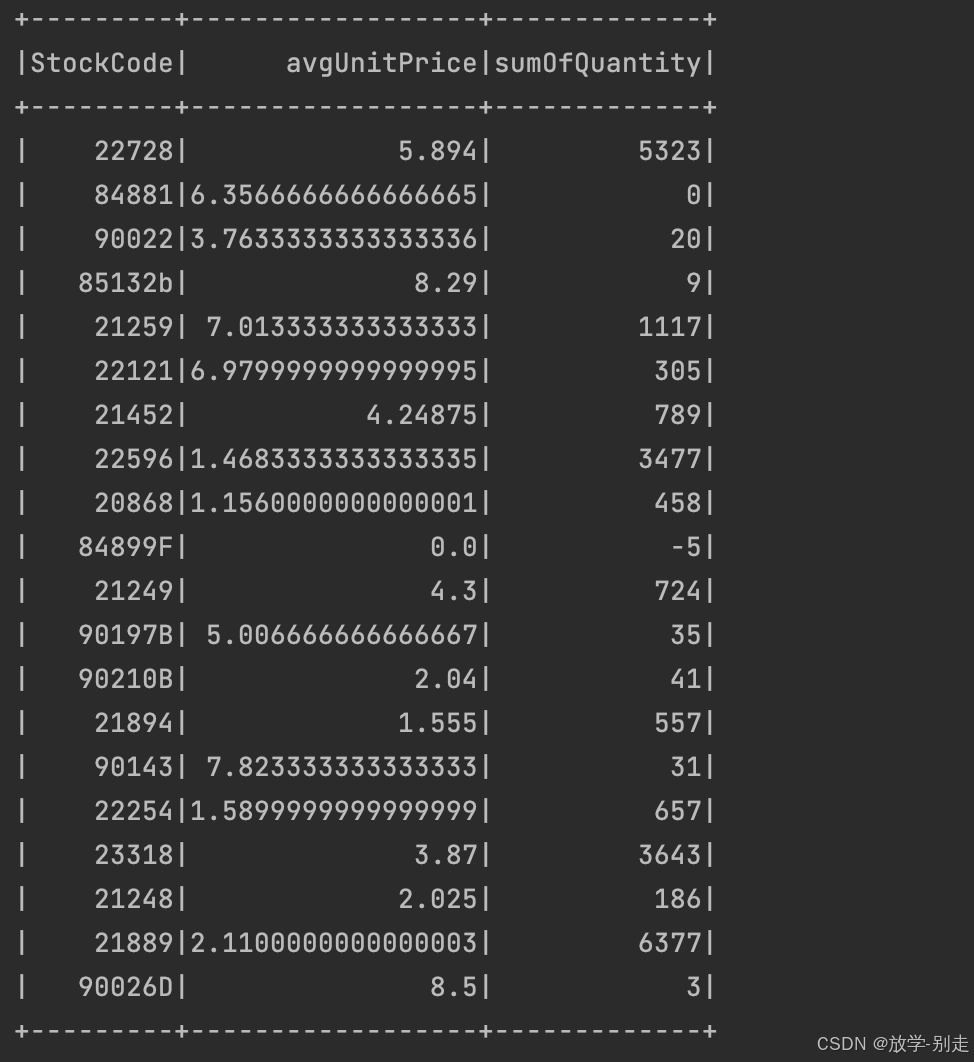
3. 数据结果保存
所有分析结果都以 JSON 格式保存到 static/ 目录。我们定义了一个简单的 save() 函数来处理文件写入:
python
def save(path, data):
    with open(path, 'w') as f:
        f.write(data)
4. 使用 Bottle 框架搭建 Web 服务器
为了展示这些分析结果,我们使用了 Bottle 框架,提供静态文件服务。Web 服务器代码如下:
python
from bottle import route, run, static_file

@route('/static/<filename>')
def server_static(filename):
    return static_file(filename, root="./static")

@route("/<name:re:.*\.html>")
def server_page(name):
    return static_file(name, root=".")

@route("/")
def index():
    return static_file("index.html", root=".")
通过访问 /static/filename 可以获取生成的 JSON 文件,访问 / 可以加载主页 index.html。
5. 运行项目
运行项目非常简单,只需启动 Python 脚本,它将自动生成分析结果,并启动 Bottle Web 服务器。
python
python app.py在浏览器中访问 http://localhost:9999 即可查看分析结果。


总结
通过 PySpark 处理海量电商数据,并将结果可视化,是数据分析和数据工程领域的典型场景。本项目展示了如何通过 Spark 进行数据的处理和分析,结合 Bottle 框架实现简单的 Web 服务,将结果供用户查看。
如有遇到问题可以找小编沟通交流哦。另外小编帮忙辅导大课作业,学生毕设等。不限于MapReduce, MySQL, python,java,大数据,模型训练等。 hadoop hdfs yarn spark Django flask flink kafka flume datax sqoop seatunnel echart可视化 机器学习等
