一 肘部法则
在K-means算法中,对于确定K(簇的数目),我们经常使用肘部法则。 肘部法则是一种用于确定在k均值聚类算法中使用的质心数(k)的技术。 在这种方法中,为了确定k值,我们连续迭代k=1到k=n(这里n是我们根据要求选择的超参数)。对于k的每个值,我们计算簇内平方和(WCSS)值。
WCSS -每个样本到簇内中心点的距离偏差之和。
现在,为了确定最佳的聚类数(k),我们绘制了k与它们的WCSS值的关系图。令人惊讶的是,该图看起来像一个肘部(我们将在后面看到)。此外,当k=1时,WCSS具有最高值,但随着k值的增加,WCSS值开始减小。我们从图开始看起来像直线的地方选择k值。
二 实战
下面我们将分4步实现肘部法则。首先,我们将创建随机数据集点,然后我们将在此数据集上应用k均值,并计算1到4之间的k的wcss值。
-
导入所需库
pythonfrom sklearn.cluster import KMeans from sklearn import metrics from scipy.spatial.distance import cdist import numpy as np import matplotlib.pyplot as plt -
创建和可视化数据
我们将创建一个随机数组并将其分布可视化
python# Creating the data x1 = np.array([3, 1, 1, 2, 1, 6, 6, 6, 5, 6,\ 7, 8, 9, 8, 9, 9, 8, 4, 4, 5, 4]) x2 = np.array([5, 4, 5, 6, 5, 8, 6, 7, 6, 7, \ 1, 2, 1, 2, 3, 2, 3, 9, 10, 9, 10]) X = np.array(list(zip(x1, x2))).reshape(len(x1), 2) # Visualizing the data plt.plot() plt.xlim([0, 10]) plt.ylim([0, 10]) plt.title('Dataset') plt.scatter(x1, x2) plt.show()
从上面的可视化中,我们可以看到集群的最佳数量应该在3左右。但是,仅仅可视化数据并不能总是给予正确的答案。
定义一个
Distortion = 1/n * Σ(distance(point, centroid)^2), 通常,使用欧几里得距离度量。Inertia = Σ(distance(point, centroid)^2)是样本到其最近聚类中心的平方距离之和。我们将k的值从1迭代到n,并计算每个k值的Distortion,给定范围内每个k值的Inertia。
-
构建聚类模型并计算Distortion和Inertia的值
pythondistortions = [] inertias = [] mapping1 = {} mapping2 = {} K = range(1, 10) for k in K: # Building and fitting the model kmeanModel = KMeans(n_clusters=k).fit(X) kmeanModel.fit(X) distortions.append(sum(np.min(cdist(X, kmeanModel.cluster_centers_, 'euclidean'), axis=1)) / X.shape[0]) inertias.append(kmeanModel.inertia_) mapping1[k] = sum(np.min(cdist(X, kmeanModel.cluster_centers_, 'euclidean'), axis=1)) / X.shape[0] mapping2[k] = kmeanModel.inertia_ -
列表和可视化结果
(1)使用不同的Distortion值:
pythonfor key, val in mapping1.items(): print(f'{key} : {val}')输出:
bash1 : 3.625551331197001 2 : 2.0318238533112596 3 : 1.2423303391744152 4 : 0.8367738708386461 5 : 0.736979754424859 6 : 0.6898254810112422 7 : 0.6020311621770951 8 : 0.5234596363982826 9 : 0.4587221418509788接下来我们将绘制k与WCSS的关系图:
pythonplt.plot(K, distortions, 'bx-') plt.xlabel('Values of K') plt.ylabel('Distortion') plt.title('The Elbow Method using Distortion') plt.show()
(2)使用不同的Inertia:
pythonfor key, val in mapping2.items(): print(f'{key} : {val}')输出:
bash1 : 312.95238095238096 2 : 108.07142857142856 3 : 39.51746031746031 4 : 17.978571428571428 5 : 14.445238095238096 6 : 11.416666666666668 7 : 9.266666666666667 8 : 7.25 9 : 6.5pythonplt.plot(K, inertias, 'bx-') plt.xlabel('Values of K') plt.ylabel('Inertia') plt.title('The Elbow Method using Inertia') plt.show()
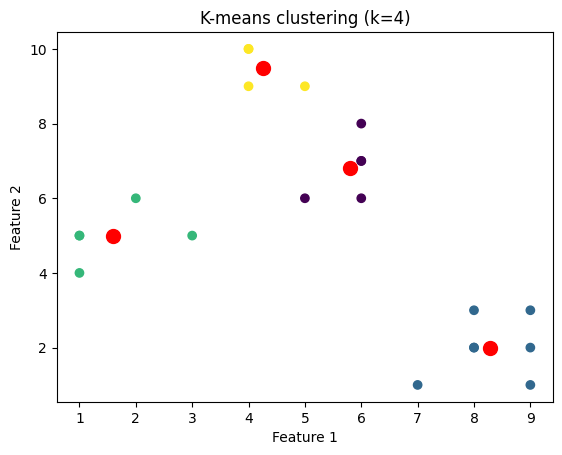
为了确定聚类的最佳数量,我们必须选择"弯头"处的k值,即distortion/inertia开始以线性方式减小的点。因此,对于给定的数据,我们得出结论,数据的最佳聚类数是4。
我们将绘制针对不同k值聚类的数据点的图像。为此,我们将通过迭代k值的范围来对数据集应用k-means算法。
python
import matplotlib.pyplot as plt

# Create a range of values for k
k_range = range(1, 5)

# Initialize an empty list to
# store the inertia values for each k
inertia_values = []

# Fit and plot the data for each k value
for k in k_range:
	kmeans = KMeans(n_clusters=k, \
					init='k-means++', random_state=42)
	y_kmeans = kmeans.fit_predict(X)
	inertia_values.append(kmeans.inertia_)
	plt.scatter(X[:, 0], X[:, 1], c=y_kmeans)
	plt.scatter(kmeans.cluster_centers_[:, 0],\
				kmeans.cluster_centers_[:, 1], \
				s=100, c='red')
	plt.title('K-means clustering (k={})'.format(k))
	plt.xlabel('Feature 1')
	plt.ylabel('Feature 2')
	plt.show()

# Plot the inertia values for each k
plt.plot(k_range, inertia_values, 'bo-')
plt.title('Elbow Method')
plt.xlabel('Number of clusters (k)')
plt.ylabel('Inertia')
plt.show()


