今天这篇推文,小编还是像往常一样交给大家绘图技巧,今天的主角就是-*树形矩阵图(Treemap)*。绘制树形图使用R或者Python都是可以绘制的,今天我们还是使用R进行绘制(Python绘制结果为交互式,后面统一介绍相应的库)。在R中有专门的包-treemapify包进行绘制。今天内容主要如下:
-
树形矩阵图(Treemap)简介
-
树形矩阵图(Treemap)R实例演示
-
更多详细的数据可视化教程,可订阅我们的店铺课程:
-

树形矩阵图(Treemap)简介
在数据可视化分析中,在面对大量分层结构(树状结构) 的数据时,要想准确的使用图表去展示时,树形图(Treemap)就排上用场了。在树形图中,图表被分为若干个大小的矩形,矩形的大小和顺序取决于数据变量,而变量间则使用不同颜色表示。
绘制树形图的所需数据特点如下:
-
数据呈部分到整体的关系;
-
数据使分层结构的。
树形矩阵图(Treemap)R实例演示
R-treemapify包可以很好的绘制树形矩阵图(Treemap),其官网为:*https://wilkox.org/treemapify/index.html*,其主要提供
-
geom_treemap()
-
geom_treemap_text()
-
geom_treemap_subgroup_border()
-
geom_treemap_subgroup_text()
等绘图函数进行树形矩阵图的元素的添加,由于是ggplot2的拓展包,较容易理解,小伙伴们可直接参看官网接好和例子即可。下面我们通过一个实例演示R-treemapify包是如何绘制树形矩阵图的。
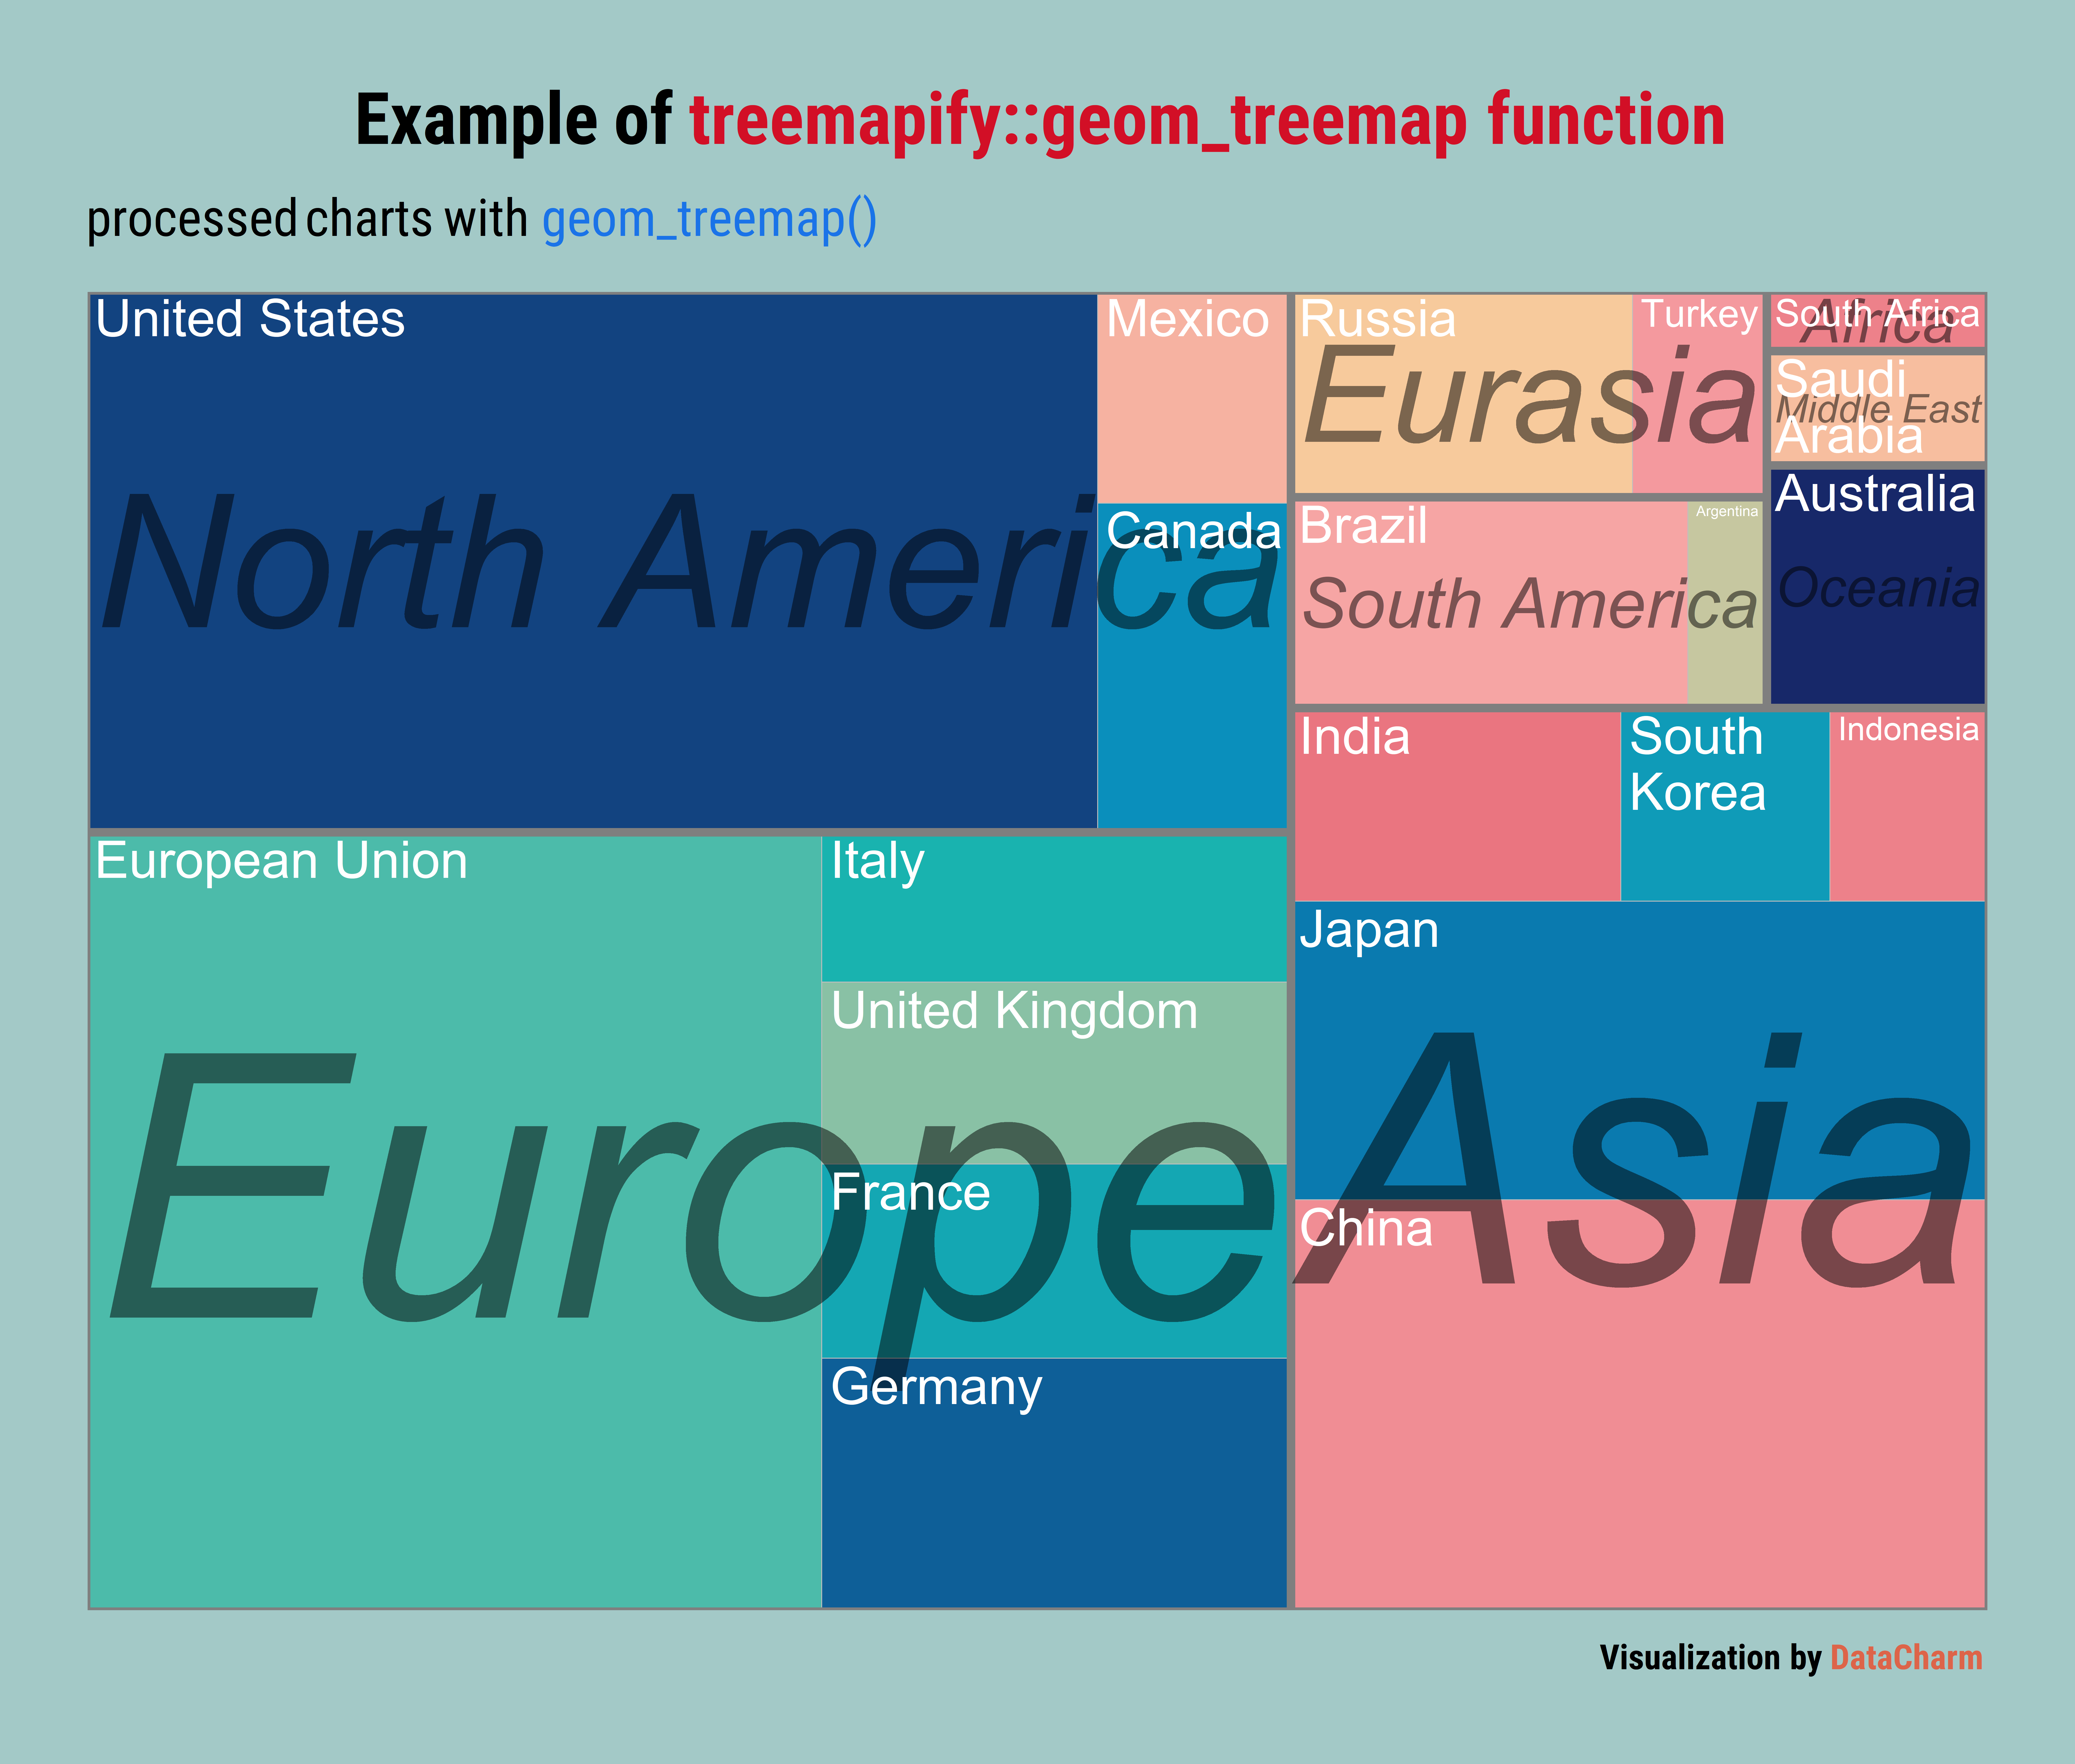
官网样例美化:
ggplot(G20, aes(area = gdp_mil_usd, fill = as.factor(hdi), label = country,
                subgroup = region)) +
  geom_treemap() +
  geom_treemap_subgroup_border() +
  geom_treemap_subgroup_text(place = "centre", grow = T, alpha = 0.5, colour =
                             "black", fontface = "italic", min.size = 0) +
  geom_treemap_text(colour = "white", place = "topleft", reflow = T) +
  scale_fill_manual(values = lacroix_palette("Pamplemousse", n = 19, type = "continuous"),name="")+
    labs(
    title = "Example of <span style='color:#D20F26'>treemapify::geom_treemap function</span>",
    subtitle = "processed charts with <span style='color:#1A73E8'>geom_treemap()</span>",
    caption = "Visualization by <span style='color:#DD6449'>DataCharm</span>") +
    hrbrthemes::theme_ipsum(base_family = "Roboto Condensed") +
    theme(
        plot.title = element_markdown(hjust = 0.5,vjust = .5,color = "black",
                                      size = 25, margin = margin(t = 1, b = 12)),
        plot.subtitle = element_markdown(hjust = 0,vjust = .5,size=18),
        plot.caption = element_markdown(face = 'bold',size = 12),

        panel.background = element_rect(fill="#a3c9c7"),
        panel.border = element_rect(fill = NA,colour = "#a3c9c7"),
        plot.background = element_rect(fill="#a3c9c7",colour = "#a3c9c7"),
        # 修改图例参数
        legend.position = 'none',
        legend.direction = "horizontal",
        legend.spacing.x = unit(.3,"cm"),
        legend.key.height = unit(1, 'lines'),
        legend.key.width = unit(1.4, 'lines'),
        legend.text = element_text(size = 15,margin = margin(r = .5, unit = 'cm'))
  ) +
  guides(fill=guide_legend(nrow=3,byrow=TRUE,reverse = TRUE,title=NULL))
可视化结果如下:

Example01 of treemapify
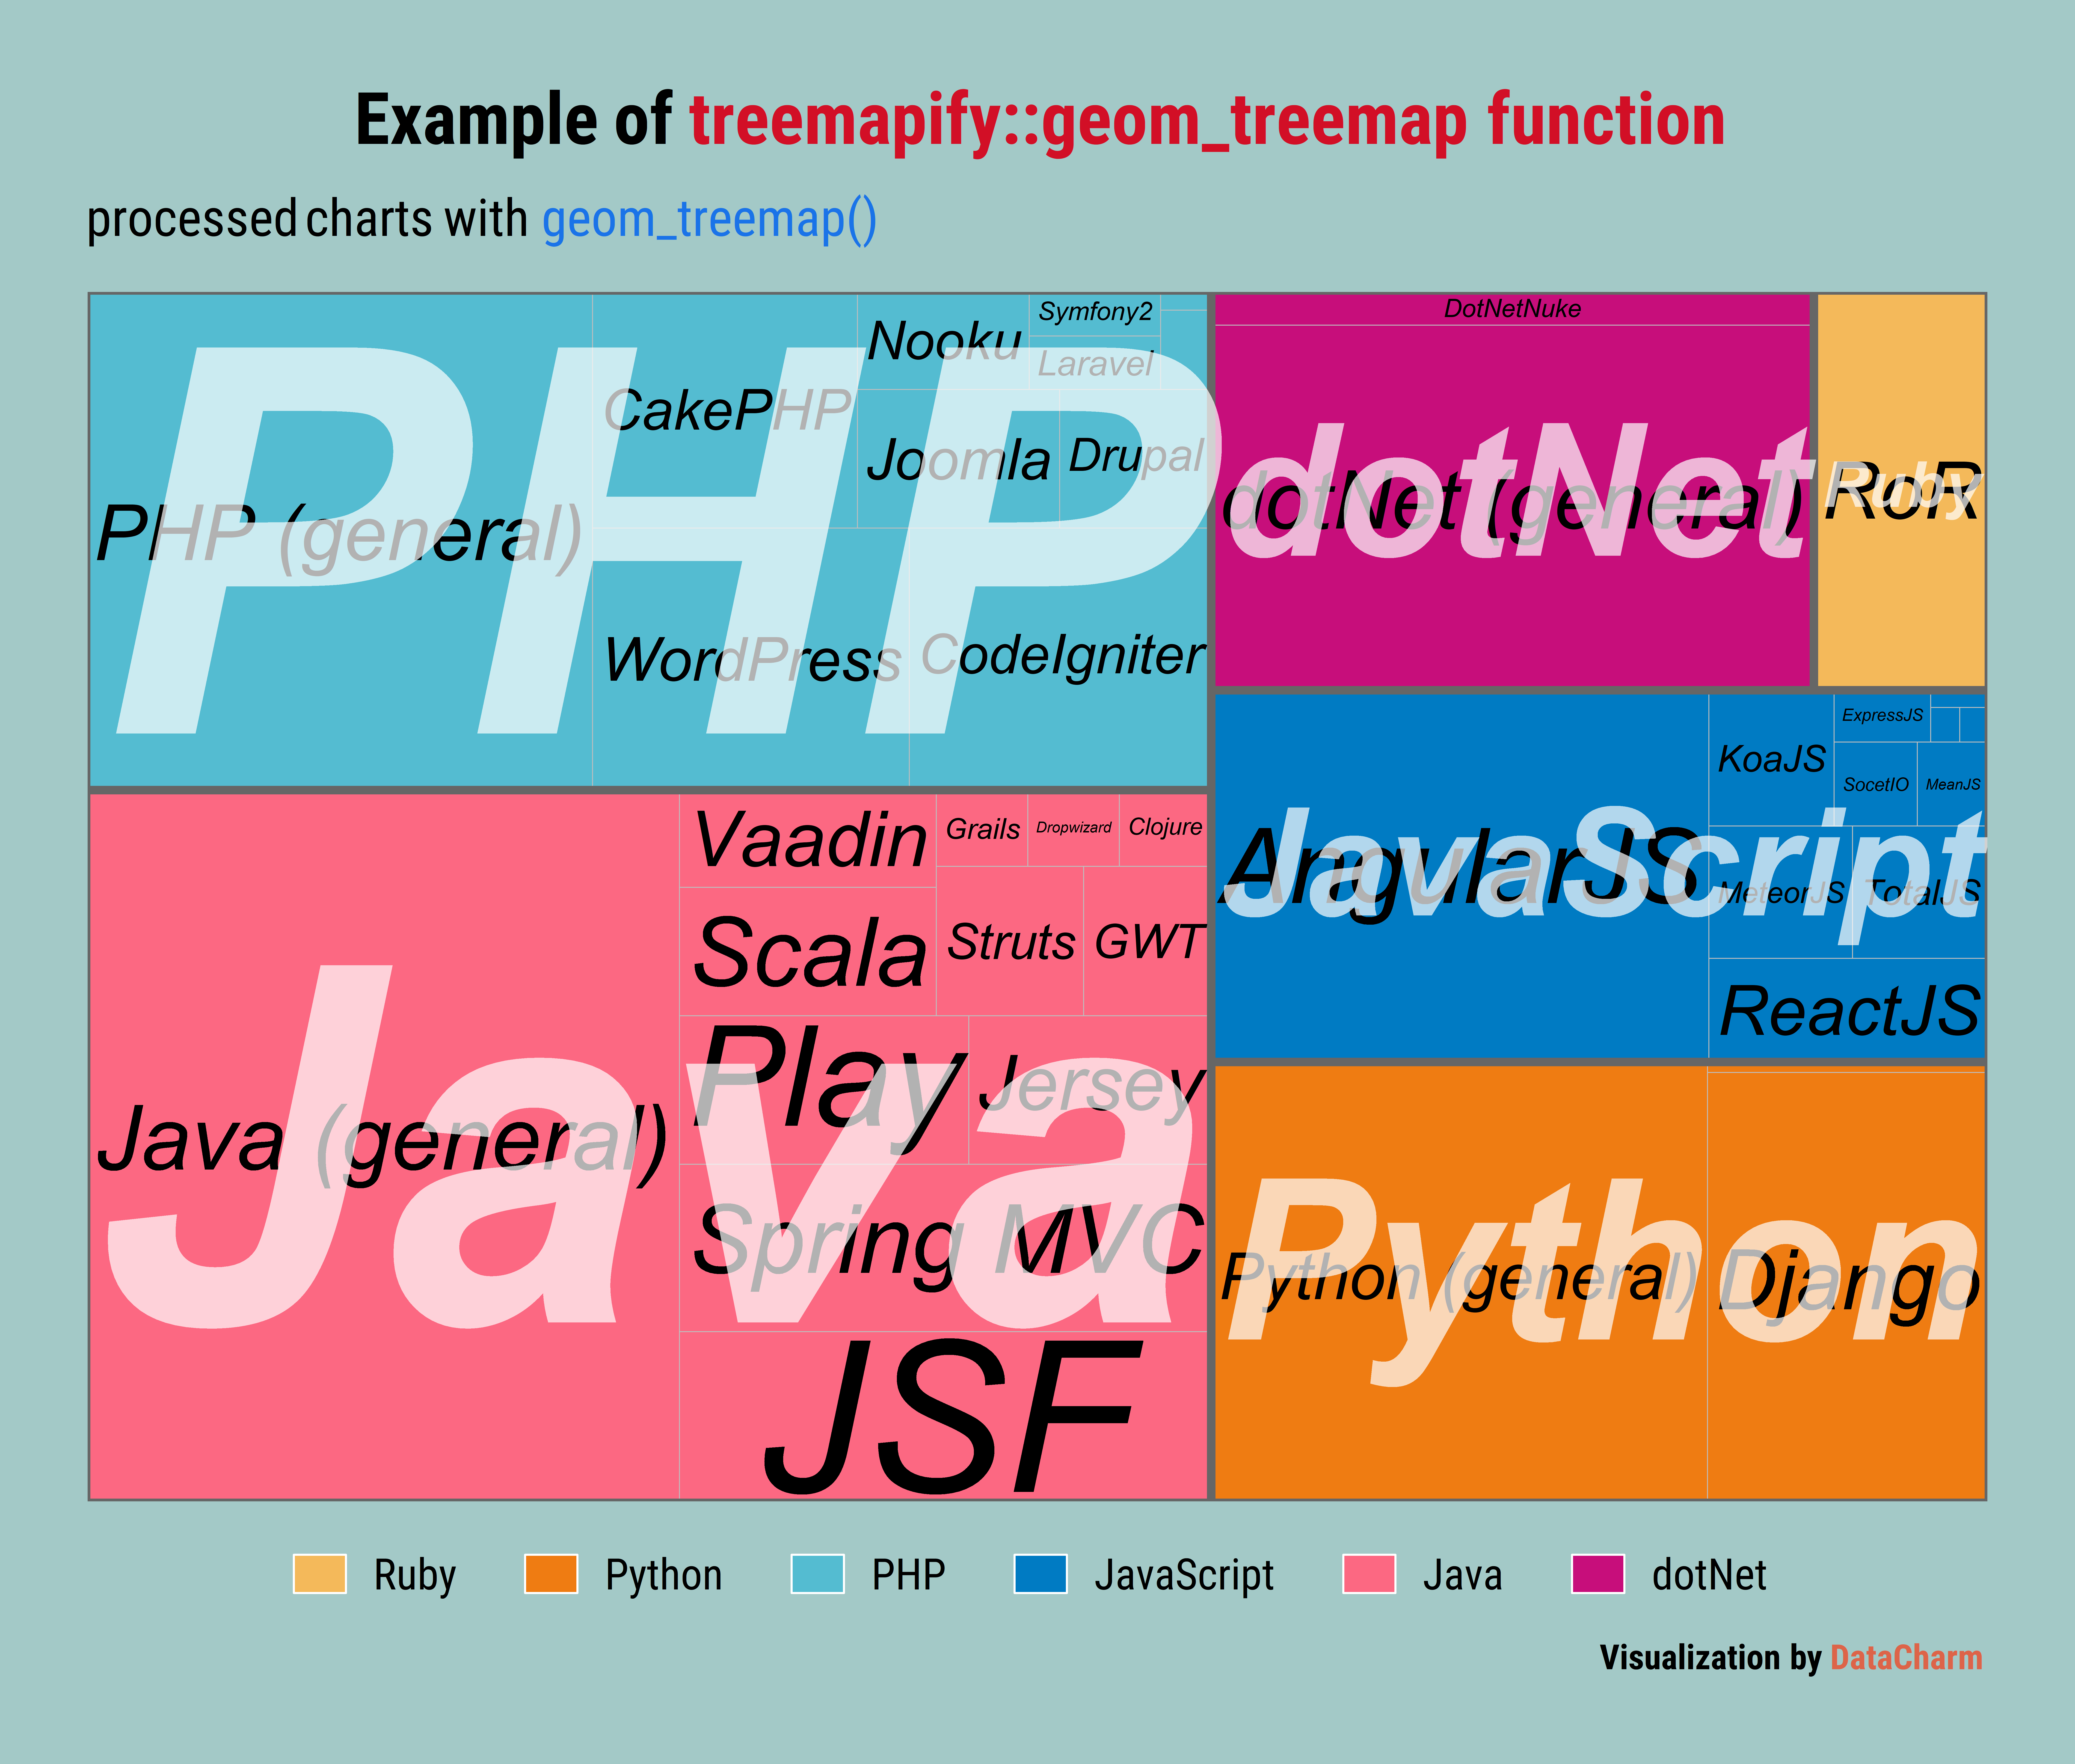
实例演示:
library(tidyverse)
library(ggtext)
library(hrbrthemes)
library(LaCroixColoR)
library(treemapify)

proglangs <- readr::read_csv("proglanguages.csv")
ggplot(proglangs, aes(area=value, fill=parent, subgroup=parent)) +
    geom_treemap() +
    geom_treemap_subgroup_border(color="gray40") +
    geom_treemap_text(aes(label=id),fontface = "italic", colour = "black", place = "centre",
                      grow = TRUE) +
     geom_treemap_subgroup_text(color="white",fontface="bold.italic",place = "centre",
                                min.size = 0,alpha=.7,grow = TRUE)+

    scale_fill_manual(values = lacroix_palette(type = "paired"),name="")+

    labs(
    title = "Example of <span style='color:#D20F26'>treemapify::geom_treemap function</span>",
    subtitle = "processed charts with <span style='color:#1A73E8'>geom_treemap()</span>",
    caption = "Visualization by <span style='color:#DD6449'>DataCharm</span>") +
    hrbrthemes::theme_ipsum(base_family = "Roboto Condensed") +
    theme(
        plot.title = element_markdown(hjust = 0.5,vjust = .5,color = "black",
                                      size = 25, margin = margin(t = 1, b = 12)),
        plot.subtitle = element_markdown(hjust = 0,vjust = .5,size=18),
        plot.caption = element_markdown(face = 'bold',size = 12),

        panel.background = element_rect(fill="#a3c9c7"),
        panel.border = element_rect(fill = NA,colour = "#a3c9c7"),
        plot.background = element_rect(fill="#a3c9c7",colour = "#a3c9c7"),
        # 修改图例参数
        legend.position = 'bottom',
        legend.direction = "horizontal",
        #legend.spacing.y = unit(.5,"cm"),
        legend.spacing.x = unit(.3,"cm"),
        #legend.key.size = unit(1, 'lines'),
        legend.key.height = unit(1, 'lines'),
        legend.key.width = unit(1.4, 'lines'),
        legend.text = element_text(size = 15,margin = margin(r = .5, unit = 'cm'))
  ) +
  guides(fill=guide_legend(nrow=1,byrow=TRUE,reverse = TRUE,title=NULL))
可视化结果如下:

example of treemapify test
好了,今天的可视化教程比较简单,大家可下载数据进行练习哈,或者直接使用官网提供的数据进行练习哈~~
总结
今天的推文小编给大家介绍了一个快速绘制树形矩阵图的方法,具体的绘图函数也是很好理解的,这里就不再赘述,希望小伙伴们可以多练习哈~~