Python Numpy 实现神经网络自动训练:反向传播与激活函数的应用详解
这篇文章介绍了如何使用 Python 的 Numpy 库来实现神经网络的自动训练,重点展示了反向传播算法和激活函数的应用。反向传播是神经网络训练的核心,能够通过计算梯度来优化模型参数,使得预测更加精准。文中详细演示了如何使用 Numpy 进行神经网络的前向预测、反向传播更新、误差计算,并通过引入 ReLU 等激活函数提升模型的非线性拟合能力。最后,通过对比训练前后的结果,展示了加入激活函数后模型性能的显著提升,适合初学者和爱好者学习神经网络的基础原理与应用。
文章目录
- [Python Numpy 实现神经网络自动训练:反向传播与激活函数的应用详解](#Python Numpy 实现神经网络自动训练:反向传播与激活函数的应用详解)
-
-
- [一 简单介绍反向传播](#一 简单介绍反向传播)
- [二 用 Numpy 来做神经网络](#二 用 Numpy 来做神经网络)
- [三 加入激活函数](#三 加入激活函数)
- [四 完整代码示例](#四 完整代码示例)
- [五 源码地址](#五 源码地址)
-
一 简单介绍反向传播
反向传播(Backpropagation)是训练神经网络的核心算法,用于通过计算损失函数相对于网络各个参数的梯度,逐步优化这些参数,从而使模型的预测结果更加准确。使用梯度反向更新 规则做神经网络参数优化调整。
这段代码计算每一层神经层的更新幅度,让神经网络对数据拟合变好,不理解先当工具方法记住。
python
def backprop(dz, layer, layer_in, learning_rate=0.01):
    """
    进行反向传播,更新当前层的权重和偏置,并计算传递给前一层的梯度。

    参数:
    dz: 当前层输出的梯度(损失函数对激活输出的偏导数)
    layer: 当前层的参数字典,包含权重 "w" 和偏置 "b"
    layer_in: 输入到当前层的激活值
    learning_rate: 学习率,用于控制参数更新的步长,默认值为 0.01

    返回:
    new_dz: 传递给前一层的梯度
    """

    # 计算损失函数对权重的梯度,layer_in.T 是当前层输入的转置,dot(dz) 进行矩阵乘法
    gw = layer_in.T.dot(dz)

    # 计算损失函数对偏置的梯度,按列求和,保留维度,求得每个偏置的梯度
    gb = np.sum(dz, axis=0, keepdims=True)

    # 计算传递给前一层的梯度,使用当前层的权重转置与 dz 相乘
    new_dz = dz.dot(layer["w"].T)

    # 更新当前层的权重:使用学习率乘以权重梯度,然后加到原有的权重上(梯度上升)
    layer["w"] += learning_rate * gw

    # 更新当前层的偏置:同样使用学习率乘以偏置梯度,然后加到原有的偏置上
    layer["b"] += learning_rate * gb

    # 返回传递给前一层的梯度,以便继续进行反向传播
    return new_dz
二 用 Numpy 来做神经网络
没有训练
python
def predict(x, l1, l2):
    o1 = x.dot(l1["w"]) + l1["b"]
    o2 = o1.dot(l2["w"]) + l2["b"]
    return [o1, o2]


def predict01():
    # 数据
    x = np.linspace(-1, 1, 10)[:, None]  # shape [10, 1]
    y = np.random.normal(loc=0, scale=0.2, size=[10, 1]) + x  # shape [10, 1]

    # 搭建模型
    l1 = layer(1, 3)
    l2 = layer(3, 1)

    draw_line(x, predict(x, l1, l2)[-1])
    draw_scatter(x, y)
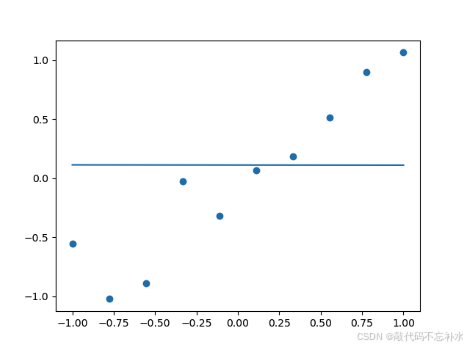
运行结果

可以看出在没有训练的时候,模型预测的结果与实际 y 值在数量级上存在较大差异。
开始训练
python
def predict02():
    # 数据
    x = np.linspace(-1, 1, 10)[:, None]  # shape [10, 1]
    y = np.random.normal(loc=0, scale=0.2, size=[10, 1]) + x  # shape [10, 1]
    l1 = layer(1, 3)
    l2 = layer(3, 1)

    # 训练 50 次
    learning_rate = 0.01
    for i in range(50):
        # 前向预测
        o1, o2 = predict(x, l1, l2)

        # 误差计算
        if i % 10 == 0:
            average_cost = np.mean(np.square(o2 - y))
            print(average_cost)

        # 反向传播,梯度更新
        dz2 = -2 * (o2 - y)  # 输出误差 (o2 - y)**2 的导数
        dz1 = backprop(dz2, l2, o1)
        _ = backprop(dz1, l1, x)

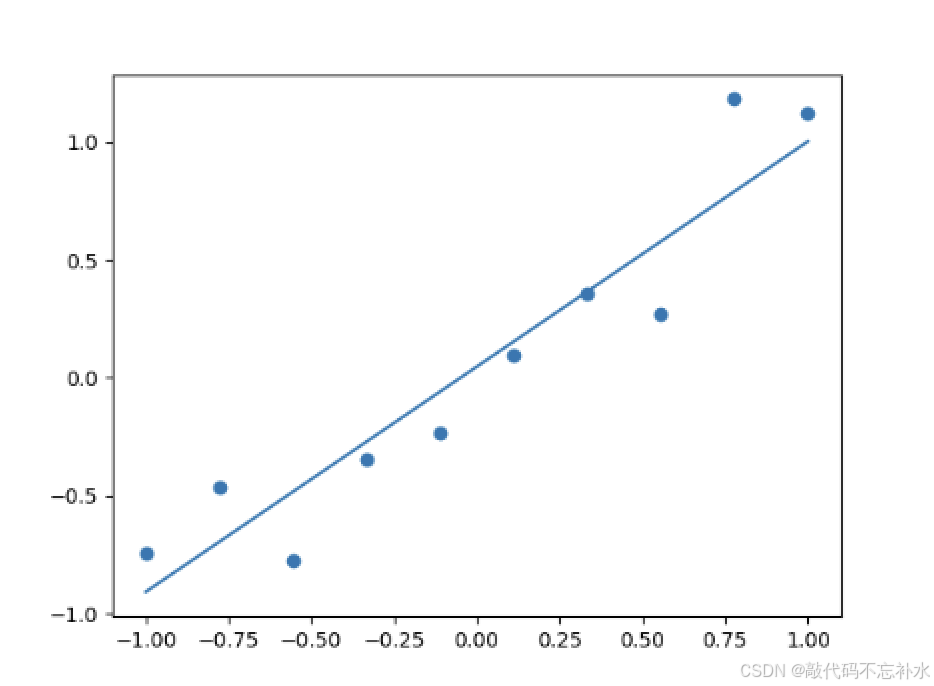
    # 画一个训练后的图,对比上文中有数值问题的线
    draw_line(x, predict(x, l1, l2)[-1])
    draw_scatter(x, y)
运行结果

三 加入激活函数
常用激活函数
python
# 激活函数
def relu(x):
    return np.maximum(0, x)


def relu_derivative(x):  # 导数
    return np.where(x > 0, np.ones_like(x), np.zeros_like(x))


def tanh(x):
    return np.tanh(x)


def tanh_derivative(x):  # 导数
    return 1 - np.square(np.tanh(x))


def sigmoid(x):
    return 1 / (1 + np.exp(-x))


def sigmoid_derivative(x):  # 导数
    o = sigmoid(x)
    return o * (1 - o)
非线性计算,不加激活函数
python
def predict03():
    # 非线性计算
    x = np.linspace(-1, 1, 30)[:, None]  # shape [30, 1]
    y = np.random.normal(loc=0, scale=0.2, size=[30, 1]) + x ** 2  # shape [30, 1]

    # draw_scatter(x, y)
    # 搭建模型
    l1 = layer(1, 10)
    l2 = layer(10, 1)

    # 训练 300 次
    learning_rate = 0.01
    for i in range(300):
        # 前向预测
        o1, o2 = predict(x, l1, l2)

        # 误差计算
        if i % 10 == 0:
            average_cost = np.mean(np.square(o2 - y))
            print(average_cost)

        # 反向传播,梯度更新
        dz2 = -2 * (o2 - y)  # 输出误差 (o2 - y)**2 的导数
        dz1 = backprop(dz2, l2, o1)
        _ = backprop(dz1, l1, x)

    draw_line(x, predict(x, l1, l2)[-1])
    draw_scatter(x, y)
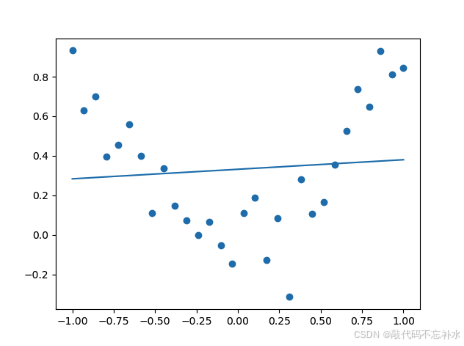
运行结果

模型训练结果在量级上出现较大差距,欠拟合。
非线性计算,加入激活函数
python
def predict04():
    # 非线性计算
    x = np.linspace(-1, 1, 30)[:, None]  # shape [30, 1]
    y = np.random.normal(loc=0, scale=0.2, size=[30, 1]) + x ** 2  # shape [30, 1]
    # 搭建模型
    l1 = layer(1, 10)
    l2 = layer(10, 1)
    # 训练 300 次
    learning_rate = 0.01
    for i in range(300):
        # 前向预测
        o1, a1, o2 = predictjihuo(x, l1, l2)

        # 误差计算
        if i % 10 == 0:
            average_cost = np.mean(np.square(o2 - y))
            print(average_cost)

        # 反向传播,梯度更新
        dz2 = -2 * (o2 - y)  # 输出误差 (o2 - y)**2 的导数
        dz1 = backprop(dz2, l2, a1)
        dz1 *= relu_derivative(o1)  # 这里要添加对应激活函数的反向传播
        _ = backprop(dz1, l1, x)

    draw_line(x, predictjihuo(x, l1, l2)[-1])
    draw_scatter(x, y)
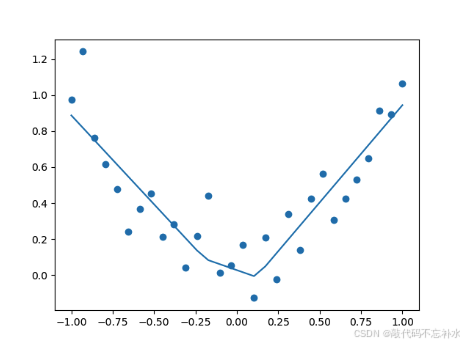
运行结果

模型成功拟合了这些异常数据点,说明非线性激活函数确实非常有效。
四 完整代码示例
python
# This is a sample Python script.
from matplotlib import pyplot as plt
import numpy as np


# Press ⌃R to execute it or replace it with your code.
# Press Double ⇧ to search everywhere for classes, files, tool windows, actions, and settings.
def draw_scatter(x, y):
    # 使用 matplotlib 的 scatter 方法来绘制散点图
    # x.ravel() 和 y.ravel() 将 x 和 y 的二维数组转换为一维数组,适合作为散点图的输入
    plt.scatter(x.ravel(), y.ravel())
    # 显示图表
    plt.show()


def draw_line(x, y):
    idx = np.argsort(x.ravel())
    plt.plot(x.ravel()[idx], y.ravel()[idx])
    # plt.show()


def layer(in_dim, out_dim):
    weights = np.random.normal(loc=0, scale=0.1, size=[in_dim, out_dim])
    bias = np.full([1, out_dim], 0.1)
    return {"w": weights, "b": bias}


# 激活函数
def relu(x):
    return np.maximum(0, x)


def relu_derivative(x):  # 导数
    return np.where(x > 0, np.ones_like(x), np.zeros_like(x))


def tanh(x):
    return np.tanh(x)


def tanh_derivative(x):  # 导数
    return 1 - np.square(np.tanh(x))


def sigmoid(x):
    return 1 / (1 + np.exp(-x))


def sigmoid_derivative(x):  # 导数
    o = sigmoid(x)
    return o * (1 - o)


def backprop(dz, layer, layer_in, learning_rate=0.01):
    """
    进行反向传播,更新当前层的权重和偏置,并计算传递给前一层的梯度。

    参数:
    dz: 当前层输出的梯度(损失函数对激活输出的偏导数)
    layer: 当前层的参数字典,包含权重 "w" 和偏置 "b"
    layer_in: 输入到当前层的激活值
    learning_rate: 学习率,用于控制参数更新的步长,默认值为 0.01

    返回:
    new_dz: 传递给前一层的梯度
    """

    # 计算损失函数对权重的梯度,layer_in.T 是当前层输入的转置,dot(dz) 进行矩阵乘法
    gw = layer_in.T.dot(dz)

    # 计算损失函数对偏置的梯度,按列求和,保留维度,求得每个偏置的梯度
    gb = np.sum(dz, axis=0, keepdims=True)

    # 计算传递给前一层的梯度,使用当前层的权重转置与 dz 相乘
    new_dz = dz.dot(layer["w"].T)

    # 更新当前层的权重:使用学习率乘以权重梯度,然后加到原有的权重上(梯度上升)
    layer["w"] += learning_rate * gw

    # 更新当前层的偏置:同样使用学习率乘以偏置梯度,然后加到原有的偏置上
    layer["b"] += learning_rate * gb

    # 返回传递给前一层的梯度,以便继续进行反向传播
    return new_dz


def predictjihuo(x, l1, l2):
    o1 = x.dot(l1["w"]) + l1["b"]
    a1 = relu(o1)  # 这里我添加了一个激活函数
    o2 = a1.dot(l2["w"]) + l2["b"]
    return [o1, a1, o2]


def predict(x, l1, l2):
    """
    预测函数,执行前向传播,计算两层神经网络的输出。

    参数:
    x: 输入数据,形状为 [N, 输入特征数],此处为 [10, 1]。
    l1: 第一层的参数字典,包含权重 "w" 和偏置 "b"。
    l2: 第二层的参数字典,包含权重 "w" 和偏置 "b"。

    返回:
    o1: 第一层的输出结果。
    o2: 第二层的输出结果(最终输出)。
    """
    # 第一层的输出,x.dot(l1["w"]) 是线性组合,+ l1["b"] 加上偏置
    o1 = x.dot(l1["w"]) + l1["b"]

    # 第二层的输出,o1.dot(l2["w"]) 是线性组合,+ l2["b"] 加上偏置
    o2 = o1.dot(l2["w"]) + l2["b"]

    # 返回两层的输出,o1 为第一层的输出,o2 为最终的输出
    return [o1, o2]


def predict01():
    """
    模拟预测和数据绘制函数,包含数据生成、模型搭建、前向预测和绘图。
    """
    # 生成输入数据 x,使用 np.linspace 生成从 -1 到 1 的 10 个均匀分布的点,并reshape为 [10, 1]
    x = np.linspace(-1, 1, 10)[:, None]  # 形状 [10, 1]

    # 生成目标值 y,基于 x 加上高斯噪声,模拟真实数据,形状为 [10, 1]
    y = np.random.normal(loc=0, scale=0.2, size=[10, 1]) + x  # 形状 [10, 1]

    # 搭建神经网络模型
    # 第一层:输入维度为 1,输出维度为 3(即3个神经元)
    l1 = layer(1, 3)

    # 第二层:输入维度为 3,输出维度为 1
    l2 = layer(3, 1)

    # 使用 predict 函数进行前向传播,绘制预测结果
    # 只提取第二层的输出 o2 来绘制预测的线
    draw_line(x, predict(x, l1, l2)[-1])

    # 绘制真实数据点的散点图
    draw_scatter(x, y)


def predict02():
    # 数据
    x = np.linspace(-1, 1, 10)[:, None]  # shape [10, 1]
    y = np.random.normal(loc=0, scale=0.2, size=[10, 1]) + x  # shape [10, 1]
    l1 = layer(1, 3)
    l2 = layer(3, 1)

    # 训练 50 次
    learning_rate = 0.01
    for i in range(50):
        # 前向预测
        o1, o2 = predict(x, l1, l2)

        # 误差计算
        if i % 10 == 0:
            average_cost = np.mean(np.square(o2 - y))
            print(average_cost)

        # 反向传播,梯度更新
        dz2 = -2 * (o2 - y)  # 输出误差 (o2 - y)**2 的导数
        dz1 = backprop(dz2, l2, o1)
        _ = backprop(dz1, l1, x)

    # 画一个训练后的图,对比上文中有数值问题的线
    draw_line(x, predict(x, l1, l2)[-1])
    draw_scatter(x, y)


def predict03():
    # 非线性计算
    x = np.linspace(-1, 1, 30)[:, None]  # shape [30, 1]
    y = np.random.normal(loc=0, scale=0.2, size=[30, 1]) + x ** 2  # shape [30, 1]

    # draw_scatter(x, y)
    # 搭建模型
    l1 = layer(1, 10)
    l2 = layer(10, 1)

    # 训练 300 次
    learning_rate = 0.01
    for i in range(300):
        # 前向预测
        o1, o2 = predict(x, l1, l2)

        # 误差计算
        if i % 10 == 0:
            average_cost = np.mean(np.square(o2 - y))
            print(average_cost)

        # 反向传播,梯度更新
        dz2 = -2 * (o2 - y)  # 输出误差 (o2 - y)**2 的导数
        dz1 = backprop(dz2, l2, o1)
        _ = backprop(dz1, l1, x)

    draw_line(x, predict(x, l1, l2)[-1])
    draw_scatter(x, y)


def predict04():
    # 非线性计算
    x = np.linspace(-1, 1, 30)[:, None]  # shape [30, 1]
    y = np.random.normal(loc=0, scale=0.2, size=[30, 1]) + x ** 2  # shape [30, 1]
    # 搭建模型
    l1 = layer(1, 10)
    l2 = layer(10, 1)
    # 训练 300 次
    learning_rate = 0.01
    for i in range(300):
        # 前向预测
        o1, a1, o2 = predictjihuo(x, l1, l2)

        # 误差计算
        if i % 10 == 0:
            average_cost = np.mean(np.square(o2 - y))
            print(average_cost)

        # 反向传播,梯度更新
        dz2 = -2 * (o2 - y)  # 输出误差 (o2 - y)**2 的导数
        dz1 = backprop(dz2, l2, a1)
        dz1 *= relu_derivative(o1)  # 这里要添加对应激活函数的反向传播
        _ = backprop(dz1, l1, x)

    draw_line(x, predictjihuo(x, l1, l2)[-1])
    draw_scatter(x, y)


def print_hi(name):
    # Use a breakpoint in the code line below to debug your script.
    print(f'Hi, {name}')  # Press ⌘F8 to toggle the breakpoint.
    # 模型前向预测
    # 数据
    x = np.linspace(-1, 1, 10)[:, None]  # shape [10, 1]
    y = np.random.normal(loc=0, scale=0.2, size=[10, 1]) + x  # shape [10, 1]
    # draw_scatter(x, y)
    # 模型
    l1 = layer(1, 3)
    l2 = layer(3, 1)

    # 计算
    o = x.dot(l1["w"]) + l1["b"]
    print("第一层出来后的 shape:", o.shape)

    o = o.dot(l2["w"]) + l2["b"]
    print("第二层出来后的 shape:", o.shape)

    print("output:", o)
    # draw_scatter(x, o)
    # 简单介绍反向传播
    # predict01()
    # predict02()
    # 加入激活函数
    # 非线性计算,没有激活函数的网络训练,量级上的差距大
    # predict03()
    # 非线性计算,加入激活函数
    predict04()


# Press the green button in the gutter to run the script.
if __name__ == '__main__':
    print_hi('神经网络-自动训练')

# See PyCharm help at https://www.jetbrains.com/help/pycharm/
复制粘贴并覆盖到你的 main.py 中运行,运行结果如下。
lua
Hi, 神经网络-自动训练
第一层出来后的 shape: (10, 3)
第二层出来后的 shape: (10, 1)
output: [[0.08015376]
 [0.08221984]
 [0.08428592]
 [0.086352  ]
 [0.08841808]
 [0.09048416]
 [0.09255024]
 [0.09461632]
 [0.0966824 ]
 [0.09874848]]
0.2226335913018929
0.18084056623965614
0.17646520657891238
0.16955062165383475
0.15974897747454914
0.14609449775016456
0.12879398035319886
0.11000871768876343
0.09272999949822598
0.07986100731357502
0.07149628207512877
0.06657668787644673
0.06412748050655417
0.06308965708664192
0.06255298788129363
0.06233764319523034
0.06229224784095634
0.062220235356859256
0.06227320308423159
0.06227607241875045
0.06218961938206315
0.062183519685144004
0.06220136162617964
0.062260925337883535
0.06228186644083771
0.062212564435570314
0.06214763225225857
0.062190709318072676
0.06225667345334308
0.06227302776778138
五 源码地址
代码地址:
国内看 Gitee 之 numpy/神经网络-自动训练.py
国外看 GitHub 之 numpy/神经网络-自动训练.py
引用 莫烦 Python