Pandas 数据可视化指南:从散点图到面积图的全面展示
本文介绍了使用 Pandas 进行数据可视化的多种方法,包括散点图、折线图、条形图、直方图、饼图和面积图等,涵盖了常见的图表类型及其实现方式。通过提供详细的代码示例,展示了如何使用 Pandas 和 Matplotlib 快速创建不同类型的图表,帮助读者轻松掌握数据可视化技术。这篇指南既适合初学者,也为有经验的开发者提供了一些实用技巧,帮助在数据分析中更直观地展示结果。
文章目录
- [Pandas 数据可视化指南:从散点图到面积图的全面展示](#Pandas 数据可视化指南:从散点图到面积图的全面展示)
导入库
在开始绘制图表之前,我们首先导入必要的库
python
import numpy as np
import pandas as pd
import matplotlib.pyplot as plt
一 散点图(Scatter)
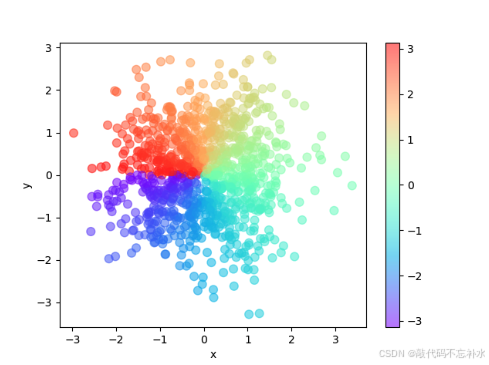
python
n = 1024  # 数据量
# 创建数据框
df = pd.DataFrame({
  "x": np.random.normal(0, 1, n),
  "y": np.random.normal(0, 1, n),
})
# 使用 arctan2 函数计算颜色
color = np.arctan2(df["y"], df["x"])
# 绘制散点图
df.plot.scatter(x="x", y="y", c=color, s=60, alpha=0.5, cmap="rainbow")
二 折线图(Plot)
简单折线图
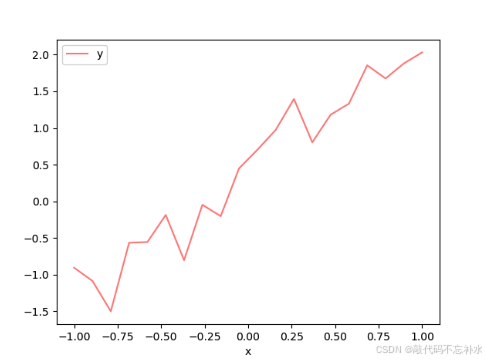
python
n = 20  # 数据量
x = np.linspace(-1, 1, n)
y = x * 2 + 0.4 + np.random.normal(0, 0.3, n)
# 创建数据框
df = pd.DataFrame({
    "x": x,
    "y": y,
})
# 绘制折线图
df.plot(x="x", y="y", alpha=0.5, c="r")
多折线图
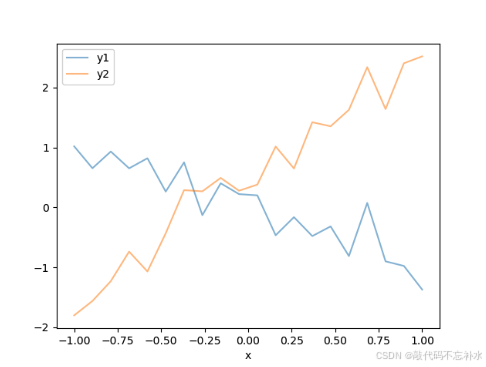
python
n = 20  # 数据量
x = np.linspace(-1, 1, n)
y1 = x * -1 - 0.1 + np.random.normal(0, 0.3, n)
y2 = x * 2 + 0.4 + np.random.normal(0, 0.3, n)
# 创建数据框
df = pd.DataFrame({
    "x": x,
    "y1": y1,
    "y2": y2,
})
# 绘制多折线图
df.plot(x="x", y=["y1", "y2"], alpha=0.5)
三 条形图(Bar)
垂直条形图
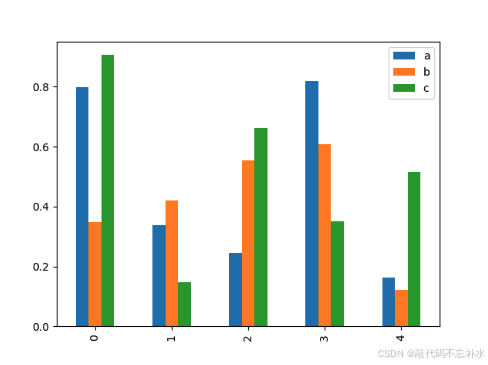
python
   	df = pd.DataFrame(np.random.rand(5, 3), columns=["a", "b", "c"])
    df.plot.bar()
堆叠条形图
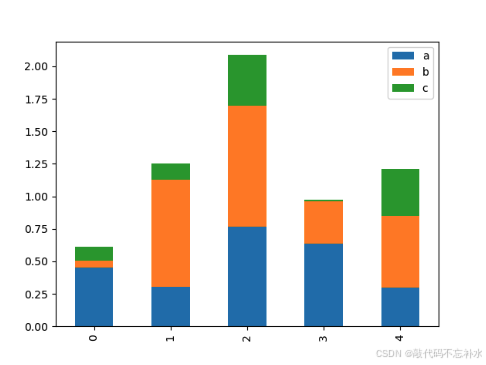
python
   	df = pd.DataFrame(np.random.rand(5, 3), columns=["a", "b", "c"])
    df.plot.bar(stacked=True)
水平条形图
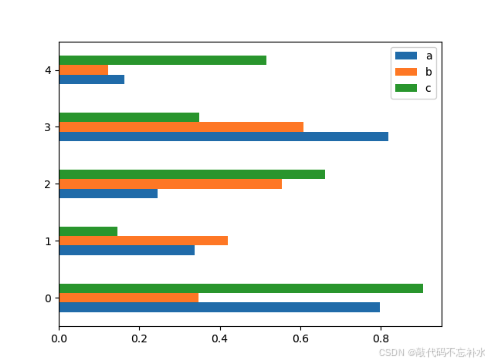
python
   	df = pd.DataFrame(np.random.rand(5, 3), columns=["a", "b", "c"])
    df.plot.barh()
四 直方图(Hist)
简单直方图
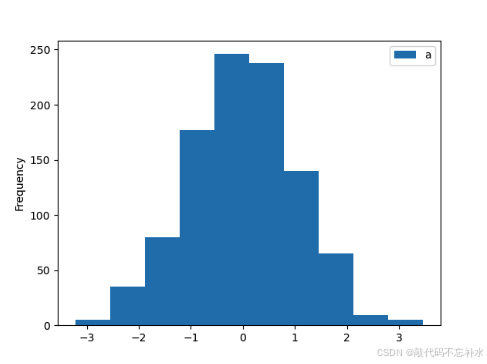
python
df = pd.DataFrame({"a": np.random.randn(1000)})
df.plot.hist()
重叠直方图
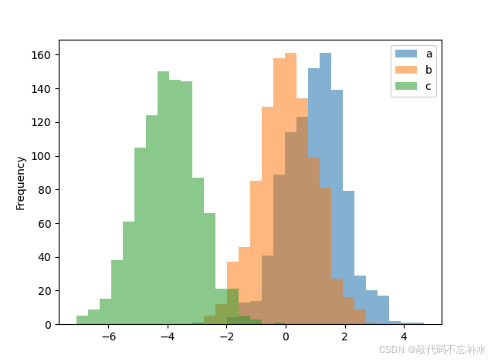
python
df = pd.DataFrame(
    {
        "a": np.random.randn(1000) + 1,
        "b": np.random.randn(1000),
        "c": np.random.randn(1000) - 4,
    }
)

df.plot.hist(alpha=0.5, bins=30)
五 饼图(Pie)
简单饼图

python
    df = pd.DataFrame(
        {"boss": np.random.rand(4)},
        index=["meeting", "supervise", "teaching", "team building"],
    )
    df.plot.pie(y="boss", figsize=(7, 7))
多个饼图

python
df = pd.DataFrame(
    {
        "bigBoss": np.random.rand(4),
        "smallBoss": np.random.rand(4),
    },
    index=["meeting", "supervise", "teaching", "team building"],
)
df.plot.pie(subplots=True, figsize=(9, 9), legend=False)
六 面积图(Area)
堆叠面积图
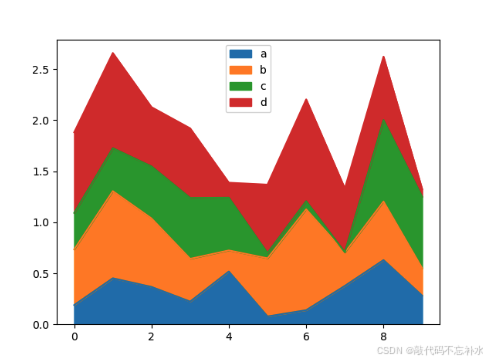
python
#
df = pd.DataFrame(
    np.random.rand(10, 4),
    columns=["a", "b", "c", "d"]
)
df.plot.area()
同起点面积图
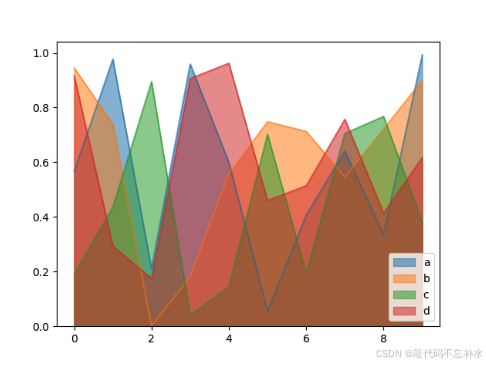
python
#
df = pd.DataFrame(
    np.random.rand(10, 4),
    columns=["a", "b", "c", "d"]
)
df.plot.area(stacked=False)详情见官方文档:Pandas 可视化图表
七 完整代码示例
python
# This is a sample Python script.

# Press ⌃R to execute it or replace it with your code.
# Press Double ⇧ to search everywhere for classes, files, tool windows, actions, and settings.
import numpy as np
import pandas as pd
import matplotlib.pyplot as plt


def print_hi(name):
    # Use a breakpoint in the code line below to debug your script.
    print(f'Hi, {name}')  # Press ⌘F8 to toggle the breakpoint.
    # 散点图Scatter
    n = 1024  # data size
    df = pd.DataFrame({
        "x": np.random.normal(0, 1, n),
        "y": np.random.normal(0, 1, n),
    })
    color = np.arctan2(df["y"], df["x"])
    df.plot.scatter(x="x", y="y", c=color, s=60, alpha=.5, cmap="rainbow")

    # 折线图Plot
    n = 20  # data size
    x = np.linspace(-1, 1, n)
    y = x * 2 + 0.4 + np.random.normal(0, 0.3, n)
    df = pd.DataFrame({
        "x": x,
        "y": y,
    })
    df.plot(x="x", y="y", alpha=.5, c="r")

    n = 20  # data size
    x = np.linspace(-1, 1, n)
    y1 = x * -1 - 0.1 + np.random.normal(0, 0.3, n)
    y2 = x * 2 + 0.4 + np.random.normal(0, 0.3, n)
    df = pd.DataFrame({
        "x": x,
        "y1": y1,
        "y2": y2,
    })
    df.plot(x="x", y=["y1", "y2"], alpha=.5)

    # 条形图Bar
    df = pd.DataFrame(np.random.rand(5, 3), columns=["a", "b", "c"])
    df.plot.bar()

    df.plot.bar(stacked=True)

    df.plot.barh()

    # 分布图Hist
    df = pd.DataFrame({"a": np.random.randn(1000)})
    df.plot.hist()

    df = pd.DataFrame(
        {
            "a": np.random.randn(1000) + 1,
            "b": np.random.randn(1000),
            "c": np.random.randn(1000) - 4,
        }
    )

    df.plot.hist(alpha=0.5, bins=30)

    # 饼图Pie
    df = pd.DataFrame(
        {"boss": np.random.rand(4)},
        index=["meeting", "supervise", "teaching", "team building"],
    )
    df.plot.pie(y="boss", figsize=(7, 7))


    df = pd.DataFrame(
        {
            "bigBoss": np.random.rand(4),
            "smallBoss": np.random.rand(4),
        },
        index=["meeting", "supervise", "teaching", "team building"],
    )
    df.plot.pie(subplots=True, figsize=(9, 9), legend=False)
    # 面积图Area
    df = pd.DataFrame(
        np.random.rand(10, 4),
        columns=["a", "b", "c", "d"]
    )
    df.plot.area()
    plt.show()
    df.plot.area(stacked=False)
    plt.show()
    # https://pandas.pydata.org/pandas-docs/stable/user_guide/visualization.html

# Press the green button in the gutter to run the script.
if __name__ == '__main__':
    print_hi('绘制图表')

# See PyCharm help at https://www.jetbrains.com/help/pycharm/
复制粘贴并覆盖到你的 main.py 中运行,运行结果如下。
lua
Hi, 绘制图表八 源码地址
代码地址:
国内看 Gitee 之 pandas/绘制图表.py
国外看 GitHub 之 pandas/绘制图表.py
引用 莫烦 Python