本节重点介绍 :
- 获取采集端的高基数metrics的tsdb页面解析
- tsdb统计函数Stats源码解读
获取采集端的高基数metrics
tsdb页面解析
- Top 10 label names with value count: 标签中value最多的10个


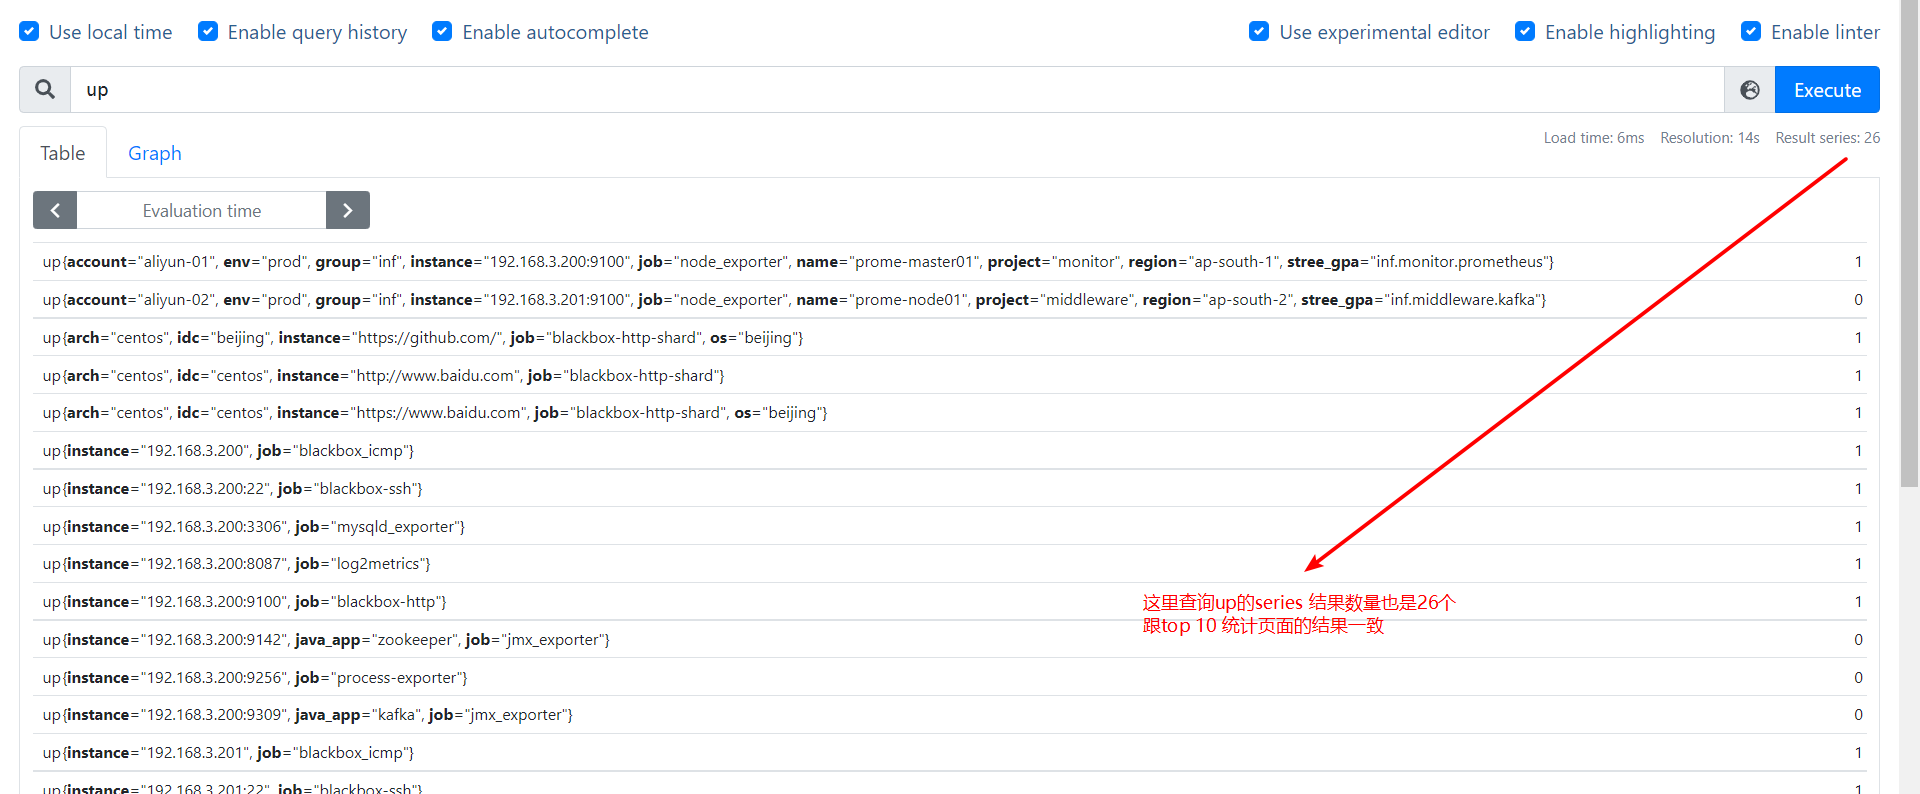
- Top 10 series count by metric names: metric_name匹配的series最多的10个

- Top 10 label names with high memory usage: 标签消耗内存最多的10个
- Top 10 series count by label value pairs: 标签对数量最多的10个

核心源码解读
- 位置 D:\go_path\src\github.com\prometheus\prometheus\tsdb\index\postings.go
web侧调用入口
- api /api/v1/status/tsdb
- 代码位置 D:\go_path\src\github.com\prometheus\prometheus\web\api\v1\api.go
func (api *API) serveTSDBStatus(*http.Request) apiFuncResult {
	s, err := api.db.Stats("__name__")
	if err != nil {
		return apiFuncResult{nil, &apiError{errorInternal, err}, nil, nil}
	}
	metrics, err := api.gatherer.Gather()
	if err != nil {
		return apiFuncResult{nil, &apiError{errorInternal, fmt.Errorf("error gathering runtime status: %s", err)}, nil, nil}
	}
	chunkCount := int64(math.NaN())
	for _, mF := range metrics {
		if *mF.Name == "prometheus_tsdb_head_chunks" {
			m := *mF.Metric[0]
			if m.Gauge != nil {
				chunkCount = int64(m.Gauge.GetValue())
				break
			}
		}
	}
	return apiFuncResult{tsdbStatus{
		HeadStats: HeadStats{
			NumSeries:     s.NumSeries,
			ChunkCount:    chunkCount,
			MinTime:       s.MinTime,
			MaxTime:       s.MaxTime,
			NumLabelPairs: s.IndexPostingStats.NumLabelPairs,
		},
		SeriesCountByMetricName:     convertStats(s.IndexPostingStats.CardinalityMetricsStats),
		LabelValueCountByLabelName:  convertStats(s.IndexPostingStats.CardinalityLabelStats),
		MemoryInBytesByLabelName:    convertStats(s.IndexPostingStats.LabelValueStats),
		SeriesCountByLabelValuePair: convertStats(s.IndexPostingStats.LabelValuePairsStats),
	}, nil, nil, nil}
}
底层调用的是 tsdb的Stats函数,传入__name__标签
tsdb 统计函数 Stats
- 位置 D:\go_path\src\github.com\prometheus\prometheus\tsdb\index\postings.go
初始最大堆用作统计
	metrics := &maxHeap{}
	labels := &maxHeap{}
	labelValueLength := &maxHeap{}
	labelValuePairs := &maxHeap{}
	numLabelPairs := 0

	metrics.init(maxNumOfRecords)
	labels.init(maxNumOfRecords)
	labelValueLength.init(maxNumOfRecords)
	labelValuePairs.init(maxNumOfRecords)
遍历双层map 获取 标签中value最多的10个
- 把所有非空的标签算入统计 labels,值是e中id-set的长度
- labels这个 最大堆统计的就是 Top 10 label names with value count,代表 标签中value最多的10个
	for n, e := range p.m {
		if n == "" {
			continue
		}
		labels.push(Stat{Name: n, Count: uint64(len(e))})
	}
遍历双层map 获取 标签中value最多的10个
- 遍历内层的map,如果name和传入的label一致,则加入metrics最大堆统计
- metrics这个 最大堆统计的就是 Top 10 series count by metric names: metric_name匹配的series最多的10个
	for n, e := range p.m {
        ...
		size = 0
		for name, values := range e {
			if n == label {
				metrics.push(Stat{Name: name, Count: uint64(len(values))})
			}
		}
	}
遍历双层map 获取 标签对数量最多的10个
- 遍历内层的map,把name=value做统计算入labelValuePairs最大堆统计
- labelValuePairs这个 最大堆统计的就是Top 10 series count by label value pairs: 标签对数量最多的10个
	for n, e := range p.m {
        ...

		for name, values := range e {
            labelValuePairs.push(Stat{Name: n + "=" + name, Count: uint64(len(values))})
		}
	}
遍历双层map 获取 标签消耗内存最多的10个
- 遍历内层的map,计算标签的value字符串长度 size,推入labelValueLength 最大堆统计
- labelValueLength这个 最大堆统计的就是Top 10 label names with high memory usage: 标签消耗内存最多的10个
	for n, e := range p.m {
		if n == "" {
			continue
		}
		size = 0
		for name, values := range e {
			size += uint64(len(name))
		}
		labelValueLength.push(Stat{Name: n, Count: size})
	}
get方法获取最大堆的结果
- D:\go_path\src\github.com\prometheus\prometheus\tsdb\index\postingsstats.go
func (m *maxHeap) get() []Stat {
	sort.Slice(m.Items, func(i, j int) bool {
		return m.Items[i].Count > m.Items[j].Count
	})
	return m.Items
}
本节重点介绍 :
- 获取采集端的高基数metrics的tsdb页面解析
- tsdb统计函数Stats源码解读
- 依赖倒排索引统计
- 是基于内存中的倒排索引 算最大堆取 top10