使用DeepSeek对Prometheus告警进行自动解析并生成处理建议发送至飞书/钉钉
一、简介
在现代的监控系统中,Prometheus 作为一款开源的监控和告警工具,被广泛应用于各种场景。当系统出现异常时,Prometheus 能够及时触发告警,帮助运维人员快速发现问题。然而,告警信息往往只是简单地告知问题的发生,对于问题的具体原因和处理建议,运维人员还需要花费时间去分析。为了提高运维效率,我们可以借助大语言模型 DeepSeek 对 Prometheus 告警进行自动解析,并将解析结果和处理建议发送到飞书/钉钉,让运维人员能够第一时间了解问题的全貌和解决方案。
二、整体架构
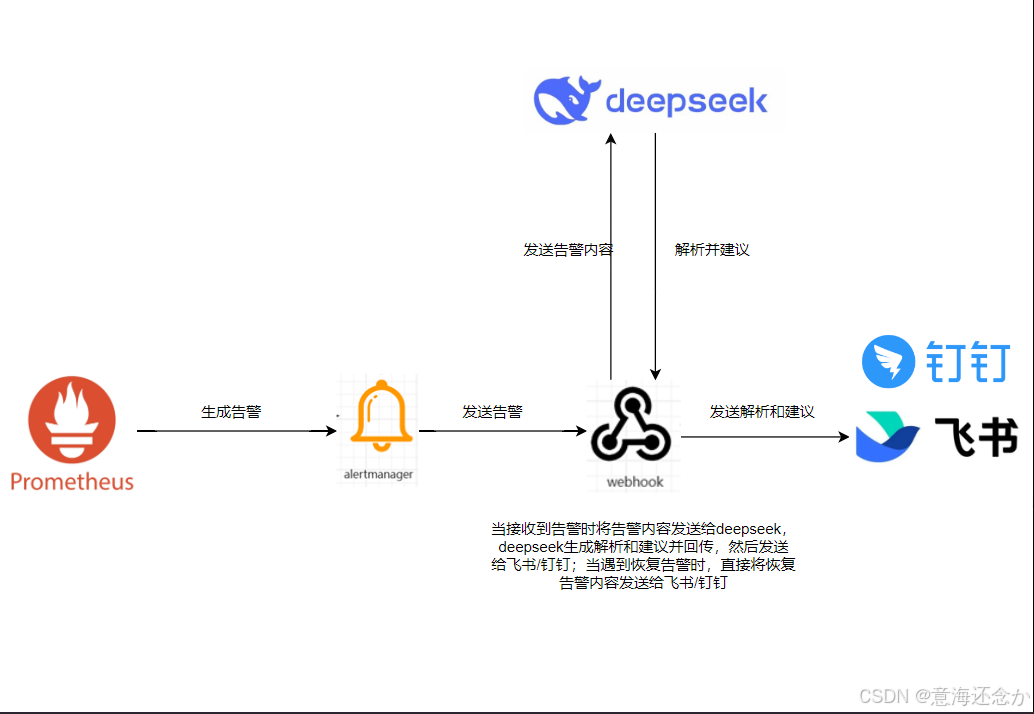
整个系统的架构主要由以下几个部分组成:
Prometheus :负责监控系统的各项指标,当指标超过预设的阈值时,触发告警。
Alertmanager :接收 Prometheus 发送的告警信息,并根据配置的规则进行分组、抑制、路由等处理,然后将告警信息发送到指定的 Webhook 地址。
Flask 应用 :作为 Webhook 服务,接收 Alertmanager 发送的告警信息,调用 DeepSeek API 对告警进行解析,并将解析结果和处理建议发送到飞书/钉钉。
DeepSeek API :利用大语言模型的能力,对 Prometheus 告警信息进行解析,提供问题的分析和处理建议。
飞书/钉钉:作为消息接收端,接收 Flask 应用发送的告警解析和处理建议,方便运维人员及时查看。
三、详细实现步骤
默认已部署好Prometheus+alertmanager环境,alertmanager发送告警给webhook程序,webhook程序接收到告警后将告警内容发送给deepseek解析,再将deepseek的解析内容及建议发送到飞书,如果遇到恢复告警则直接发送给飞书/钉钉。
说明:如需源代码请私聊我,前提是粉丝朋友
3.1、部署alert-handler(即flask应用)
编写StatefulSet及service的yaml文件
yaml
apiVersion: apps/v1
kind: StatefulSet
metadata:
  name: alert-handler
  namespace: monitoring
  labels:
    app: alert-handler
spec:
  serviceName: alert-handler-headless  # 需要配套的Headless Service
  replicas: 1
  selector:
    matchLabels:
      app: alert-handler
  template:
    metadata:
      labels:
        app: alert-handler
    spec:
      containers:
        - name: alert-handler
          image: chenzhenxu123/alert-handler:1.0.22
          ports:
            - containerPort: 5000
          env:
            - name: NOTIFY_CHANNEL
              value: feishu      #默认是feishu   可以修改为dingtalk ,也就是钉钉
            - name: WEBHOOK_URL
              valueFrom:
                secretKeyRef:
                  name: alert-secrets
                  key: webhook
            - name: DEEPSEEK_API_KEY
              valueFrom:
                secretKeyRef:
                  name: alert-secrets
                  key: deepseek-key
          resources:
            requests:
              memory: "256Mi"
              cpu: "100m"
            limits:
              memory: "512Mi"
              cpu: "500m"

---
apiVersion: v1
kind: Service
metadata:
  name: alert-handler
  namespace: monitoring
spec:
  selector:
    app: alert-handler
  ports:
    - protocol: TCP
      port: 5000
      targetPort: 5000
编写Secret的yaml文件
注意:准备飞书/钉钉机器人的webhook、deepseek-api key
deepseek-api key可以通过https://platform.deepseek.com/api_keys申请(DeepSeek-R1 API 服务定价为每百万输入 tokens 1 元(缓存命中)/ 4 元(缓存未命中),每百万输出 tokens 16 元。)总体deepseek还是很便宜的,哈哈。
yaml
apiVersion: v1
kind: Secret
metadata:
  name: alert-secrets
  namespace: monitoring
type: Opaque
data:
  webhook: xxxxxxxxxxxxxxxxxxxx    #飞书/钉钉机器人webhook地址,此处是base64加密
  deepseek-key: xxxxxxxxxxxxxxxxxxxxxxxxxx  #deepseek-api key,此处是base64加密
3.2、alertmanager配置
yaml
receivers:

    - name: 'feishu-with-deepseek'   #钉钉的话可以是dingtalk-with-deepseek
      webhook_configs:
      - url: 'http://alert-handler.monitoring.svc.cluster.local:5000/handle_alert'
        send_resolved: false
四、效果展示
4.1、模拟发送告警
json
模拟告警发送内容
=====================================
curl -X POST http://alert-handler.monitoring.svc.cluster.local:5000/handle_alert \
-H "Content-Type: application/json" \
-d '{
"receiver": "alert-handler",
"status": "firing",
"alerts": [
{
"status": "firing",
"labels": {
"alertname": "HighCPUUsage",
"instance": "server-01",
"job": "node_exporter",
"severity": "critical",
"monitor": "production"
},
"annotations": {
"summary": "High CPU usage on server-01",
"description": "CPU usage has been above 90% for the last 5 minutes.",
"runbook_url": "http://wiki.example.com/runbooks/high-cpu-usage"
},
"startsAt": "2023-10-12T12:00:00Z",
"endsAt": "0001-01-01T00:00:00Z",
"generatorURL": "http://prometheus.example.com/graph?g0.expr=cpu_usage%7Binstance%3D%22server-01%22%7D&g0.tab=1",
"fingerprint": "a1b2c3d4e5f6"
}
]
}'
===================================================
模拟告警恢复发送内容
===================================================
curl -X POST http://alert-handler.monitoring.svc.cluster.local:5000/handle_alert \
-H "Content-Type: application/json" \
-d '{
"receiver": "alert-handler",
"status": "resolved",
"alerts": [
{
"status": "resolved",
"labels": {
"alertname": "HighCPUUsage",
"instance": "server-01",
"job": "node_exporter",
"severity": "critical",
"monitor": "production"
},
"annotations": {
"summary": "[RESOLVED] High CPU usage on server-01",
"description": "CPU usage has returned to normal levels.",
"runbook_url": "http://wiki.example.com/runbooks/high-cpu-usage"
},
"startsAt": "2023-10-12T12:00:00Z",
"endsAt": "2023-10-12T12:30:00Z",
"generatorURL": "http://prometheus.example.com/graph?g0.expr=cpu_usage%7Binstance%3D%22server-01%22%7D&g0.tab=1",
"fingerprint": "a1b2c3d4e5f6"
}
]
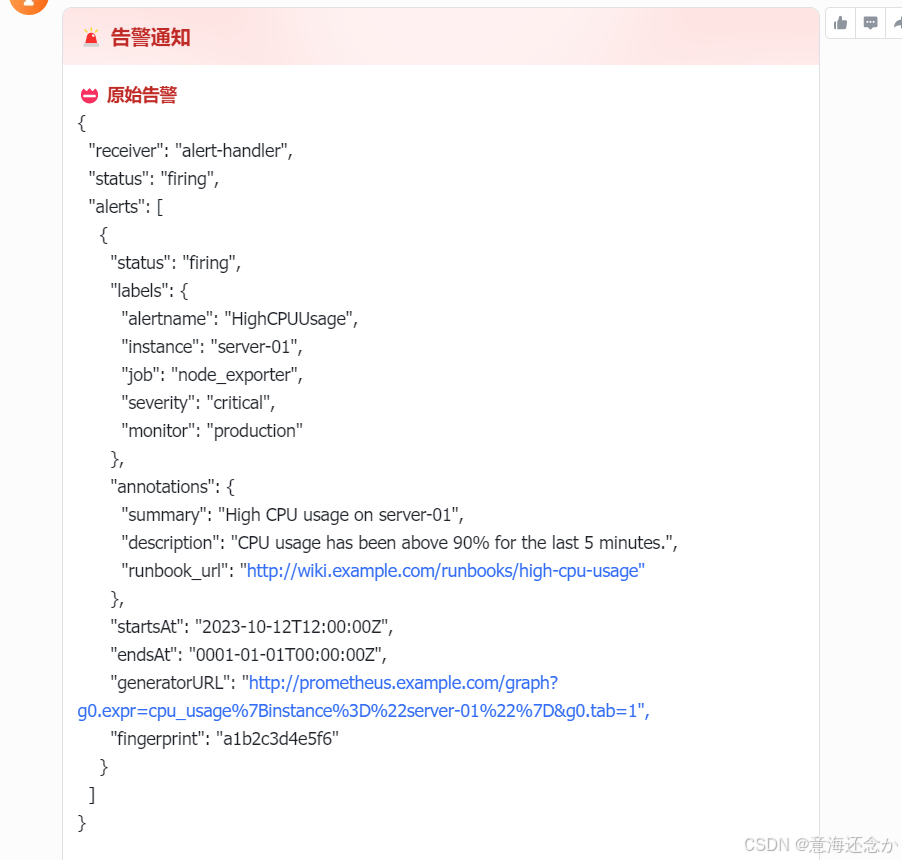
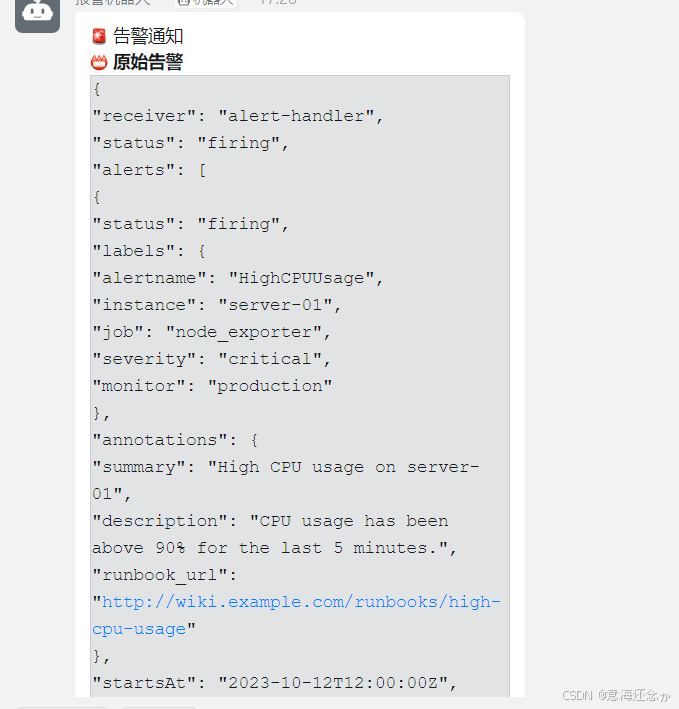
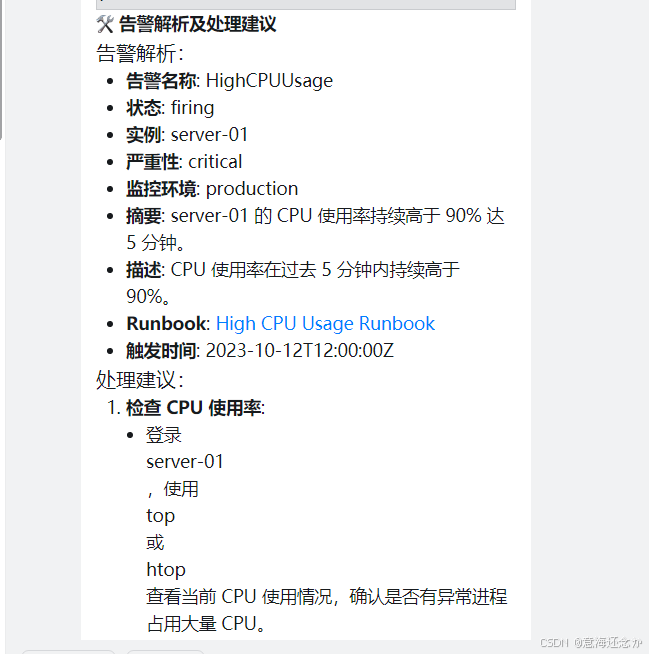
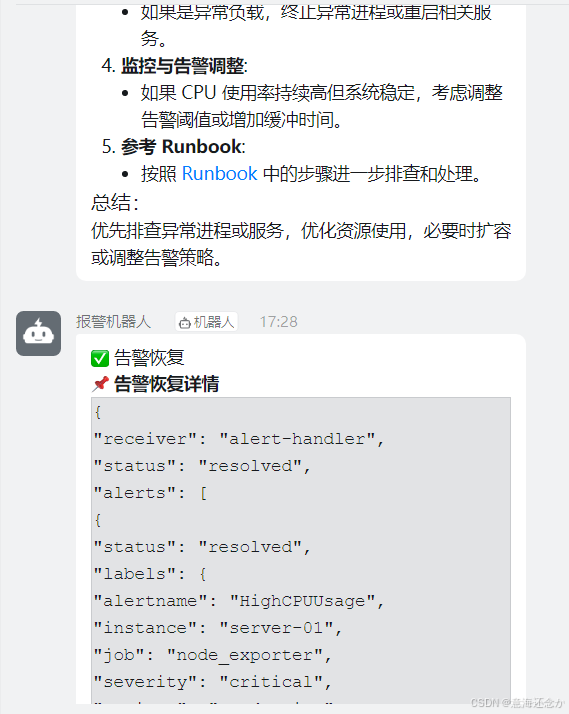
}'4.2、飞书效果展示
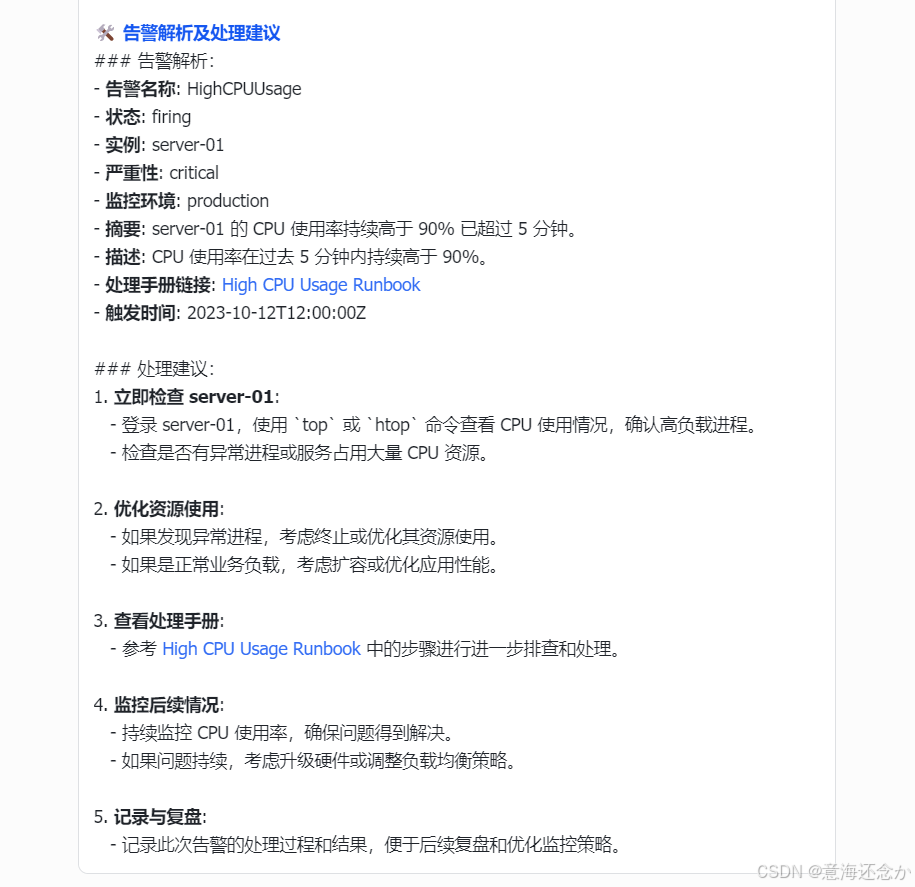
告警内容解析及建议
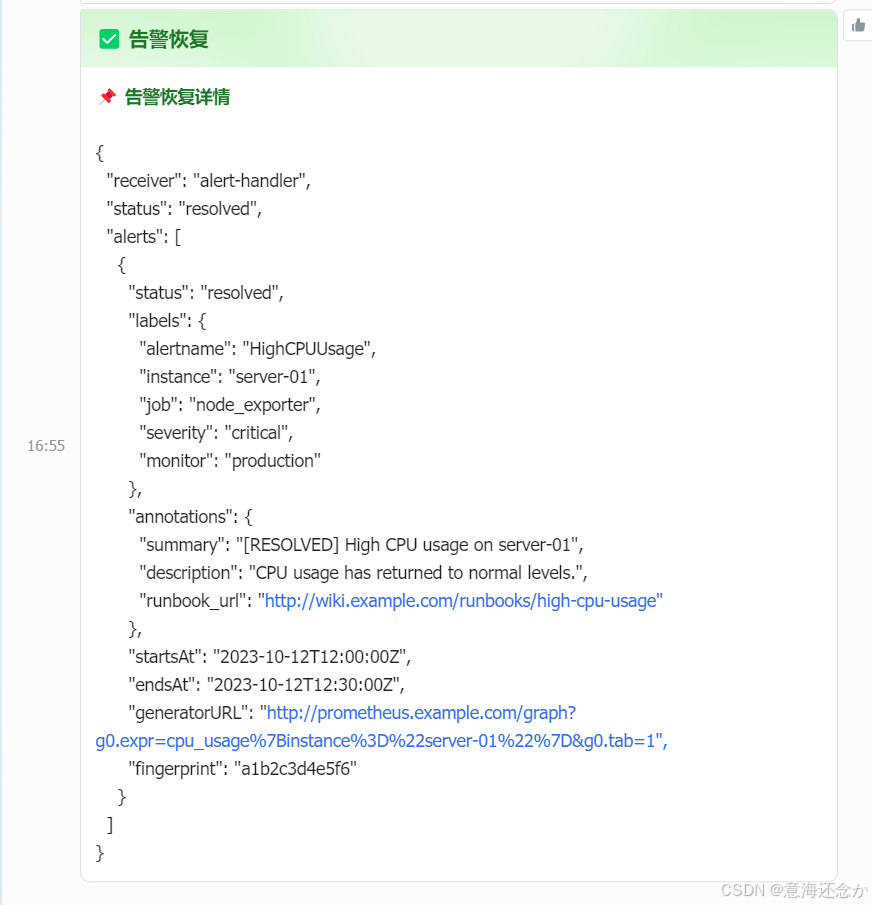
告警恢复
4.3、钉钉效果展示
告警内容解析及建议
告警恢复
以上如有需要源码的可以私聊我,前提是粉丝朋友