前言
系列专栏:【深度学习:算法项目实战】✨︎
涉及医疗健康、财经金融、商业零售、食品饮料、运动健身、交通运输、环境科学、社交媒体以及文本和图像处理等诸多领域,讨论了各种复杂的深度神经网络思想,如卷积神经网络、循环神经网络、生成对抗网络、门控循环单元、长短期记忆、自然语言处理、深度强化学习、大型语言模型和迁移学习。
本文使用torch.nn.Conv1d卷积模块实现时间卷积网络TCN,论文链接:https://arxiv.org/pdf/1803.01271


目录
- [1. 数据集介绍](#1. 数据集介绍)
- [2. 数据可视化](#2. 数据可视化)
- [3. 特征工程](#3. 特征工程)
-
- [3.1 特征缩放(归一化)](#3.1 特征缩放(归一化))
- [3.2 构建监督学习数据](#3.2 构建监督学习数据)
- [3.3 数据集划分(Subset)](#3.3 数据集划分(Subset))
- [3.4 数据加载器](#3.4 数据加载器)
- [4. 构建时序预测模型(TSF)](#4. 构建时序预测模型(TSF))
-
- [4.1 构建TCN模型](#4.1 构建TCN模型)
- [4.2 实例化模型、定义损失函数与优化器](#4.2 实例化模型、定义损失函数与优化器)
- [4.3 模型概要](#4.3 模型概要)
- [5. 模型训练](#5. 模型训练)
-
- [5.1 定义训练函数](#5.1 定义训练函数)
- [5.2 定义评估函数](#5.2 定义评估函数)
- [5.3 定义早停法并保存模型](#5.3 定义早停法并保存模型)
- [5.4 定义模型训练主程序](#5.4 定义模型训练主程序)
- [5.5 执行模型训练过程](#5.5 执行模型训练过程)
- [6. 模型预测](#6. 模型预测)
-
- [6.1 构建预测函数](#6.1 构建预测函数)
- [7. 模型验证](#7. 模型验证)
-
- [7.1 验证集预测](#7.1 验证集预测)
- [7.2 验证集评估](#7.2 验证集评估)
-
- [7.2.1 回归拟合图](#7.2.1 回归拟合图)
- [7.2.2 评估指标](#7.2.2 评估指标)
- [8. 模型测试](#8. 模型测试)
-
- [8.1 测试集预测](#8.1 测试集预测)
- [8.2 测试集评估](#8.2 测试集评估)
-
- [8.2.1 回归拟合图](#8.2.1 回归拟合图)
- [8.2.2 评估指标](#8.2.2 评估指标)
- 预测可视化
- 完整源码
1. 数据集介绍
本文用到的数据集是ETTh1.csv,ETTh1数据集是电力变压器数据集(ETDataset)的一部分,旨在用于长序列时间序列预测问题的研究。该数据集收集了中国两个不同县两年的数据,以预测特定地区的电力需求情况。
python
import numpy as np
import pandas as pd
import matplotlib.pyplot as plt
import matplotlib.dates as mdates
import seaborn as sns

import torch
import torch.nn as nn
from torch.utils.data import DataLoader, TensorDataset, Subset
from torchinfo import summary
from torchmetrics.functional.regression import (
    mean_absolute_error,
    mean_absolute_percentage_error,
    mean_squared_error,
    mean_squared_log_error,
    r2_score
)
python
np.random.seed(0)
torch.manual_seed(0)
python
df = pd.read_csv('../ETTh1.csv', index_col=0, parse_dates=True)
print(df.head(5))
python
                      HUFL   HULL   MUFL   MULL   LUFL   LULL         OT
date
2016-07-01 00:00:00  5.827  2.009  1.599  0.462  4.203  1.340  30.531000
2016-07-01 01:00:00  5.693  2.076  1.492  0.426  4.142  1.371  27.787001
2016-07-01 02:00:00  5.157  1.741  1.279  0.355  3.777  1.218  27.787001
2016-07-01 03:00:00  5.090  1.942  1.279  0.391  3.807  1.279  25.044001
2016-07-01 04:00:00  5.358  1.942  1.492  0.462  3.868  1.279  21.948000
2. 数据可视化
这里我们使用matplotlib库实现预测数据的可视化,以便观察数据的趋势
python
plt.style.use('seaborn-v0_8-whitegrid')
fig, ax = plt.subplots(figsize=(20, 6))

# 绘制数据
ax.plot(df['OT'], color='darkorange' ,label='Trend')

# 设置x轴为时间轴,并显示具体日期
locator = mdates.AutoDateLocator(minticks=8, maxticks=12)  # 自动定位刻度
formatter = mdates.DateFormatter('%Y-%m-%d')  # 自定义刻度标签格式
ax.xaxis.set_major_locator(locator)
ax.xaxis.set_major_formatter(formatter)

# 设置标题
plt.title('OT  Trend', fontdict={'family': 'Times New Roman', 'fontsize': 15, 'color':'black'})
plt.xticks(rotation=45) # 旋转刻度标签以提高可读性
plt.ylabel('Temp', fontdict={'family': 'Times New Roman', 'fontsize': 14})
plt.legend(loc="upper right", prop={'family': 'Times New Roman'})
plt.show()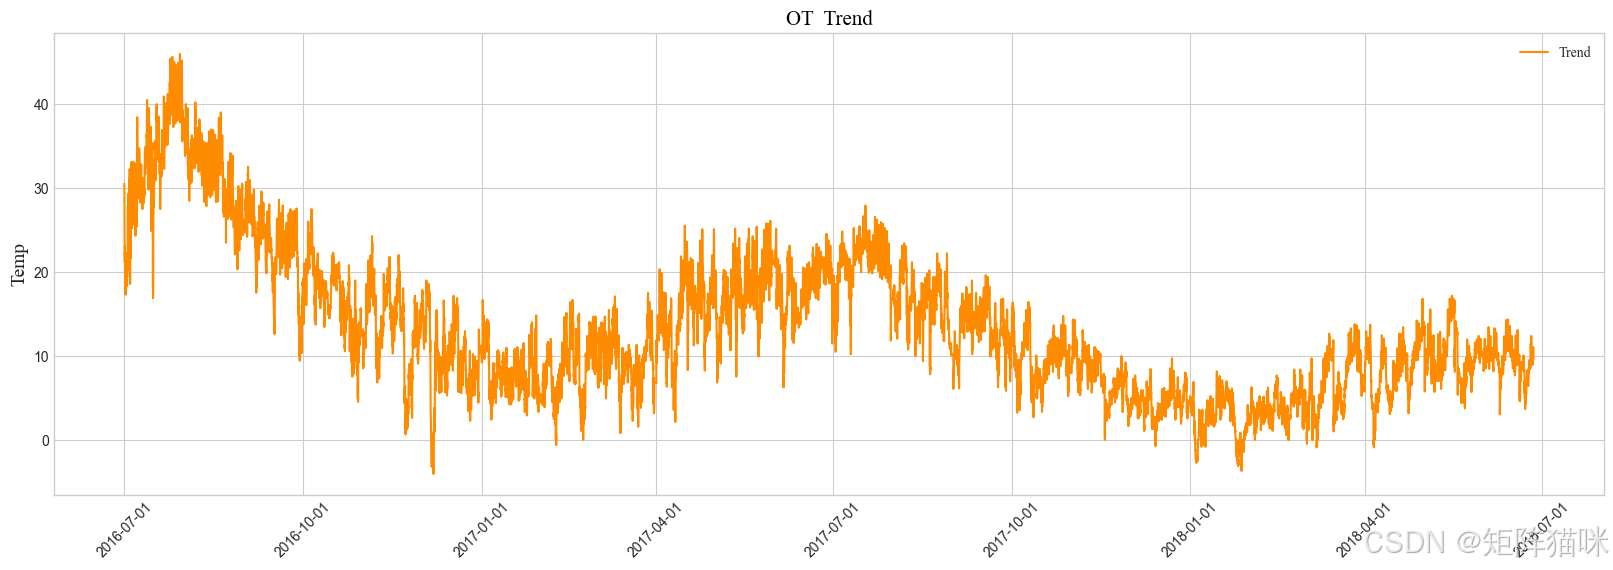
3. 特征工程
3.1 特征缩放(归一化)
接下来我们按照公式 x s t d = x − x m i n x m a x − x m i n x_{std}=\frac{x-x_{min}} {x_{max}-x_{min}} xstd=xmax−xminx−xmin 进行数据归一化,详细解释参考文章 机器学习:基于XGBoost极端梯度提升实现股票价格预测------TimeSeriesSplit交叉验证与GridSearchCV超参数调优详解
在单变量预测中,过往目标数据是唯一的输入特征,模型通过分析目标变量自身的历史规律进行预测。然而,在多变量预测中,过往目标数据与其他外部特征结合构成模型的输入特征,但目标变量的历史信息乃是核心。
python
X = df # 选取特征,目标数据与其他外部特征结合
X_std = (X - X.min(axis=0)) / (X.max(axis=0) - X.min(axis=0)) # 特征缩放
print(X_std)
python
                         HUFL      HULL      MUFL      MULL      LUFL  \
date
2016-07-01 00:00:00  0.615599  0.454943  0.628980  0.467510  0.556576
2016-07-01 01:00:00  0.612708  0.459449  0.626458  0.464878  0.550279
2016-07-01 02:00:00  0.601143  0.436920  0.621438  0.459689  0.512595
2016-07-01 03:00:00  0.599698  0.450437  0.621438  0.462320  0.515693
2016-07-01 04:00:00  0.605480  0.450437  0.626458  0.467510  0.521990
...                       ...       ...       ...       ...       ...
2018-06-26 15:00:00  0.453765  0.558574  0.458955  0.589577  0.481107
2018-06-26 16:00:00  0.371392  0.608137  0.376064  0.599956  0.487404
2018-06-26 17:00:00  0.550572  0.576597  0.572038  0.587018  0.506298
2018-06-26 18:00:00  0.689299  0.576597  0.720262  0.587018  0.500000
2018-06-26 19:00:00  0.708091  0.558574  0.737019  0.548059  0.506298

                         LULL        OT
date
2016-07-01 00:00:00  0.613765  0.691018
2016-07-01 01:00:00  0.620783  0.636233
2016-07-01 02:00:00  0.586144  0.636233
2016-07-01 03:00:00  0.599955  0.581468
2016-07-01 04:00:00  0.599955  0.519656
...                       ...       ...
2018-06-26 15:00:00  0.655196  0.299159
2018-06-26 16:00:00  0.689608  0.301955
2018-06-26 17:00:00  0.655196  0.286521
2018-06-26 18:00:00  0.634594  0.276679
2018-06-26 19:00:00  0.641386  0.272466

[17420 rows x 7 columns]
3.2 构建监督学习数据
在时间序列预测中,我们将时间序列数据转换为监督学习格式,以方便各种机器学习模型进行预测。
python
lag = 30  # 时间步
x_array = np.array([X_std[i:i+lag] for i in range(len(X_std) - lag)])
y_array = np.array(X_std.iloc[lag:, -1]).reshape(-1, 1)
x_tensor = torch.tensor(x_array, dtype=torch.float)
y_tensor = torch.tensor(y_array, dtype=torch.float)
print(x_tensor.shape, y_tensor.shape)  # 检查一下数据维度
python
torch.Size([17390, 30, 7]) torch.Size([17390, 1])3.3 数据集划分(Subset)
使用 torch.utils.data 模块中的 Subset 划分数据集,本质是按索引进行切片,可以去查看Subset源代码
python
# 使用 TensorDataset 类将两个张量 x_tensor 和 y_tensor 组合成一个数据集
dataset = TensorDataset(x_tensor, y_tensor)
train_idx = list(range(len(dataset)*3//5)) # 划分训练集索引
val_idx = list(range(len(dataset)*3//5, len(dataset)*4//5)) # 划分验证集索引
test_idx = list(range(len(dataset)*4//5, len(dataset))) # 划分测试集索引
train_set = Subset(dataset, indices=train_idx) # 创建 Subset 对象,用于训练
val_set = Subset(dataset, indices=val_idx) # 创建 Subset 对象,用于验证
test_set = Subset(dataset, indices=test_idx) # 创建 Subset 对象,用于测试
3.4 数据加载器
接下来,我们将使用 DataLoader创建数据加载器
python
train_loader = DataLoader(dataset=train_set, batch_size=128, shuffle=True)
valid_loader = DataLoader(dataset=val_set,batch_size=128, shuffle=False)
test_loader = DataLoader(dataset=test_set,batch_size=128, shuffle=False)
4. 构建时序预测模型(TSF)
4.1 构建TCN模型
构建Chomp1d模块,裁剪因果卷积产生的右侧多余填充,确保模型的时间维度对齐且严格遵循因果约束
python
class Chomp1d(nn.Module):
    def __init__(self, chomp_size):
        super(Chomp1d, self).__init__()
        self.chomp_size = chomp_size

    def forward(self, x):
        return x[:, :, :-self.chomp_size].contiguous()
在TCN残差块TemporalBlock中,Chomp1d通常与因果卷积、ReLU激活和Dropout组合使用:
python
class TemporalBlock(nn.Module):
    def __init__(self, n_inputs, n_outputs, kernel_size, stride, dilation, padding, dropout=0.2):
        super(TemporalBlock, self).__init__()
        self.conv1 = weight_norm(nn.Conv1d(n_inputs, n_outputs, kernel_size,
                                           stride=stride, padding=padding, dilation=dilation))
        self.chomp1 = Chomp1d(padding) # 裁剪右侧多余填充
        self.relu1 = nn.ReLU()
        self.dropout1 = nn.Dropout(dropout)

        self.conv2 = weight_norm(nn.Conv1d(n_outputs, n_outputs, kernel_size,
                                           stride=stride, padding=padding, dilation=dilation))
        self.chomp2 = Chomp1d(padding)
        self.relu2 = nn.ReLU()
        self.dropout2 = nn.Dropout(dropout)

        self.net = nn.Sequential(self.conv1, self.chomp1, self.relu1, self.dropout1,
                                 self.conv2, self.chomp2, self.relu2, self.dropout2)
        self.downsample = nn.Conv1d(n_inputs, n_outputs, 1) if n_inputs != n_outputs else None
        self.relu = nn.ReLU()
        self.init_weights()

    def init_weights(self):
        self.conv1.weight.data.normal_(0, 0.01)
        self.conv2.weight.data.normal_(0, 0.01)
        if self.downsample is not None:
            self.downsample.weight.data.normal_(0, 0.01)

    def forward(self, x):
        out = self.net(x)
        res = x if self.downsample is None else self.downsample(x)
        return self.relu(out + res)
TemporalConvNet 模块,通过堆叠多层膨胀因果卷积块,逐级扩大时间感受野,从而捕捉时间序列中的长期依赖关系
python
class TemporalConvNet(nn.Module):
    def __init__(self, num_inputs, num_channels, kernel_size=2, dropout=0.2):
        super(TemporalConvNet, self).__init__()
        layers = []
        num_levels = len(num_channels)
        for i in range(num_levels):
            dilation_size = 2 ** i
            in_channels = num_inputs if i == 0 else num_channels[i-1]
            out_channels = num_channels[i]
            layers += [TemporalBlock(in_channels, out_channels, kernel_size, stride=1, dilation=dilation_size,
                                     padding=(kernel_size-1) * dilation_size, dropout=dropout)]

        self.network = nn.Sequential(*layers)

    def forward(self, x):
return self.network(x)构建TCN模型的神经网络
python
class TCN(nn.Module):
    def __init__(self, input_dim, num_channels, output_dim, kernel_size=2, dropout=0.2):
        super(TCN, self).__init__()
        self.tcn = TemporalConvNet(num_inputs=input_dim,
                                   num_channels=num_channels,
                                   kernel_size=kernel_size,
                                   dropout=dropout)
        # 全连接层将TCN的输出映射到预测维度
        self.linear = nn.Linear(num_channels[-1], output_dim)

    def forward(self, x):
        # 输入形状: (batch_size, sequence_length, input_dim)
        x = x.permute(0, 2, 1)
        x = self.tcn(x)  # 输出形状: (batch_size, num_channels[-1], sequence_length)
        x = x[:, :, -1]  # 取最后一个时间步的输出(单步 预测)
        output = self.linear(x)
        return output
4.2 实例化模型、定义损失函数与优化器
python
params = {
    'input_dim': 7, # 'input_size',C_in
    'output_dim': 1, # 单步 预测
    'num_channels': [128] * 3,
    'kernel_size': 2,
    'dropout': .2,
}
python
ts_model = TCN(**params) # 实例化模型
criterion = nn.MSELoss() # 设置损失函数
optimizer = torch.optim.Adam(params=ts_model.parameters(), lr=0.0001)在PyTorch中,可以使用torch.nn模块中的损失函数类,如nn.MSELoss用于回归问题
4.3 模型概要
python
summary(model=ts_model, input_size=(128, 30, 7))
python
==============================================================================================================
Layer (type:depth-idx)                                       Output Shape              Param #
==============================================================================================================
TCN                                                          [128, 1]                  --
├─TemporalConvNet: 1-1                                       [128, 128, 30]            --
│    └─Sequential: 2-1                                       [128, 128, 30]            --
│    │    └─TemporalBlock: 3-1                               [128, 128, 30]            36,096
│    │    └─TemporalBlock: 3-2                               [128, 128, 30]            66,048
│    │    └─TemporalBlock: 3-3                               [128, 128, 30]            66,048
├─Linear: 1-2                                                [128, 1]                  129
==============================================================================================================
Total params: 168,321
Trainable params: 168,321
Non-trainable params: 0
Total mult-adds (Units.MEGABYTES): 3.95
==============================================================================================================
Input size (MB): 0.11
Forward/backward pass size (MB): 3.93
Params size (MB): 0.00
Estimated Total Size (MB): 4.05
==============================================================================================================
5. 模型训练
5.1 定义训练函数
在模型训练之前,我们需先定义 train 函数来执行模型训练过程
python
def train(model, iterator):
    model.train()
    epoch_loss = 0

    for batch_idx, (data, target) in enumerate(iterable=iterator):
        optimizer.zero_grad()
        output = model(data)
        loss = criterion(output, target)
        loss.backward()
        optimizer.step()
        epoch_loss += loss.item()
    avg_loss = epoch_loss / len(iterator)

    return avg_loss
上述代码定义了一个名为 train 的函数,用于训练给定的模型。它接收模型、数据迭代器作为参数,并返回训练过程中的平均损失。
5.2 定义评估函数
python
def evaluate(model, iterator): # Being used to validate and test
    model.eval()
    epoch_loss = 0

    with torch.no_grad():
        for batch_idx, (data, target) in enumerate(iterable=iterator):
            output = model(data)
            loss = criterion(output, target)
            epoch_loss += loss.item()

        avg_loss = epoch_loss / len(iterator)

        return avg_loss
上述代码定义了一个名为 evaluate 的函数,用于评估给定模型在给定数据迭代器上的性能。它接收模型、数据迭代器作为参数,并返回评估过程中的平均损失。这个函数通常在模型训练的过程中定期被调用,以监控模型在验证集或测试集上的性能。通过评估模型的性能,可以了解模型的泛化能力和训练的进展情况。
5.3 定义早停法并保存模型
定义早停法以便在模型训练过程中调用
python
class EarlyStopping:
def __init__(self, patience=5, delta=0.0):
self.patience = patience # 允许的连续未改进次数
self.delta = delta # 损失波动容忍阈值
self.counter = 0 # 未改进计数器
self.best_loss = float('inf') # 最佳验证损失值
self.early_stop = False # 终止训练标志
def __call__(self, val_loss, model):
if val_loss < (self.best_loss - self.delta):
self.best_loss = val_loss
self.counter = 0
# 保存最佳模型参数:ml-citation{ref="1,5" data="citationList"}
torch.save(model.state_dict(), 'best_model.pth')
else:
self.counter +=1
if self.counter >= self.patience:
self.early_stop = True
python
EarlyStopper = EarlyStopping(patience=50, delta=0.00001) # 设置参数若不想使用早停法EarlyStopper,参数patience设置一个超大的值,delta设置为0,即可。
5.4 定义模型训练主程序
通过定义模型训练主程序来执行模型训练
python
def main():
    train_losses = []
    val_losses = []

    for epoch in range(1000):
        train_loss = train(model=ts_model, iterator=train_loader)
        val_loss = evaluate(model=ts_model, iterator=valid_loader)

        train_losses.append(train_loss)
        val_losses.append(val_loss)

        print(f'Epoch: {epoch + 1:02}, Train MSELoss: {train_loss:.5f}, Val. MSELoss: {val_loss:.5f}')

        # 触发早停判断
        EarlyStopper(val_loss, model=ts_model)
        if EarlyStopper.early_stop:
            print(f"Early stopping at epoch {epoch}")
            break

    plt.figure(figsize=(10, 5))
    plt.plot(train_losses, label='Training Loss')
    plt.plot(val_losses, label='Validation Loss')
    plt.xlabel('Epoch')
    plt.ylabel('MSELoss')
    plt.title('Training and Validation Loss over Epochs')
    plt.legend()
    plt.grid(True)
    plt.show()
5.5 执行模型训练过程
python
main()
python
Epoch: 222, Train MSELoss: 0.00040, Val. MSELoss: 0.00032
Epoch: 223, Train MSELoss: 0.00040, Val. MSELoss: 0.00023
Epoch: 224, Train MSELoss: 0.00040, Val. MSELoss: 0.00032
Epoch: 225, Train MSELoss: 0.00041, Val. MSELoss: 0.00022
Epoch: 226, Train MSELoss: 0.00040, Val. MSELoss: 0.00025
Epoch: 227, Train MSELoss: 0.00040, Val. MSELoss: 0.00027
Epoch: 228, Train MSELoss: 0.00040, Val. MSELoss: 0.00021
Epoch: 229, Train MSELoss: 0.00040, Val. MSELoss: 0.00031
Epoch: 230, Train MSELoss: 0.00040, Val. MSELoss: 0.00024
Epoch: 231, Train MSELoss: 0.00041, Val. MSELoss: 0.00028
Epoch: 232, Train MSELoss: 0.00040, Val. MSELoss: 0.00023
Epoch: 233, Train MSELoss: 0.00040, Val. MSELoss: 0.00029
Epoch: 234, Train MSELoss: 0.00040, Val. MSELoss: 0.00023
Epoch: 235, Train MSELoss: 0.00040, Val. MSELoss: 0.00027
Epoch: 236, Train MSELoss: 0.00040, Val. MSELoss: 0.00028
Epoch: 237, Train MSELoss: 0.00040, Val. MSELoss: 0.00030
Early stopping at epoch 236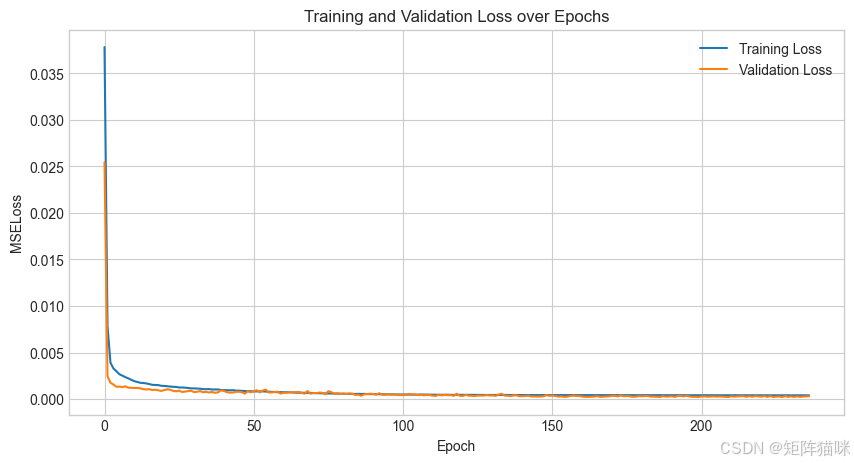
6. 模型预测
6.1 构建预测函数
接下来,我们通过构建 predict 函数来对模型中的数据进行预测。
python
def predict(model, iterator):
    model.eval()
    targets = []
    predictions = []

    with torch.no_grad():
        for batch_idx, (data, target) in enumerate(iterable=iterator):
            output = model(data)
            targets.append(target)
            predictions.append(output)

    targets = torch.cat(targets)
    predictions = torch.cat(predictions, dim=0)
    return predictions, targets
这个函数的主要作用是使用给定的模型对输入的数据迭代器 iterator 中的数据进行预测,并收集相应的预测结果和真实目标值,最后返回整理好的预测值和目标值。它常用于在训练好模型之后,对测试集或者验证集等数据进行预测的场景。具体来说:
model.eval() 这行代码将模型设置为评估模式。在很多深度学习模型中,尤其是包含像 dropout、batch normalization 等在训练阶段和评估阶段行为不同的层时,调用 eval() 方法可以确保模型在预测时使用正确的计算方式。例如,在训练阶段,dropout 会按照一定概率随机丢弃神经元,而在评估阶段则不会进行这种随机丢弃操作,以保证预测结果的稳定性和确定性。
with torch.no_grad(): 不需要计算梯度。因为在预测阶段,我们并不需要进行反向传播来更新模型的参数,关闭梯度计算可以节省内存并提高计算效率。
targets = torch.cat(targets) 和 predictions = torch.cat(predictions, dim=0):在遍历完所有批次后,使用 torch.cat 函数将收集到的 targets 列表中的张量按照维度进行拼接,使其成为一个连续的张量,方便后续对整体的预测结果和目标值进行统一的分析和处理。对于 predictions 也是同样的操作,指定了拼接维度为 0,通常在按照批次维度拼接预测结果张量时会这样做,确保拼接后的张量结构符合预期,能正确反映所有批次的预测情况。
7. 模型验证
使用 torch.load() 加载 .pth 文件,并通过 load_state_dict() 将权重映射到模型
python
ts_model.load_state_dict(state_dict=torch.load('best_model.pth')) # 加载权重7.1 验证集预测
python
val_pred, val_true = predict(ts_model, valid_loader)7.2 验证集评估
7.2.1 回归拟合图
通过seaborn库中regplot函数绘制回归拟合图,我们可以清晰地看到模型预测值与实际数据点之间的吻合程度,即拟合度。
python
plt.figure(figsize=(5, 5), dpi=100)
sns.regplot(x=val_true.numpy(), y=val_pred.numpy(), scatter=True, marker="*", color='orange',line_kws={'color': 'red'})
plt.show()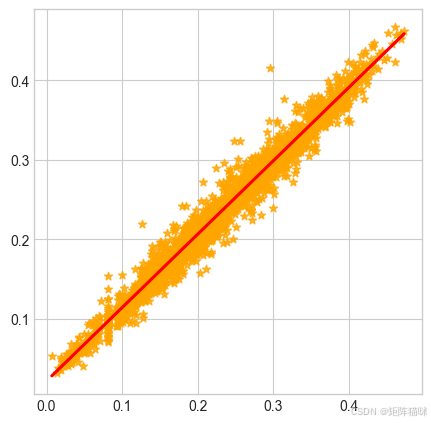
7.2.2 评估指标
torchmetrics库提供了各种损失函数,我们可以直接用来计算张量的损失,而无需转换成numpy数组形式。
python
mae = mean_absolute_error(preds=val_pred, target=val_true)
print(f"Mean Absolute Error: {mae:.5f}")

mape = mean_absolute_percentage_error(preds=val_pred, target=val_true)
print(f"Mean Absolute Percentage Error: {mape * 100:.4f}%")

mse = mean_squared_error(preds=val_pred, target=val_true)
print(f"Mean Squared Error: {mse:.4f}")

msle = mean_squared_log_error(preds=val_pred, target=val_true)
print(f"Mean Squared Log Error: {msle:.4f}")

r2 = r2_score(preds=val_pred, target=val_true)
print(f"R²: {r2:.4f}")
python
Mean Absolute Error: 0.01120
Mean Absolute Percentage Error: 7.2963%
Mean Squared Error: 0.0002
Mean Squared Log Error: 0.0001
R²: 0.9711
8. 模型测试
8.1 测试集预测
python
test_pred, test_true = predict(ts_model, test_loader)8.2 测试集评估
8.2.1 回归拟合图
通过seaborn库中regplot函数绘制回归拟合图,我们可以清晰地看到模型预测值与实际数据点之间的吻合程度,即拟合度。
python
plt.figure(figsize=(5, 5), dpi=100)
sns.regplot(x=test_true.numpy(), y=test_pred.numpy(), scatter=True, marker="*", color='orange',line_kws={'color': 'red'})
plt.show()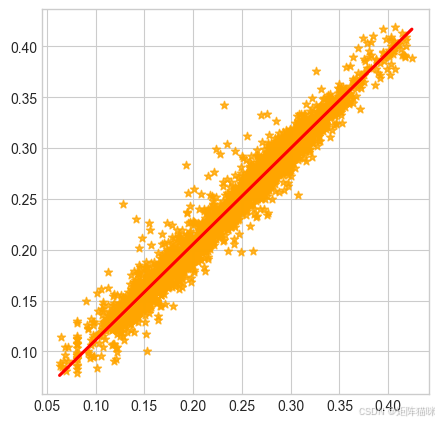
8.2.2 评估指标
torchmetrics库提供了各种损失函数,我们可以直接用来计算张量的损失,而无需转换成numpy数组形式。
python
mae = mean_absolute_error(preds=test_pred, target=test_true)
print(f"Mean Absolute Error: {mae:.5f}")

mape = mean_absolute_percentage_error(preds=test_pred, target=test_true)
print(f"Mean Absolute Percentage Error: {mape * 100:.4f}%")

mse = mean_squared_error(preds=test_pred, target=test_true)
print(f"Mean Squared Error: {mse:.4f}")

msle = mean_squared_log_error(preds=test_pred, target=test_true)
print(f"Mean Squared Log Error: {msle:.4f}")

r2 = r2_score(preds=test_pred, target=test_true)
print(f"R²: {r2:.4f}")
python
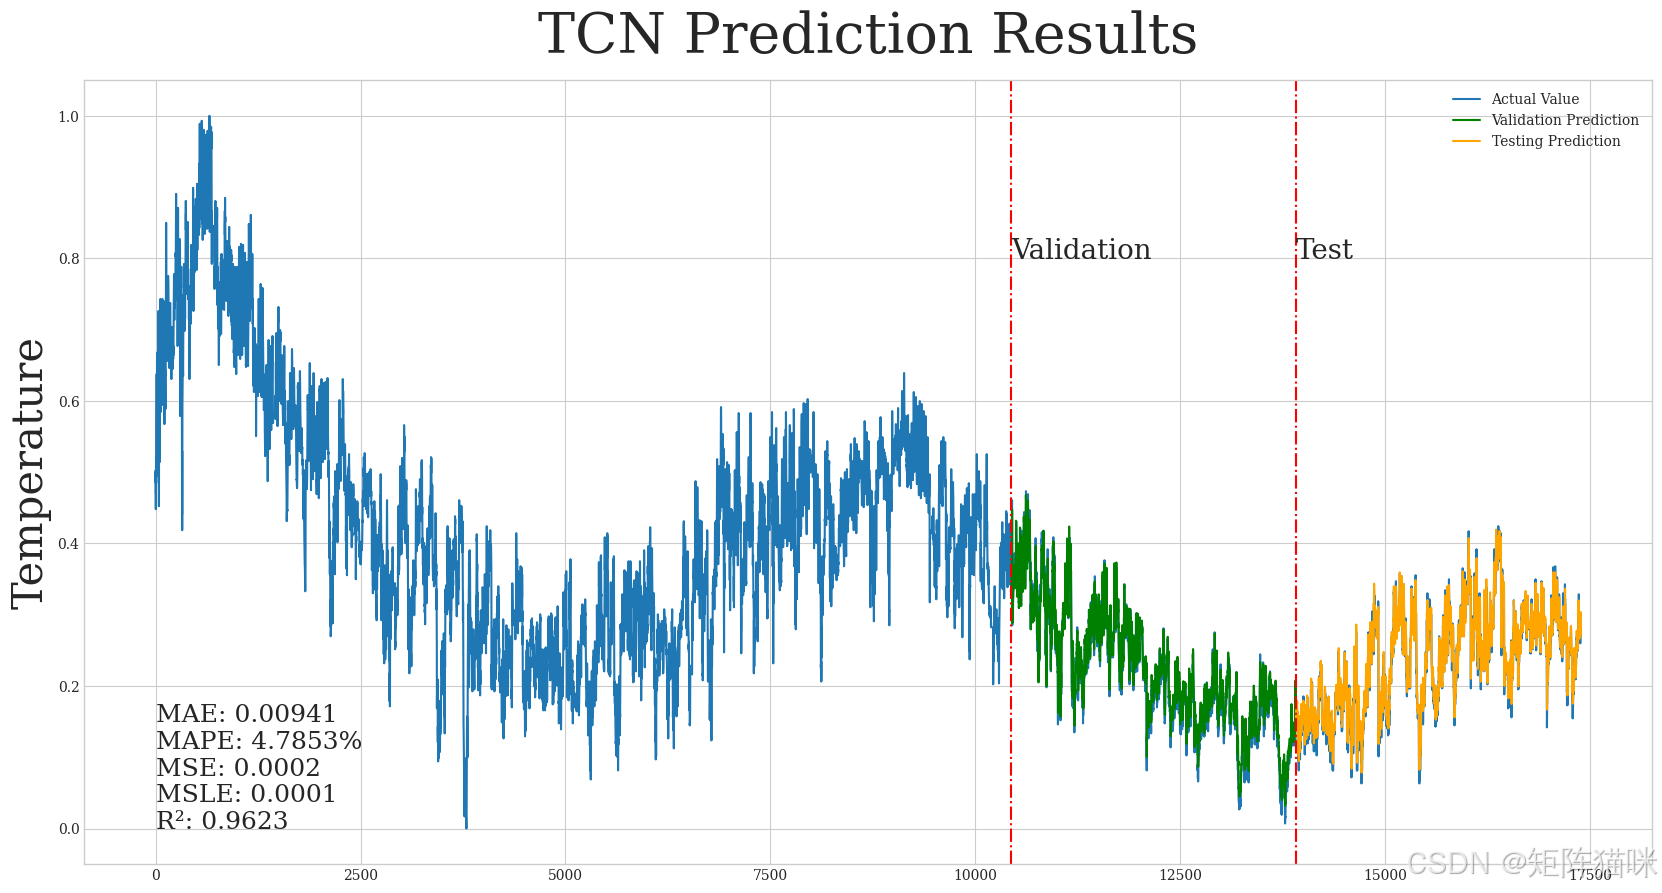
Mean Absolute Error: 0.00941
Mean Absolute Percentage Error: 4.7853%
Mean Squared Error: 0.0002
Mean Squared Log Error: 0.0001
R²: 0.9623
预测可视化
在 matplotlib 库中,我们可以直接使用张量数据来绘制图表
python
plt.figure(figsize=(20, 5))
plt.plot(torch.cat(tensors=(val_true, test_true), dim=0), label='Actual Value')
plt.plot(torch.cat(tensors=(val_pred, test_pred), dim=0), label='Prediction Value')
plt.axvline(len(val_pred), color='red', linestyle='-.')
plt.text(0, 0.4, 'Validation', fontsize=18)
plt.text(len(val_pred), 0.4, 'Test', fontsize=18)
plt.ylabel('Temperature', fontsize=18)
plt.title('Prediction Results', fontsize=24)
plt.legend()
plt.grid(True)
plt.show()
python
n_idx = len(y_tensor)
val_size = len(val_idx)
test_size = len(test_idx)

x_plot = list(range(len(dataset)))
y_plot = y_tensor

x_val_line = x_plot[n_idx - val_size - test_size]
x_test_line = x_plot[n_idx - test_size]
python
plt.style.use('_mpl-gallery')
plt.figure(figsize=(16, 8))
plt.rcParams['font.family'] = 'serif'
plt.title(f'{ts_model.__class__.__name__} Prediction Results', fontsize=40, pad=20)
plt.plot(x_plot, y_plot, label='Actual Value')
plt.plot(val_idx, val_pred, label='Validation Prediction', color='green')
plt.plot(test_idx, test_pred, label='Testing Prediction', color='orange')
plt.axvline(x_val_line, color='red', linestyle='-.')
plt.axvline(x_test_line, color='red', linestyle='-.')
plt.text(x_val_line, 0.8, 'Validation', fontsize=20)
plt.text(x_test_line, 0.8, 'Test', fontsize=20)
plt.ylabel('Temperature', fontsize=30)
plt.legend()
plt.show()