一、鸢尾花数据训练模型
-
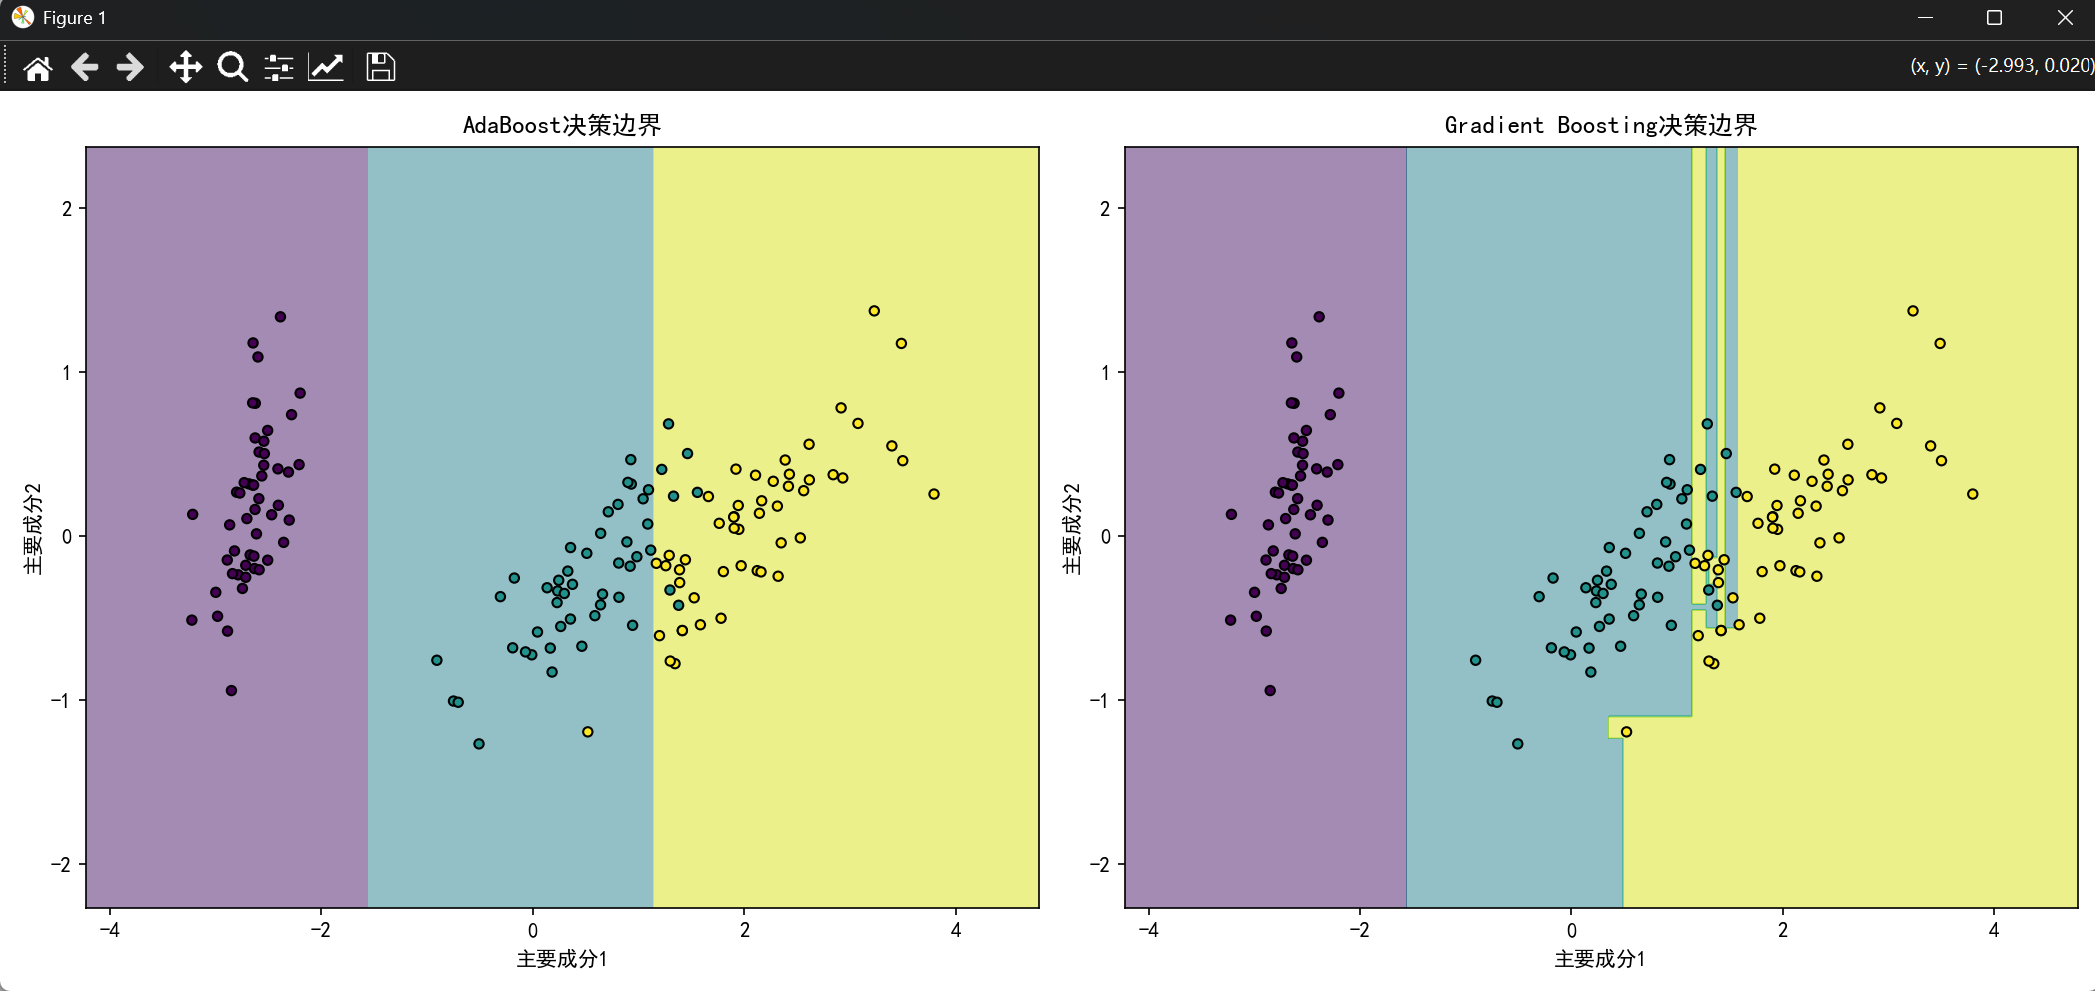
使用鸢尾花数据分别训练集成模型:AdaBoost模型,Gradient Boosting模型
-
对别两个集成模型的准确率以及报告
-
两个模型的预测结果进行可视化 需要进行降维处理,两个图像显示在同一个坐标系中
代码展示:
python
from sklearn.datasets import load_iris
import numpy as np
import pandas as pd
import matplotlib.pyplot as plt
from sklearn.decomposition import PCA
from sklearn.metrics import accuracy_score
from sklearn.model_selection import train_test_split
from sklearn.ensemble import BaggingClassifier, RandomForestClassifier,AdaBoostClassifier,GradientBoostingClassifier
from sklearn.tree import DecisionTreeClassifier

plt.rcParams["font.sans-serif"] = ["SimHei"]
plt.rcParams["axes.unicode_minus"] = False

df = load_iris()

X = df.data
y = df.target

x_train,x_test,y_train,y_test = train_test_split(X,y,test_size=0.3,random_state=42)

adaboost = AdaBoostClassifier(
    estimator=DecisionTreeClassifier(max_depth=1),
    n_estimators=100,
    learning_rate=1.0,
    random_state=42
)

gradient = GradientBoostingClassifier(
    n_estimators=100,
    learning_rate=1.0,
    max_depth=3,
    random_state=42
)

pca = PCA(n_components=2)

pca_x = pca.fit_transform(X)

x_train_pca,x_test_pca,y_train_pca,y_test_pca = train_test_split(pca_x,y,test_size=0.3,random_state=42)

rf_pca1 = AdaBoostClassifier(n_estimators=100,random_state=42)
rf_pca2 = GradientBoostingClassifier(n_estimators=100,random_state=42)
rf_pca1.fit(x_train_pca,y_train_pca)
rf_pca2.fit(x_train_pca,y_train_pca)

x_min,x_max = pca_x[:,0].min()-1,pca_x[:,0].max()+1
y_min,y_max = pca_x[:,1].min()-1,pca_x[:,1].max()+1

xx,yy = np.meshgrid(np.arange(x_min,x_max,0.01),
                    np.arange(y_min,y_max,0.01))

z1 = rf_pca1.predict(np.c_[xx.ravel(),yy.ravel()])
z2 = rf_pca2.predict(np.c_[xx.ravel(),yy.ravel()])

plt.figure(figsize=(14,6))

plt.subplot(121)
z1 = z1.reshape(xx.shape)
plt.contourf(xx,yy,z1,alpha=0.5)

plt.scatter(pca_x[:,0],pca_x[:,1],
            s=20,
            c=y,
            edgecolors="k")

plt.title("AdaBoost决策边界")
plt.xlabel("主要成分1")
plt.ylabel("主要成分2")


plt.subplot(122)
z2 = z2.reshape(xx.shape)
plt.contourf(xx,yy,z2,alpha=0.5)

plt.scatter(pca_x[:,0],pca_x[:,1],
            s=20,
            c=y,
            edgecolors="k")

plt.title("Gradient Boosting决策边界")
plt.xlabel("主要成分1")
plt.ylabel("主要成分2")

plt.tight_layout()
plt.show()
结果展示:
二、随机森林鸢尾花分类
基础应用 - 鸢尾花分类
任务目标:
使用随机森林对鸢尾花数据集进行分类,并分析特征重要性
数据集:
sklearn.datasets.load_iris()
要求步骤:
- 加载鸢尾花数据集并划分训练集/测试集(70%/30%)
- 创建随机森林分类器(设置n_estimators=100, max_depth=3)
- 训练模型并在测试集上评估准确率
- 输出分类报告和混淆矩阵
- 可视化特征重要性
- (选做)尝试调整n_estimators和max_depth观察准确率变化
代码展示:
python
import numpy as np
from sklearn.datasets import load_iris
from sklearn.decomposition import PCA
from sklearn.ensemble import RandomForestClassifier
from sklearn.metrics import accuracy_score, classification_report, confusion_matrix, ConfusionMatrixDisplay
from sklearn.model_selection import train_test_split
import matplotlib.pyplot as plt
plt.rcParams["font.sans-serif"] = ["SimHei"]
plt.rcParams["axes.unicode_minus"] = False
iris = load_iris()
X = iris.data
y = iris.target
x_train,x_test,y_train,y_test = train_test_split(X,y,test_size=0.3,random_state=42)
random = RandomForestClassifier(
n_estimators=100,
max_depth=3
)
random.fit(x_train,y_train)
y_pred = random.predict(x_test)
print("Random的准确率:",accuracy_score(y_test,y_pred))
print("分类报告:")
print(classification_report(y_test,y_pred,target_names=iris.target_names))
cm = confusion_matrix(y_test,y_pred)
disp = ConfusionMatrixDisplay(confusion_matrix=cm,display_labels=iris.target_names)
disp.plot(cmap=plt.cm.Blues)
plt.title("随机森林分类器的混淆矩阵")
plt.show()
print("特征的重要性:")
for i,j in zip(iris.feature_names,random.feature_importances_):
print(f"{i}:{j:.4f}")
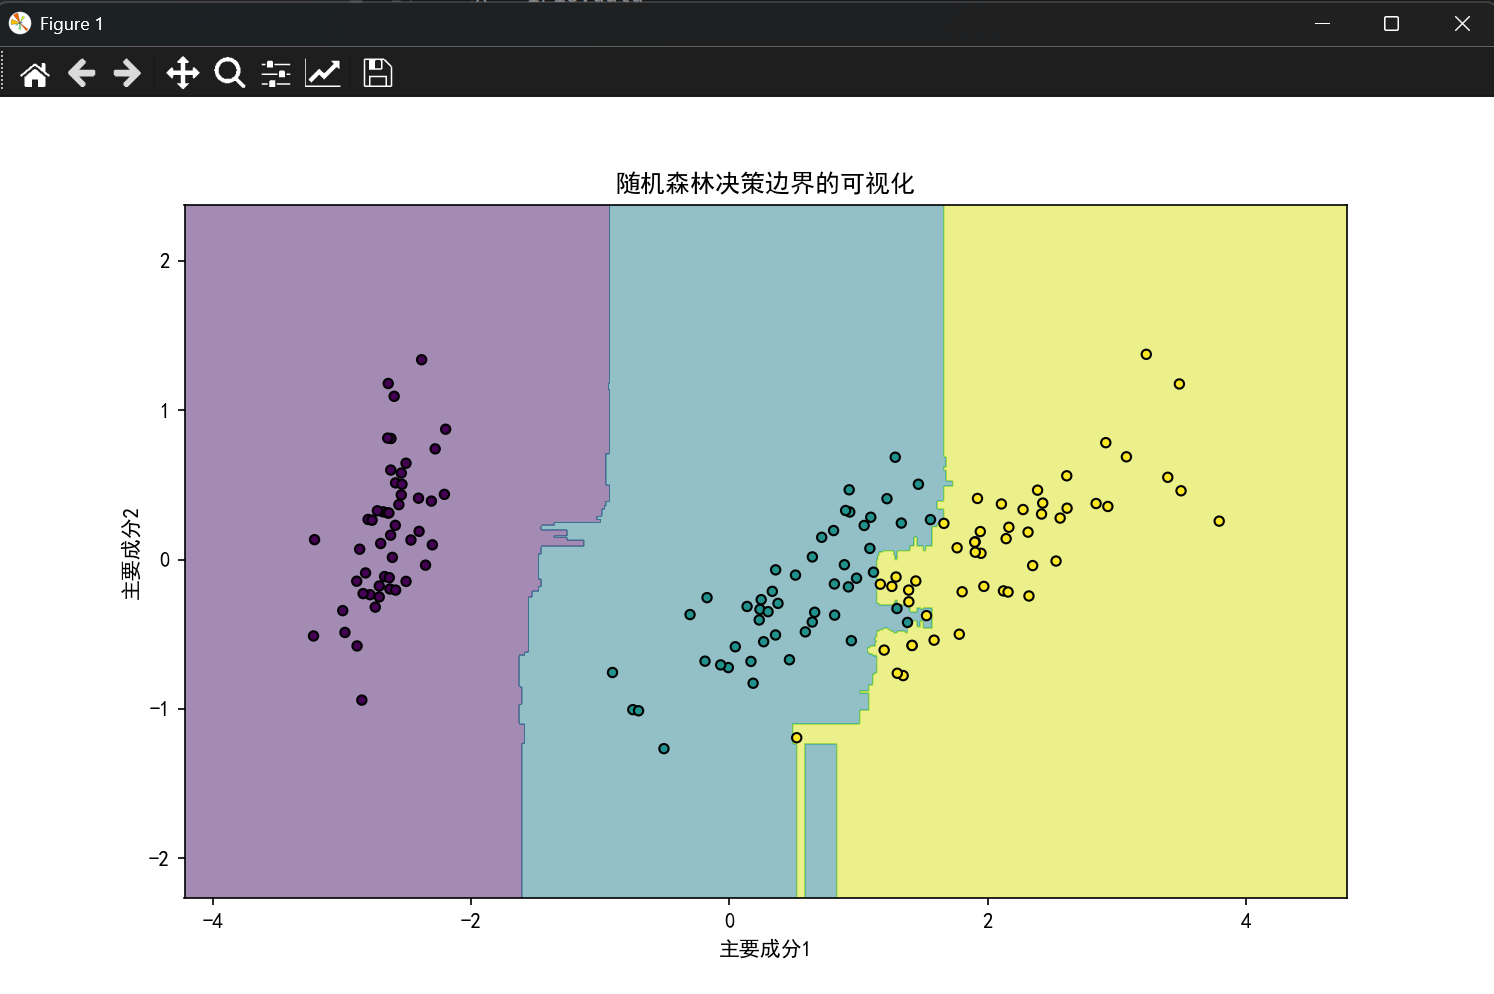
pca = PCA(n_components=2)
pca_x = pca.fit_transform(X)
x_train_pca,x_test_pca,y_train_pca,y_test_pca = train_test_split(pca_x,y,test_size=0.3,random_state=42)
rf_pca = RandomForestClassifier(n_estimators=100,random_state=42)
rf_pca.fit(x_train_pca,y_train_pca)
x_min,x_max = pca_x[:,0].min()-1,pca_x[:,0].max()+1
y_min,y_max = pca_x[:,1].min()-1,pca_x[:,1].max()+1
xx,yy = np.meshgrid(np.arange(x_min,x_max,0.01),
np.arange(y_min,y_max,0.01))
z = rf_pca.predict(np.c_[xx.ravel(),yy.ravel()])
plt.figure(figsize=(10,6))
z = z.reshape(xx.shape)
plt.contourf(xx,yy,z,alpha=0.5)
plt.scatter(pca_x[:,0],pca_x[:,1],
s=20,
c=y,
edgecolors="k")
plt.title("随机森林决策边界的可视化")
plt.xlabel("主要成分1")
plt.ylabel("主要成分2")
plt.show()结果展示:
python
Random的准确率: 1.0
分类报告:
              precision    recall  f1-score   support

      setosa       1.00      1.00      1.00        19
  versicolor       1.00      1.00      1.00        13
   virginica       1.00      1.00      1.00        13

    accuracy                           1.00        45
   macro avg       1.00      1.00      1.00        45
weighted avg       1.00      1.00      1.00        45

特征的重要性:
sepal length (cm):0.0745
sepal width (cm):0.0142
petal length (cm):0.4432
petal width (cm):0.4681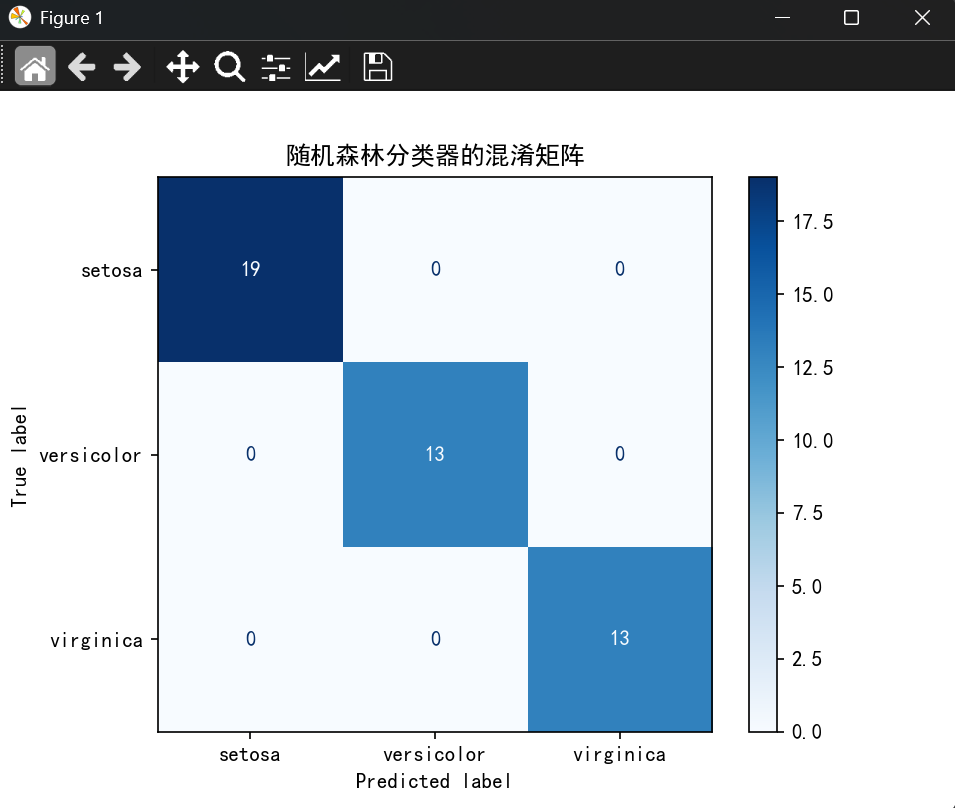
三、信用卡欺诈检测
信用卡欺诈检测
任务目标:
使用随机森林处理类别不平衡的信用卡欺诈检测问题
数据集:
Kaggle信用卡欺诈数据集【Credit Card Fraud Detection】
要求步骤:
- 加载信用卡交易数据(注意数据高度不平衡)
- 标准化Amount特征,Time特征可删除
- 使用分层抽样划分训练集/测试集
- 创建随机森林分类器(class_weight='balanced')
- 评估模型(使用精确率、召回率、F1、AUC-ROC)
- (选做)使用SMOTE过采样处理类别不平衡
代码展示:
python
import pandas as pd
from sklearn.ensemble import RandomForestClassifier
from sklearn.metrics import accuracy_score, classification_report, confusion_matrix, roc_auc_score, roc_curve
from sklearn.model_selection import train_test_split
from sklearn.preprocessing import StandardScaler
import matplotlib.pyplot as plt
import numpy as np
df = pd.read_csv("./data/creditcard.csv",encoding="utf-8")
df = df.drop("Time",axis=1)
transfer = StandardScaler()
df["Amount"] = transfer.fit_transform(df[["Amount"]])
X = df.drop("Class",axis=1)
y = df["Class"]
x_train,x_test,y_train,y_test = train_test_split(X,y,test_size=0.3,random_state=42,stratify=y)
rf = RandomForestClassifier(
n_estimators=100,
class_weight='balanced',
random_state=42
)
rf.fit(x_train,y_train)
y_pred = rf.predict(x_test)
y_prob = rf.predict_proba(x_test)[:,1]
print("分类报告:")
print(classification_report(y_test,y_pred,target_names=["0","1"]))
cm = confusion_matrix(y_test,y_pred)
tn,fp,fn,tp = cm.ravel()
print("精确率:",tp/(tp+fp))
print("召回率:",tp/(tp+fn))
print("F1-score",(2*tp)/(2*tp+fn+fp))
print("AUC指标:",roc_auc_score(y_test,y_pred))
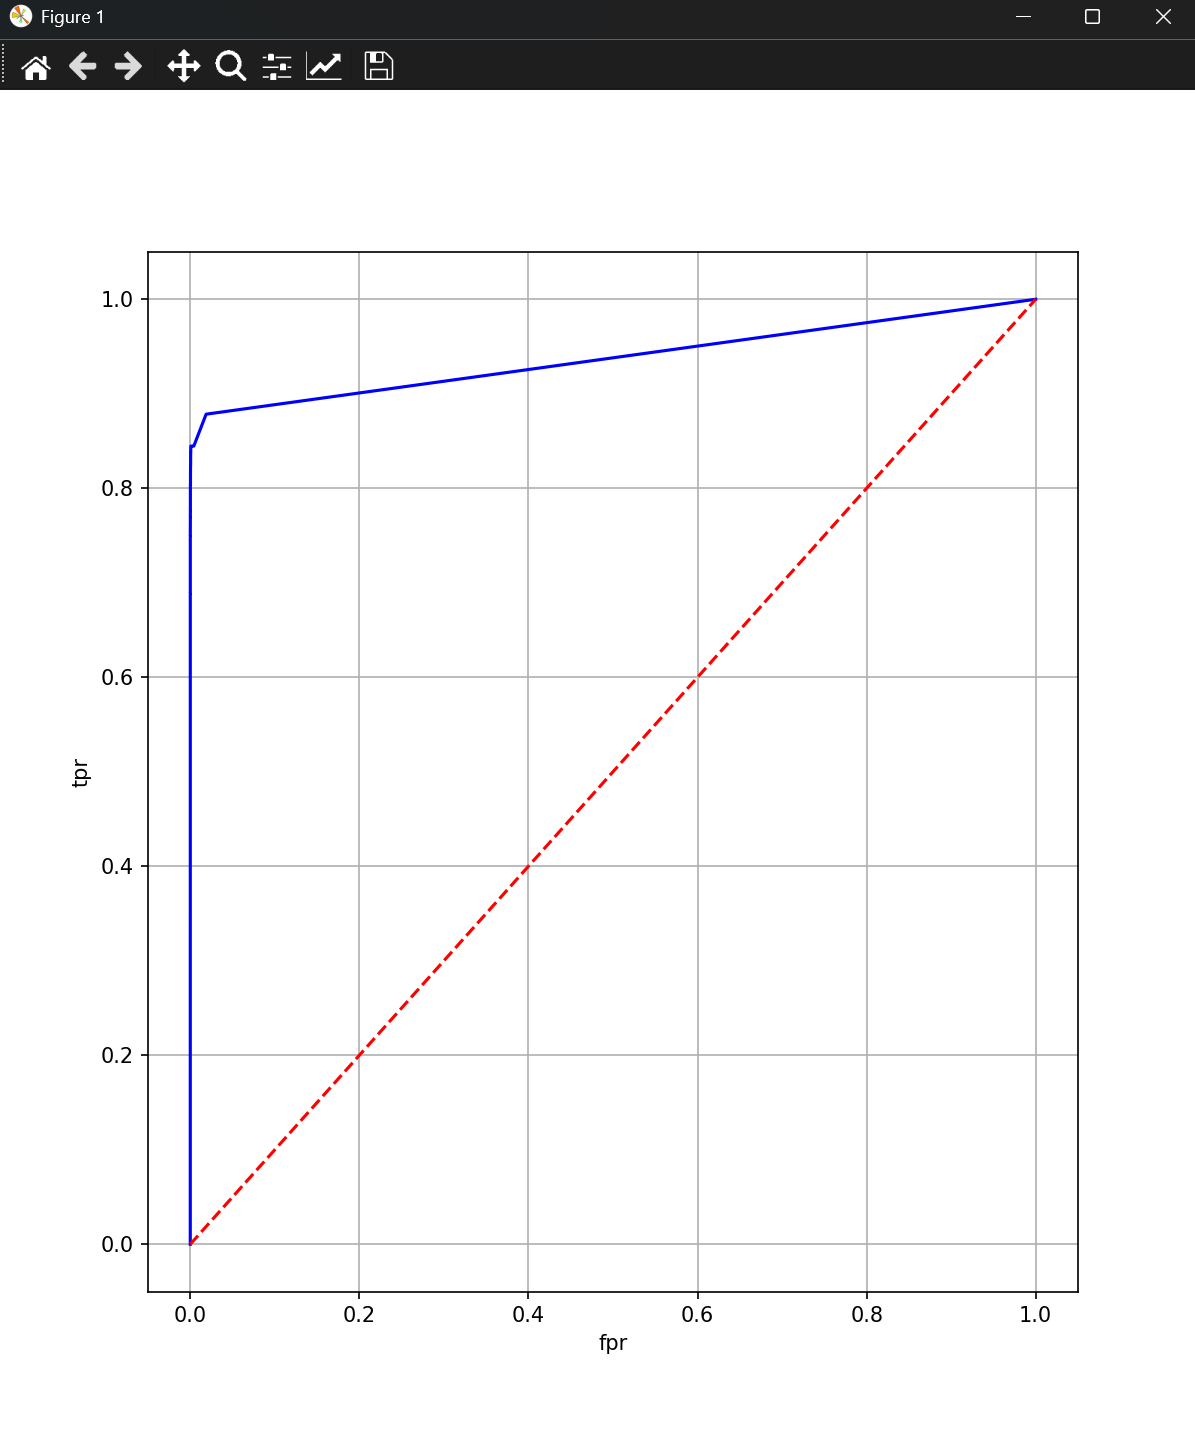
fpr,tpr,_ = roc_curve(y_test,y_prob)
plt.figure(figsize=(8,9))
plt.plot(fpr,tpr,color="b")
plt.plot([0,1],[0,1],color="r",linestyle="--")
plt.xlabel("fpr")
plt.ylabel("tpr")
plt.grid()
plt.show()结果展示:
python
分类报告:
              precision    recall  f1-score   support

           0       1.00      1.00      1.00     85295
           1       0.97      0.70      0.82       148

    accuracy                           1.00     85443
   macro avg       0.99      0.85      0.91     85443
weighted avg       1.00      1.00      1.00     85443

精确率: 0.9719626168224299
召回率: 0.7027027027027027
F1-score 0.8156862745098039
AUC指标: 0.8513337653263792