文章目录
介绍
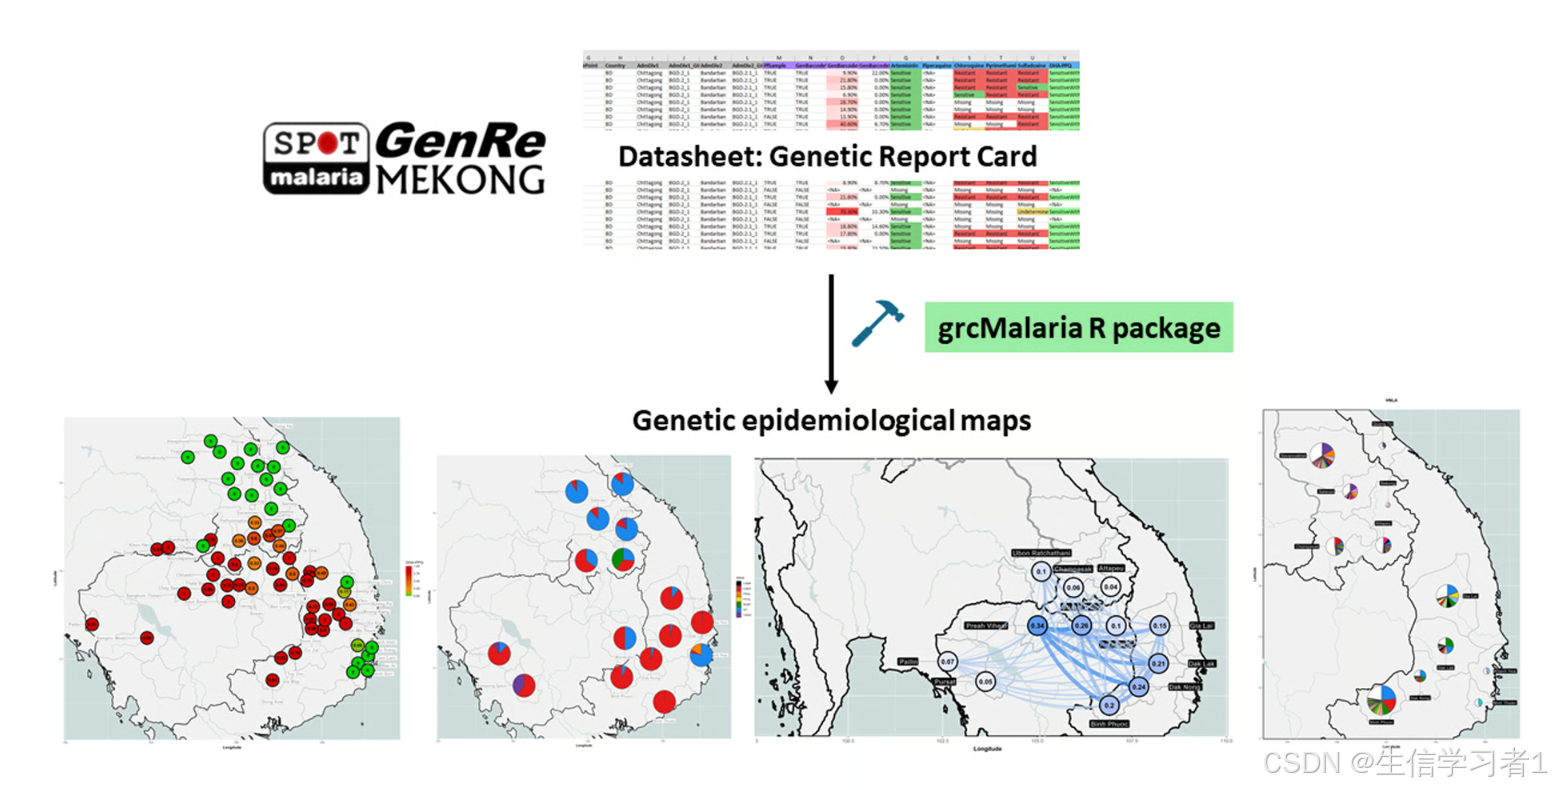
grcMalaria 是一个易于使用的、开源的 R 软件包,旨在使遗传流行病学分析任务变得易于操作。
该软件包能够将来自"SpotMalaria 遗传报告卡"(GRC)中提取的疟原虫遗传信息转化为直观的流行率、多样性、亲缘关系等地理图谱。该软件库还能够识别流行毒株、分析药物耐药性特征以及绘制传播路径。
grcMalaria is a user-friendly, open-source R package, designed to make genetic epidemiology analysis tasks accessible.
The package facilitates the translation of genetic information derived from malaria parasites from SpotMalaria Genetic Report Cards (GRC) into intuitive geographical maps of prevalence, diversity, relatedness. This software library is also capable of identifying circulating strains, characterising drug resistance profiles, and mapping spread.
代码
https://genremekong.org/tools/grcmalaria-guide
r
## Install devtools and rgeos
install.packages("devtools")
install.packages("rgeos")
##Install grcMalariaGeodata from Github
devtools::install_github("malariagen/grcMalariaGeodata")
## Require these dependencies to install 'malariagen/grcMalaria'
if (!requireNamespace("BiocManager", quietly = TRUE))
install.packages("BiocManager")
BiocManager::install("pcaMethods")
# Load libraries
library(grcMalariaGeodata)
library(grcMalaria)
# Check package versions grcMalaria and grcMalariaGeodata
# Latest version grcMalariaGeodata: 0.4.0
# Latest stable version of grcMalaria: 2.0.0
packageVersion('grcMalaria')
packageVersion('grcMalariaGeodata')
# Load data file
# Change the path to where your file is located before running the code
Data <- loadGrc("D:/.../GRC.xlsx",
sheet = "GenRe-Mekong",
species = "Pf", version = "1.4")
ctx <- initializeContext(Data,
dir="D:/...", #Change the path to where you want output file to be
minSnpTypability=0.8, minSampleTypability=0.75)
## Select sample set to work on.
# To select samples from 1 field (1 column in the GRC)
selectSampleSet(ctx, sampleSetName="EBKK", select=list(
list(field="Country", values=c("VN", "KH", "LA")) ))
# To select samples from 2 fields
selectSampleSet(ctx, sampleSetName="Laos", select=list(
list(field="TimePoint", values=c("D00H00","-")),
list(field="Study", values=c("1208-PF-LA-CMPE-GENRE")) ))
# To select samples from 3 fields
selectSampleSet(ctx, sampleSetName="SouthLA_2017", select=list(
list(field="Country", values="LA"),
list(field="AdmDiv1", values=c("Attapeu", "Champasak")),
list(field="Year", values=c("2017", "2018")) ))
# To select samples from more fields, follow the example above to add more -> list(field=" ", values = " ")
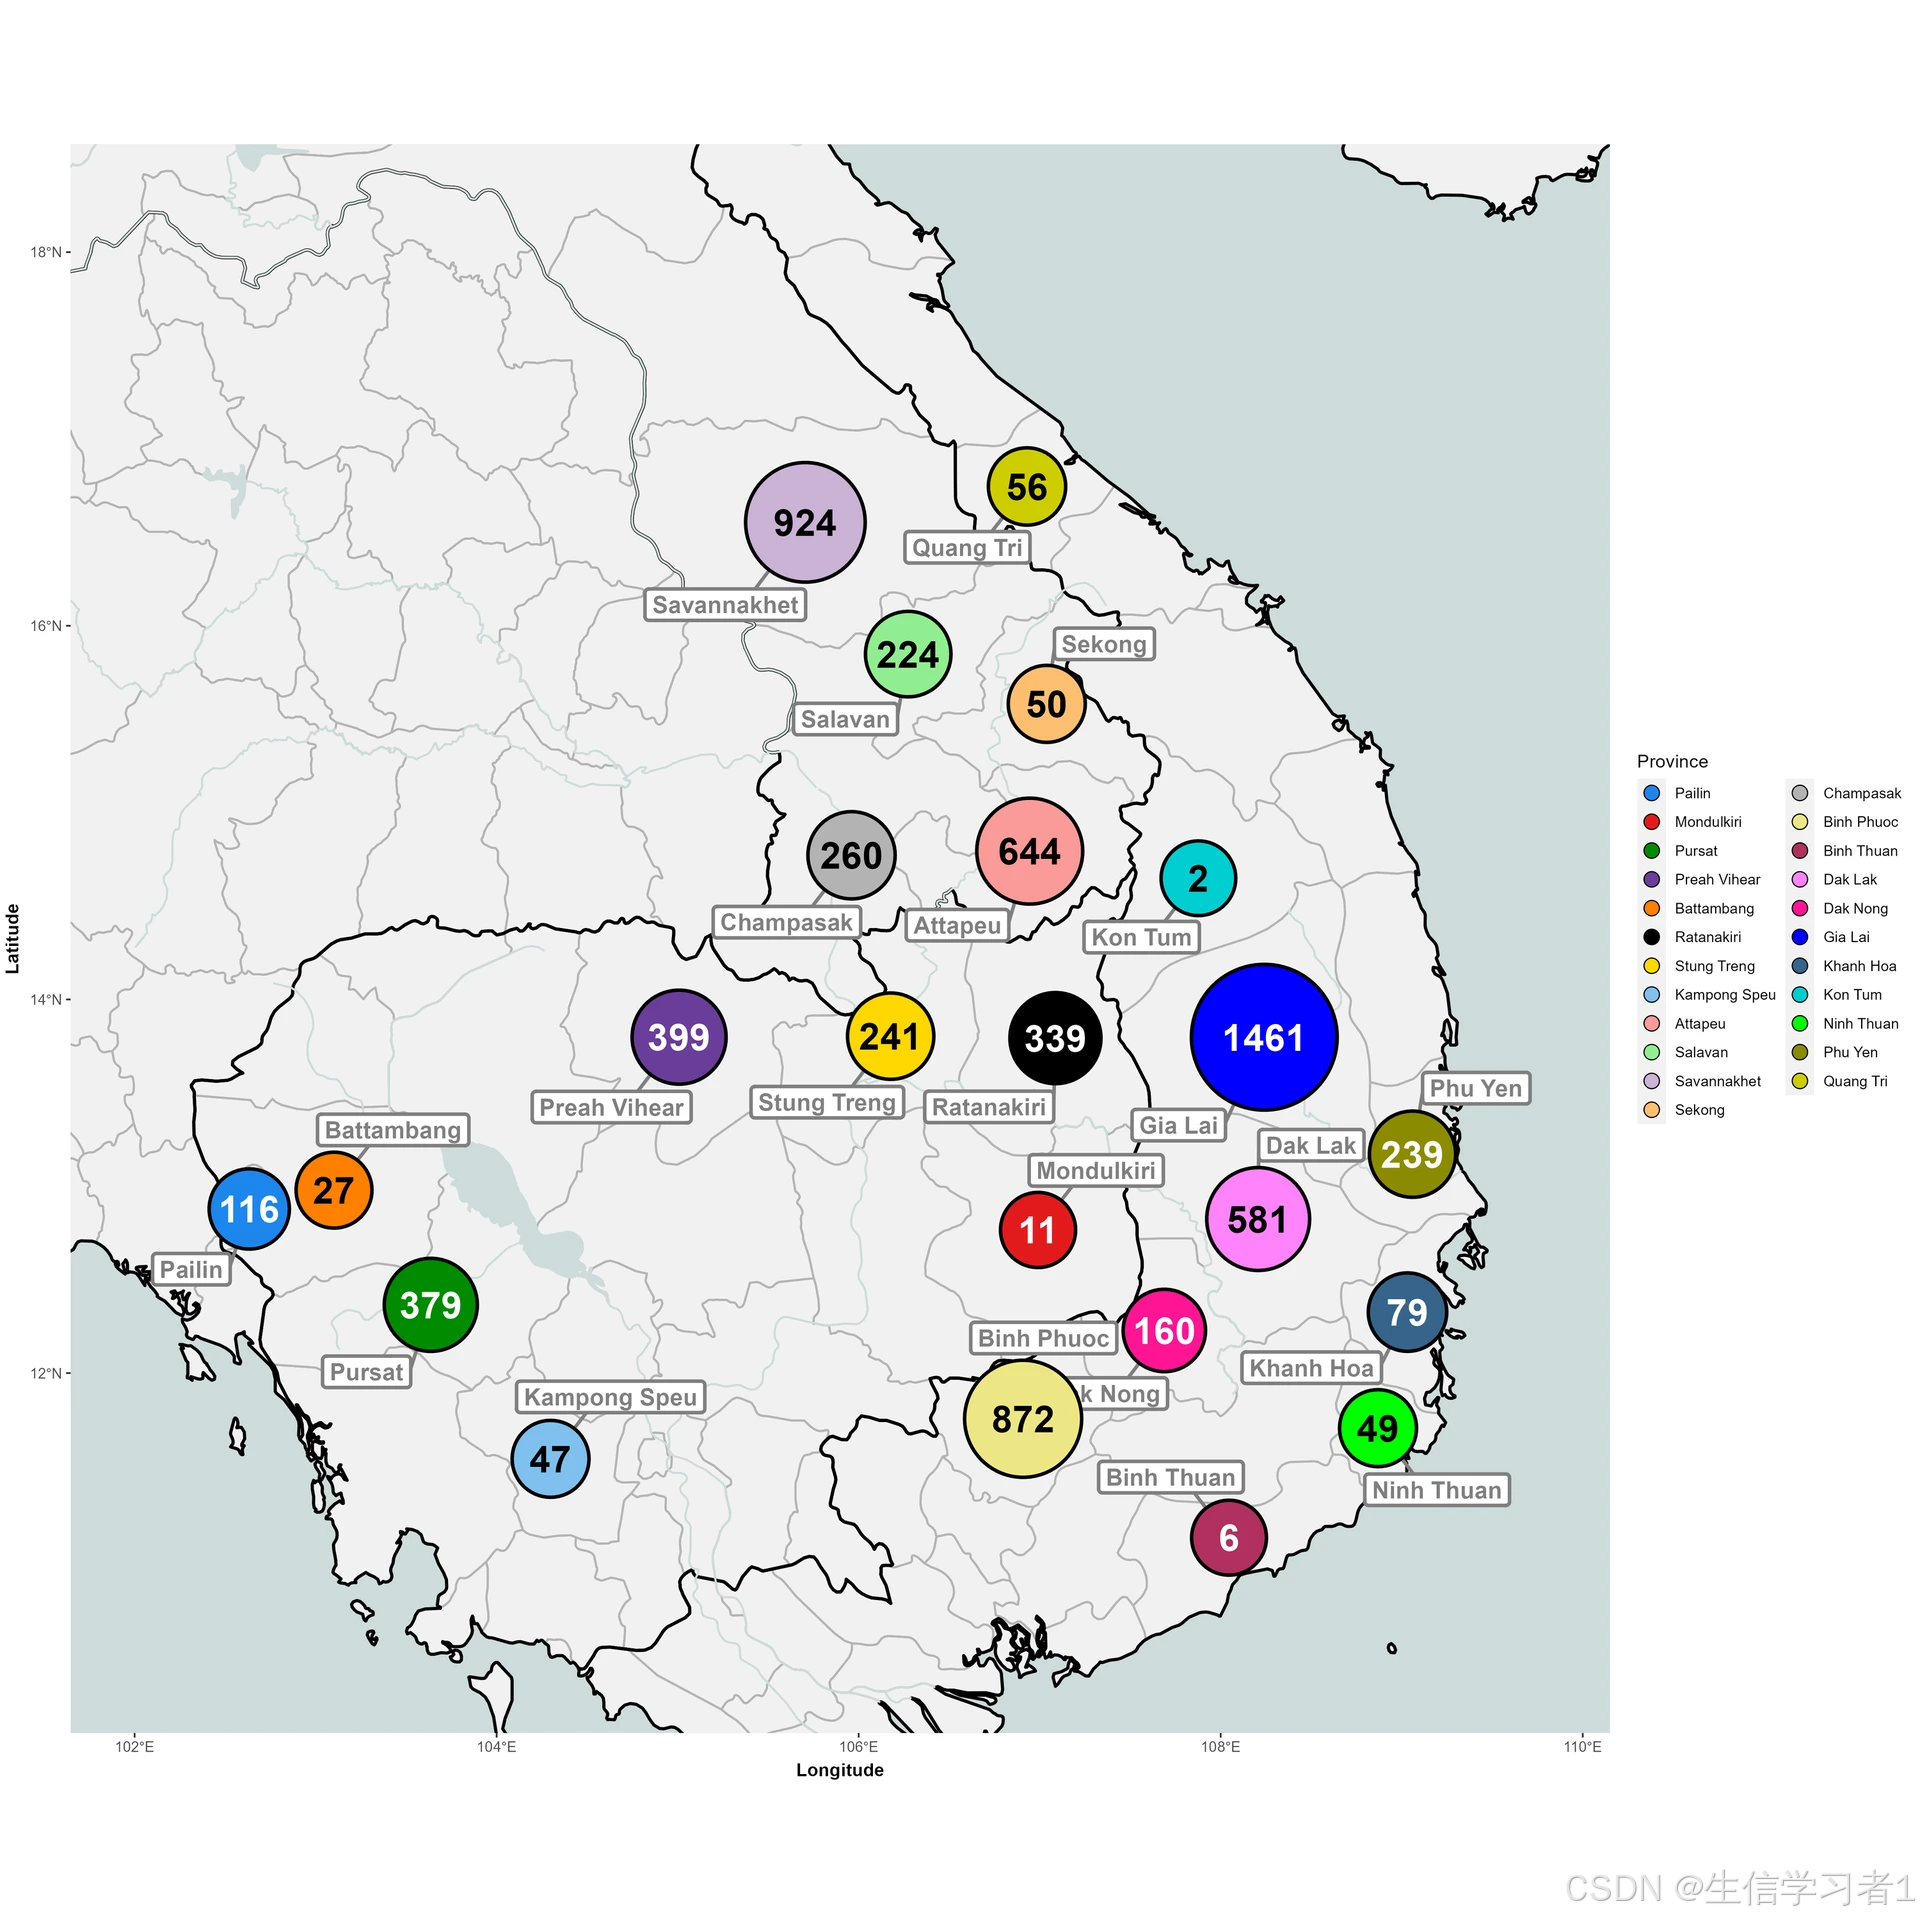
mapSampleCounts (ctx, sampleSet="EBKK", timePeriods=NULL,
aggregate=c("Province","District"),
minAggregateCount=1,
markerSize=c(10,40),
colourBy="Province",
showNames=TRUE,
...)
r
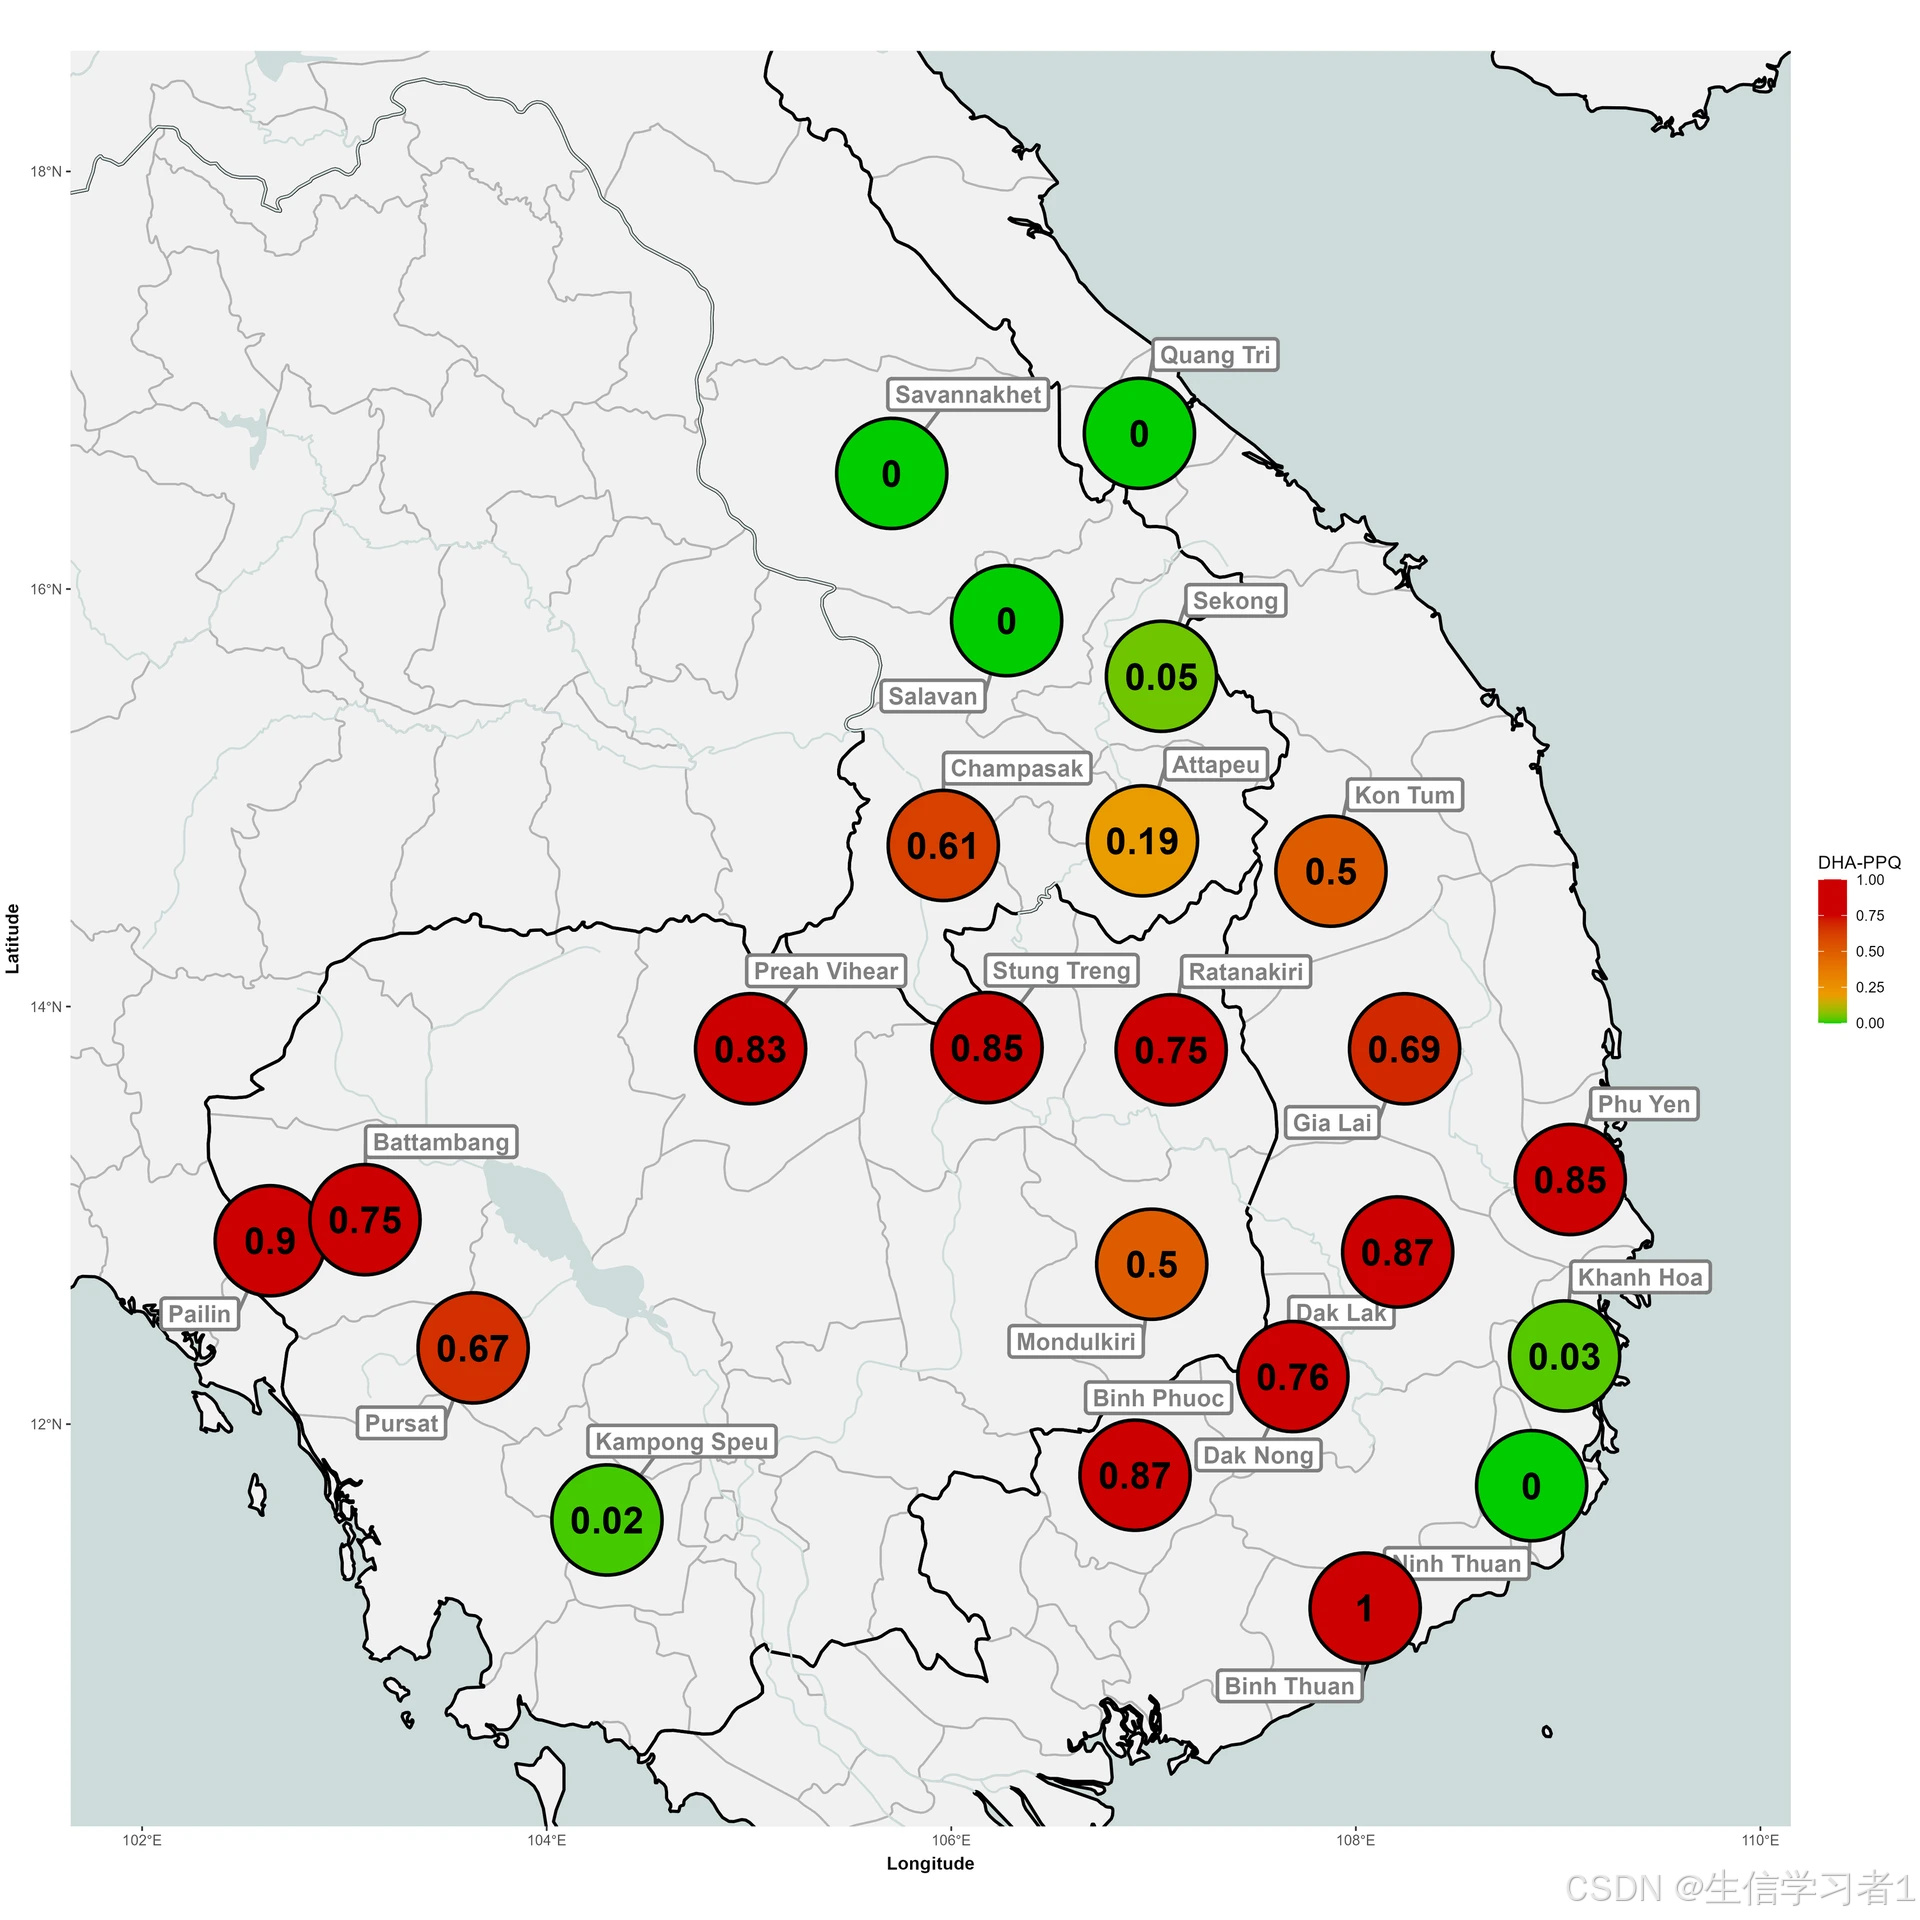
mapDrugResistancePrevalence (ctx, sampleSet="EBKK", timePeriods=NULL,
                   drugs="ALL", aggregate=c("Province","District"),
                   minAggregateCount=10, showNames=TRUE, markerSize=16,
                   ...)