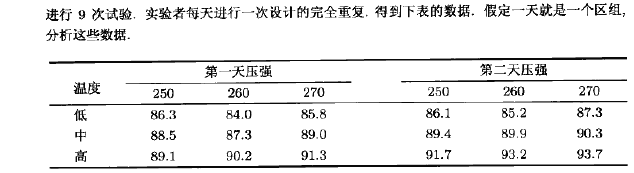
dataframe<-data.frame(
productive=c(86.3,88.5,89.1,84.0,87.3,90.2,85.8,89.0,91.3,86.1,89.4,91.7,85.2,89.9,93.2,87.3,90.3,93.7),
Temperature=gl(3,6,18),
pressure=gl(3,3,18),
Time=gl(2,9,18))
summary (dataframe)
dataframe.aov2 <- aov(productive~Error(Time)+Temperature*pressure,data=dataframe)
summary (dataframe.aov2)
> summary (dataframe.aov2)
Error: Time
Df Sum Sq Mean Sq
Temperature 1 13.01 13.01
Error: Within
Df Sum Sq Mean Sq F value Pr(>F)
Temperature 2 4.07 2.036 0.227 0.800
pressure 2 2.46 1.230 0.137 0.873
Residuals 12 107.53 8.961
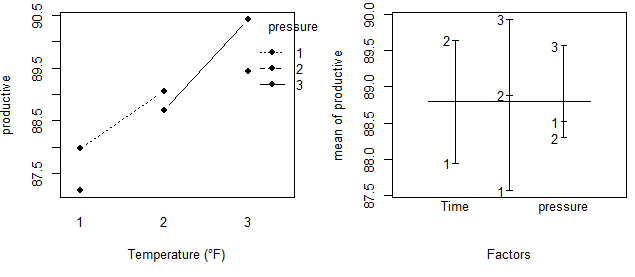
with(dataframe,interaction.plot(Temperature,pressure,productive,type="b",pch=19,fixed=T,xlab="Temperature (°F)",ylab=" productive "))
plot.design(productive~Time+Temperature*pressure,data=dataframe)
fit <-lm(productive~Time+Temperature*pressure,data=dataframe)
anova(fit)
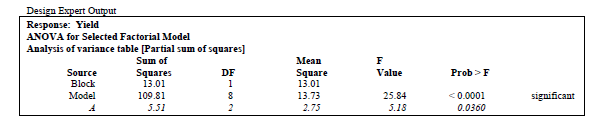
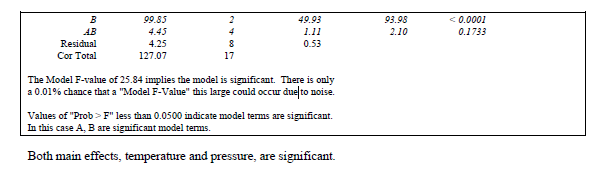
> anova(fit)
Analysis of Variance Table
Response: productive
Df Sum Sq Mean Sq F value Pr(>F)
Time 1 13.005 13.0050 1.4513 0.2515
Temperature 2 4.071 2.0356 0.2272 0.8001
pressure 2 2.460 1.2300 0.1373 0.8731
Residuals 12 107.533 8.9611
summary(fit)
> summary(fit)
Call:
lm(formula = productive ~ Time + Temperature * pressure, data = dataframe)
Residuals:
Min 1Q Median 3Q Max
-4.2333 -2.5917 0.3167 2.2333 3.7667
Coefficients: (4 not defined because of singularities)
Estimate Std. Error t value Pr(>|t|)
(Intercept) 87.9667 1.7283 50.898 2.17e-15 ***
Time2 0.5667 4.2335 0.134 0.896
Temperature2 0.5333 3.4566 0.154 0.880
Temperature3 1.7000 5.9870 0.284 0.781
pressure2 -0.8000 2.4442 -0.327 0.749
pressure3 0.2000 3.4566 0.058 0.955
Temperature2:pressure2 NA NA NA NA
Temperature3:pressure2 NA NA NA NA
Temperature2:pressure3 NA NA NA NA
Temperature3:pressure3 NA NA NA NA
Signif. codes: 0 '***' 0.001 '**' 0.01 '*' 0.05 '.' 0.1 ' ' 1
Residual standard error: 2.994 on 12 degrees of freedom
Multiple R-squared: 0.1537, Adjusted R-squared: -0.1989
F-statistic: 0.436 on 5 and 12 DF, p-value: 0.8151
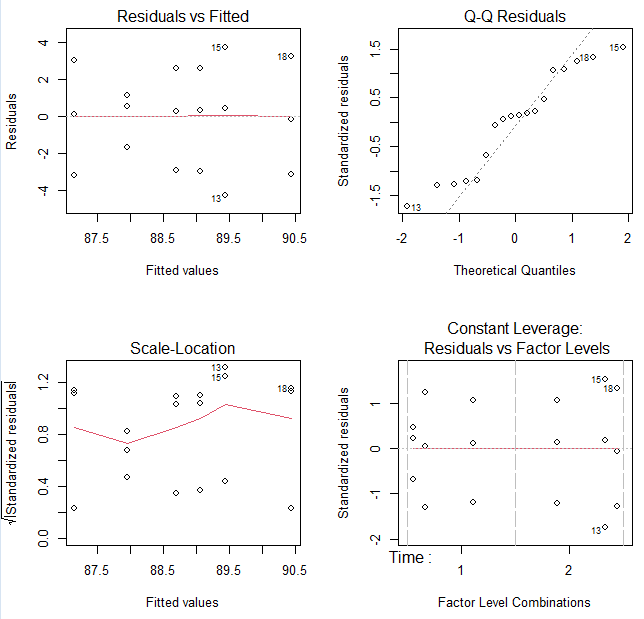
par(mfrow=c(2,2))
plot(fit)
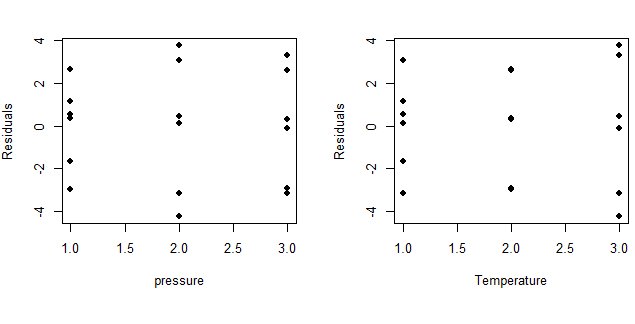
par(mfrow=c(2,2))
plot(as.numeric(dataframepressure), fitresiduals, xlab="pressure", ylab="Residuals", type="p", pch=16)
plot(as.numeric(dataframeTemperature), fitresiduals, xlab="Temperature", ylab="Residuals", pch=16)