✨作者主页 :IT毕设梦工厂✨
个人简介:曾从事计算机专业培训教学,擅长Java、Python、PHP、.NET、Node.js、GO、微信小程序、安卓Android等项目实战。接项目定制开发、代码讲解、答辩教学、文档编写、降重等。
文章目录
一、前言
系统介绍
基于大数据的儿童出生体重和妊娠期数据可视化分析系统是一个综合运用Hadoop、Spark等大数据技术的母婴健康数据分析平台。系统采用Hadoop+Spark作为大数据处理框架,通过HDFS进行分布式存储,利用Spark SQL和Pandas、NumPy进行数据清洗与统计分析。后端基于Django和Spring Boot双版本架构,前端采用Vue+ElementUI构建交互界面,集成Echarts实现数据可视化展示。系统核心功能包括多因素综合分析、核心指标分布分析、健康习惯影响分析、母婴特征影响分析等模块,能够对婴儿出生体重、母亲年龄、BMI指数、妊娠期天数、吸烟情况等关键指标进行深度挖掘。通过相关性热力图、分布统计图表、趋势分析图等可视化方式,为医疗工作者和研究人员提供科学的数据支撑,帮助识别影响婴儿出生体重的风险因素,为孕期健康管理和医疗决策提供参考依据。
选题背景
随着医疗信息化水平不断提升和电子病历系统的广泛应用,医院和妇幼保健机构积累了大量的孕产妇及新生儿健康数据。这些数据蕴含着丰富的医学价值,但传统的统计分析方法难以充分挖掘其中的深层关联规律。婴儿出生体重作为评估新生儿健康状况的重要指标,受到母亲年龄、体重指数、妊娠期长度、生活习惯等多重因素影响,其复杂的关联关系需要借助现代大数据技术进行深入分析。目前医疗机构在处理此类数据时,往往依赖简单的描述性统计,缺乏系统性的多维度分析工具,无法有效识别高危因素的组合模式。同时,现有的分析结果多以数字报表形式呈现,可视化程度不高,不便于医护人员直观理解和临床应用,这就迫切需要开发一套集数据处理、统计分析和可视化展示于一体的综合分析系统。
选题意义
本系统的开发对提升母婴健康管理水平具有重要的实际意义。通过对大量历史数据的深度挖掘,能够帮助医护人员更准确地识别影响婴儿出生体重的关键风险因素,为制定个性化的孕期管理方案提供科学依据。系统中的多因素关联分析功能可以揭示吸烟、BMI异常、高龄妊娠等因素的复合影响,有助于及早发现高危孕妇群体,降低低体重儿和巨大儿的发生率。可视化分析结果能够直观展示不同年龄段、不同健康状况产妇的妊娠结局分布,为医院的质量管理和临床决策提供支撑。从技术角度来看,本系统探索了大数据技术在医疗健康领域的应用实践,为类似的医疗数据分析项目提供了可参考的技术方案。虽然作为毕业设计项目,系统规模和功能相对有限,但其设计思路和实现方法对推动医疗数据智能化分析具有一定的借鉴价值,也为后续更深入的医疗大数据研究奠定了基础。
二、开发环境
- 大数据框架:Hadoop+Spark(本次没用Hive,支持定制)
- 开发语言:Python+Java(两个版本都支持)
- 后端框架:Django+Spring Boot(Spring+SpringMVC+Mybatis)(两个版本都支持)
- 前端:Vue+ElementUI+Echarts+HTML+CSS+JavaScript+jQuery
- 详细技术点:Hadoop、HDFS、Spark、Spark SQL、Pandas、NumPy
- 数据库:MySQL
三、系统界面展示
- 基于大数据的儿童出生体重和妊娠期数据可视化分析系统界面展示:

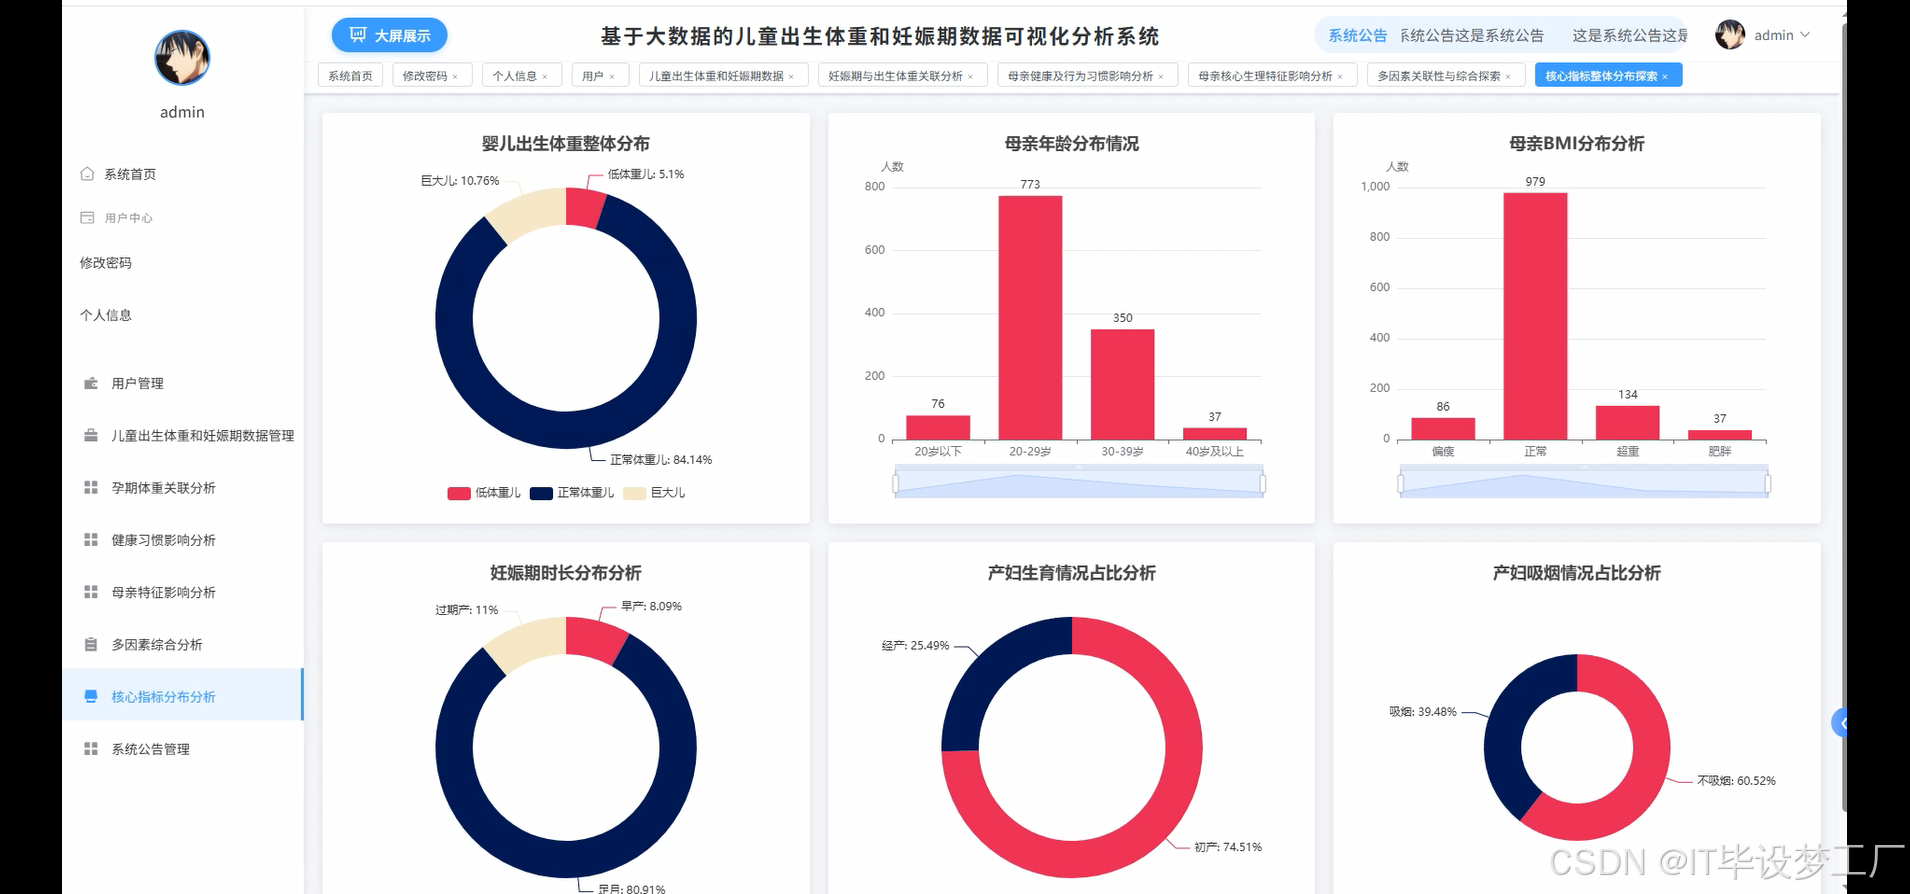


四、部分代码设计
- 项目实战-代码参考:
java(贴上部分代码)
from pyspark.sql import SparkSession
from pyspark.sql.functions import col, when, avg, count, corr, desc, asc
from pyspark.sql.types import DoubleType, StringType
import pandas as pd
import numpy as np
from django.http import JsonResponse
from django.views.decorators.csrf import csrf_exempt
import json

spark = SparkSession.builder.appName("BabyWeightAnalysis").config("spark.sql.adaptive.enabled", "true").config("spark.serializer", "org.apache.spark.serializer.KryoSerializer").getOrCreate()

@csrf_exempt
def multi_factor_correlation_analysis(request):
    df = spark.read.option("header", "true").option("inferSchema", "true").csv("hdfs://localhost:9000/baby_data/babies.csv")
    df_clean = df.filter(col("bwt").isNotNull() & col("gestation").isNotNull() & col("age").isNotNull() & col("height").isNotNull() & col("weight").isNotNull() & col("smoke").isNotNull())
    df_with_bmi = df_clean.withColumn("BMI", col("weight") / ((col("height") * 2.54 / 100) ** 2))
    numeric_cols = ["bwt", "gestation", "age", "height", "weight", "BMI"]
    correlation_matrix = {}
    for i, col1 in enumerate(numeric_cols):
        correlation_matrix[col1] = {}
        for j, col2 in enumerate(numeric_cols):
            if i <= j:
                corr_value = df_with_bmi.select(corr(col1, col2)).collect()[0][0]
                correlation_matrix[col1][col2] = round(corr_value, 3) if corr_value else 0.0
                if i != j:
                    correlation_matrix.setdefault(col2, {})[col1] = correlation_matrix[col1][col2]
    age_groups = df_with_bmi.withColumn("age_group", when(col("age") < 20, "20岁以下").when(col("age") < 30, "20-29岁").when(col("age") < 40, "30-39岁").otherwise("40岁以上"))
    bmi_groups = age_groups.withColumn("bmi_category", when(col("BMI") < 18.5, "偏瘦").when(col("BMI") < 25, "正常").when(col("BMI") < 30, "超重").otherwise("肥胖"))
    smoke_groups = bmi_groups.withColumn("smoke_label", when(col("smoke") == 0, "不吸烟").otherwise("吸烟"))
    multi_factor_stats = smoke_groups.groupBy("age_group", "bmi_category", "smoke_label").agg(avg("bwt").alias("avg_weight"), count("*").alias("count")).orderBy("age_group", "bmi_category", "smoke_label")
    multi_factor_data = [row.asDict() for row in multi_factor_stats.collect()]
    risk_combinations = smoke_groups.filter((col("age") >= 35) & (col("BMI") >= 25) & (col("smoke") == 1))
    high_risk_stats = risk_combinations.agg(avg("bwt").alias("high_risk_avg_weight"), count("*").alias("high_risk_count")).collect()[0]
    normal_group = smoke_groups.filter((col("age") < 35) & (col("BMI") < 25) & (col("smoke") == 0))
    normal_stats = normal_group.agg(avg("bwt").alias("normal_avg_weight"), count("*").alias("normal_count")).collect()[0]
    result = {"correlation_matrix": correlation_matrix, "multi_factor_analysis": multi_factor_data, "risk_comparison": {"high_risk_group": {"avg_weight": round(high_risk_stats["high_risk_avg_weight"], 2) if high_risk_stats["high_risk_avg_weight"] else 0, "count": high_risk_stats["high_risk_count"]}, "normal_group": {"avg_weight": round(normal_stats["normal_avg_weight"], 2) if normal_stats["normal_avg_weight"] else 0, "count": normal_stats["normal_count"]}}}
    return JsonResponse(result)

@csrf_exempt
def core_indicators_distribution_analysis(request):
    df = spark.read.option("header", "true").option("inferSchema", "true").csv("hdfs://localhost:9000/baby_data/babies.csv")
    df_clean = df.filter(col("bwt").isNotNull() & col("gestation").isNotNull() & col("age").isNotNull() & col("height").isNotNull() & col("weight").isNotNull())
    df_processed = df_clean.withColumn("BMI", col("weight") / ((col("height") * 2.54 / 100) ** 2))
    weight_distribution = df_processed.withColumn("bwt_category", when(col("bwt") < 2500, "低体重儿").when(col("bwt") > 4000, "巨大儿").otherwise("正常体重"))
    weight_stats = weight_distribution.groupBy("bwt_category").agg(count("*").alias("count")).orderBy(desc("count"))
    weight_data = [{"category": row["bwt_category"], "count": row["count"], "percentage": round(row["count"] / df_processed.count() * 100, 1)} for row in weight_stats.collect()]
    age_distribution = df_processed.withColumn("age_group", when(col("age") < 20, "20岁以下").when(col("age") < 30, "20-29岁").when(col("age") < 40, "30-39岁").otherwise("40岁以上"))
    age_stats = age_distribution.groupBy("age_group").agg(count("*").alias("count"), avg("bwt").alias("avg_weight")).orderBy("age_group")
    age_data = [{"age_group": row["age_group"], "count": row["count"], "avg_weight": round(row["avg_weight"], 1)} for row in age_stats.collect()]
    bmi_distribution = df_processed.withColumn("bmi_category", when(col("BMI") < 18.5, "偏瘦").when(col("BMI") < 25, "正常").when(col("BMI") < 30, "超重").otherwise("肥胖"))
    bmi_stats = bmi_distribution.groupBy("bmi_category").agg(count("*").alias("count"), avg("bwt").alias("avg_weight")).orderBy("bmi_category")
    bmi_data = [{"bmi_category": row["bmi_category"], "count": row["count"], "avg_weight": round(row["avg_weight"], 1)} for row in bmi_stats.collect()]
    gestation_distribution = df_processed.withColumn("gestation_group", when(col("gestation") < 259, "早产").when(col("gestation") > 294, "过期").otherwise("足月"))
    gestation_stats = gestation_distribution.groupBy("gestation_group").agg(count("*").alias("count"), avg("bwt").alias("avg_weight")).orderBy("gestation_group")
    gestation_data = [{"gestation_group": row["gestation_group"], "count": row["count"], "avg_weight": round(row["avg_weight"], 1)} for row in gestation_stats.collect()]
    parity_distribution = df_processed.withColumn("parity_label", when(col("parity") == 0, "初产").otherwise("经产"))
    parity_stats = parity_distribution.groupBy("parity_label").agg(count("*").alias("count"), avg("bwt").alias("avg_weight")).orderBy("parity_label")
    parity_data = [{"parity_label": row["parity_label"], "count": row["count"], "avg_weight": round(row["avg_weight"], 1)} for row in parity_stats.collect()]
    smoke_distribution = df_processed.withColumn("smoke_label", when(col("smoke") == 0, "不吸烟").otherwise("吸烟"))
    smoke_stats = smoke_distribution.groupBy("smoke_label").agg(count("*").alias("count"), avg("bwt").alias("avg_weight")).orderBy("smoke_label")
    smoke_data = [{"smoke_label": row["smoke_label"], "count": row["count"], "avg_weight": round(row["avg_weight"], 1)} for row in smoke_stats.collect()]
    result = {"weight_distribution": weight_data, "age_distribution": age_data, "bmi_distribution": bmi_data, "gestation_distribution": gestation_data, "parity_distribution": parity_data, "smoke_distribution": smoke_data}
    return JsonResponse(result)

@csrf_exempt
def health_habits_impact_analysis(request):
    df = spark.read.option("header", "true").option("inferSchema", "true").csv("hdfs://localhost:9000/baby_data/babies.csv")
    df_clean = df.filter(col("bwt").isNotNull() & col("gestation").isNotNull() & col("age").isNotNull() & col("height").isNotNull() & col("weight").isNotNull() & col("smoke").isNotNull())
    df_with_categories = df_clean.withColumn("BMI", col("weight") / ((col("height") * 2.54 / 100) ** 2)).withColumn("bmi_category", when(col("BMI") < 18.5, "偏瘦").when(col("BMI") < 25, "正常").when(col("BMI") < 30, "超重").otherwise("肥胖")).withColumn("smoke_label", when(col("smoke") == 0, "不吸烟").otherwise("吸烟")).withColumn("bwt_category", when(col("bwt") < 2500, "低体重儿").when(col("bwt") > 4000, "巨大儿").otherwise("正常体重"))
    bmi_impact_on_weight = df_with_categories.groupBy("bmi_category").agg(avg("bwt").alias("avg_weight"), count("*").alias("count")).orderBy("bmi_category")
    bmi_weight_data = [{"bmi_category": row["bmi_category"], "avg_weight": round(row["avg_weight"], 1), "count": row["count"]} for row in bmi_impact_on_weight.collect()]
    bmi_impact_on_gestation = df_with_categories.groupBy("bmi_category").agg(avg("gestation").alias("avg_gestation"), count("*").alias("count")).orderBy("bmi_category")
    bmi_gestation_data = [{"bmi_category": row["bmi_category"], "avg_gestation": round(row["avg_gestation"], 1), "count": row["count"]} for row in bmi_impact_on_gestation.collect()]
    smoke_impact_on_weight = df_with_categories.groupBy("smoke_label").agg(avg("bwt").alias("avg_weight"), count("*").alias("count")).orderBy("smoke_label")
    smoke_weight_data = [{"smoke_label": row["smoke_label"], "avg_weight": round(row["avg_weight"], 1), "count": row["count"]} for row in smoke_impact_on_weight.collect()]
    smoke_low_weight_risk = df_with_categories.groupBy("smoke_label", "bwt_category").agg(count("*").alias("count"))
    smoke_risk_pivot = smoke_low_weight_risk.groupBy("smoke_label").pivot("bwt_category").sum("count").na.fill(0)
    smoke_risk_data = []
    for row in smoke_risk_pivot.collect():
        total = sum([row[col] for col in ["低体重儿", "正常体重", "巨大儿"] if col in row.asDict()])
        smoke_risk_data.append({"smoke_label": row["smoke_label"], "low_weight_rate": round((row.get("低体重儿", 0) / total * 100), 2) if total > 0 else 0, "normal_weight_rate": round((row.get("正常体重", 0) / total * 100), 2) if total > 0 else 0, "high_weight_rate": round((row.get("巨大儿", 0) / total * 100), 2) if total > 0 else 0})
    age_smoke_analysis = df_with_categories.withColumn("age_group", when(col("age") < 20, "20岁以下").when(col("age") < 30, "20-29岁").when(col("age") < 40, "30-39岁").otherwise("40岁以上"))
    age_smoke_stats = age_smoke_analysis.groupBy("age_group", "smoke_label").agg(count("*").alias("count"))
    age_smoke_pivot = age_smoke_stats.groupBy("age_group").pivot("smoke_label").sum("count").na.fill(0)
    age_smoke_data = []
    for row in age_smoke_pivot.collect():
        total = row.get("不吸烟", 0) + row.get("吸烟", 0)
        age_smoke_data.append({"age_group": row["age_group"], "smoking_rate": round((row.get("吸烟", 0) / total * 100), 2) if total > 0 else 0, "non_smoking_count": row.get("不吸烟", 0), "smoking_count": row.get("吸烟", 0)})
    result = {"bmi_impact_weight": bmi_weight_data, "bmi_impact_gestation": bmi_gestation_data, "smoke_impact_weight": smoke_weight_data, "smoke_risk_analysis": smoke_risk_data, "age_smoke_analysis": age_smoke_data}
    return JsonResponse(result)
五、系统视频
- 基于大数据的儿童出生体重和妊娠期数据可视化分析系统-项目视频:
大数据毕业设计选题推荐-基于大数据的儿童出生体重和妊娠期数据可视化分析系统-Hadoop-Spark-数据可视化-BigData
结语
大数据毕业设计选题推荐-基于大数据的儿童出生体重和妊娠期数据可视化分析系统-Hadoop-Spark-数据可视化-BigData
想看其他类型的计算机毕业设计作品也可以和我说~谢谢大家!
有技术这一块问题大家可以评论区交流或者私我~
大家可以帮忙点赞、收藏、关注、评论啦~
源码获取:⬇⬇⬇