💖💖作者:计算机编程小央姐
💙💙个人简介:曾长期从事计算机专业培训教学,本人也热爱上课教学,语言擅长Java、微信小程序、Python、Golang、安卓Android等,开发项目包括大数据、深度学习、网站、小程序、安卓、算法。平常会做一些项目定制化开发、代码讲解、答辩教学、文档编写、也懂一些降重方面的技巧。平常喜欢分享一些自己开发中遇到的问题的解决办法,也喜欢交流技术,大家有技术代码这一块的问题可以问我!
💛💛想说的话:感谢大家的关注与支持! 💜💜
💕💕文末获取源码
目录
基于Hadoop+Spark的全球能源消耗数据分析与可视化系统-系统功能介绍
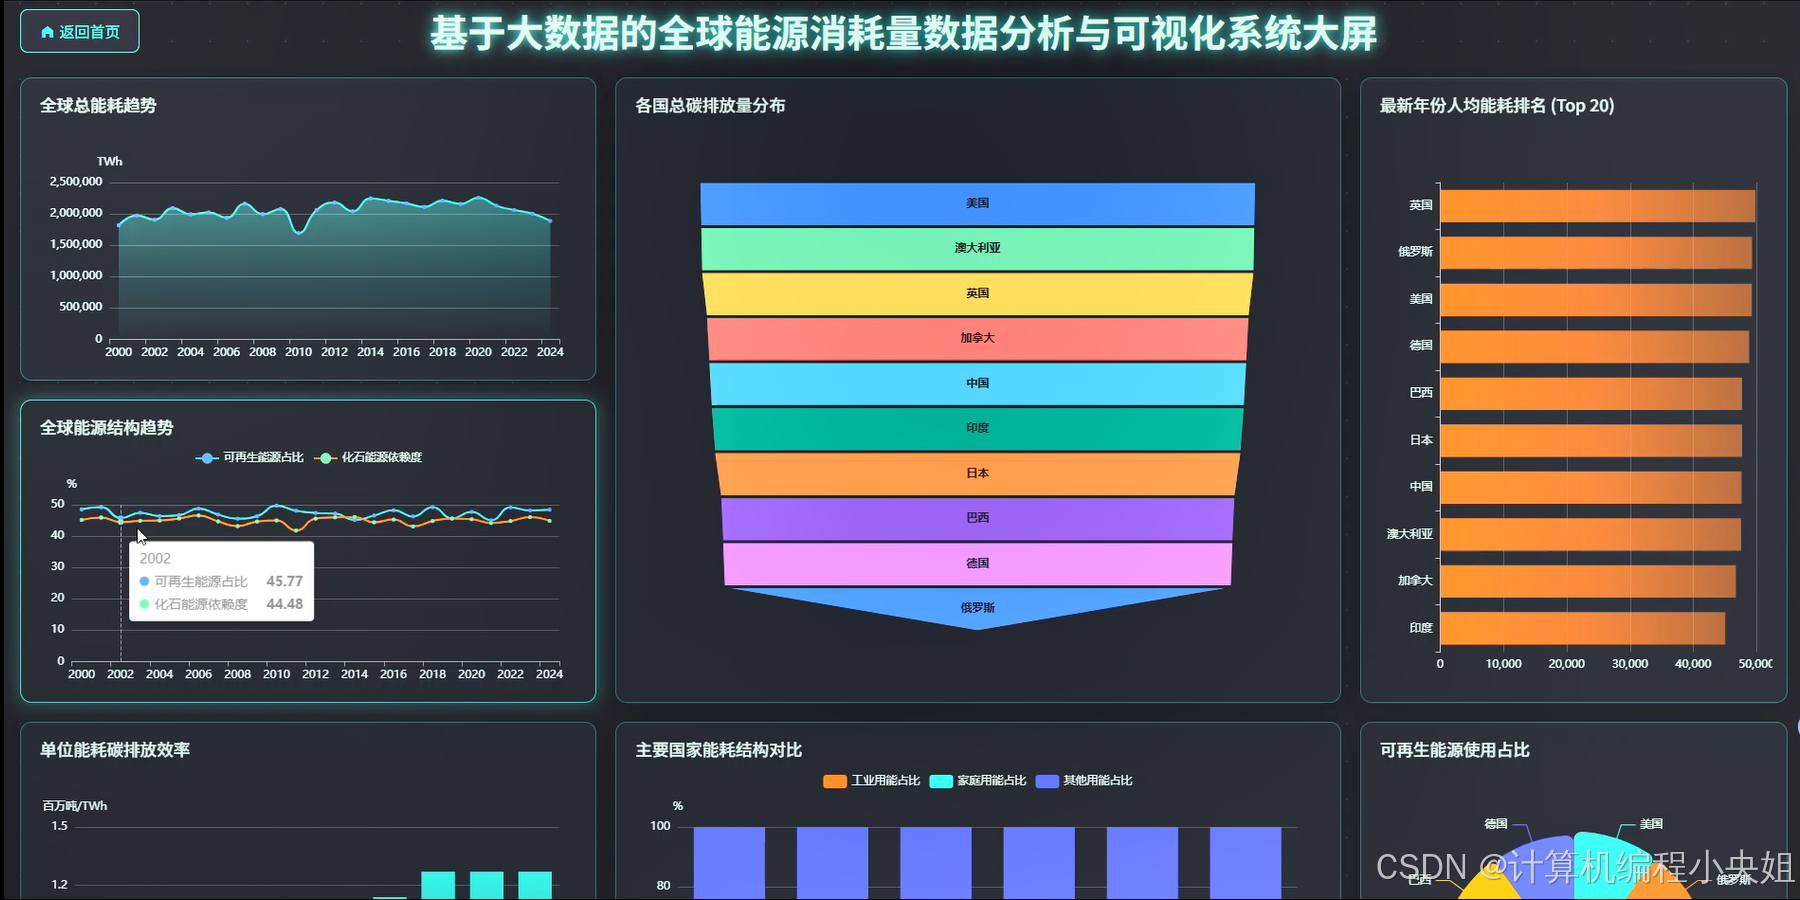
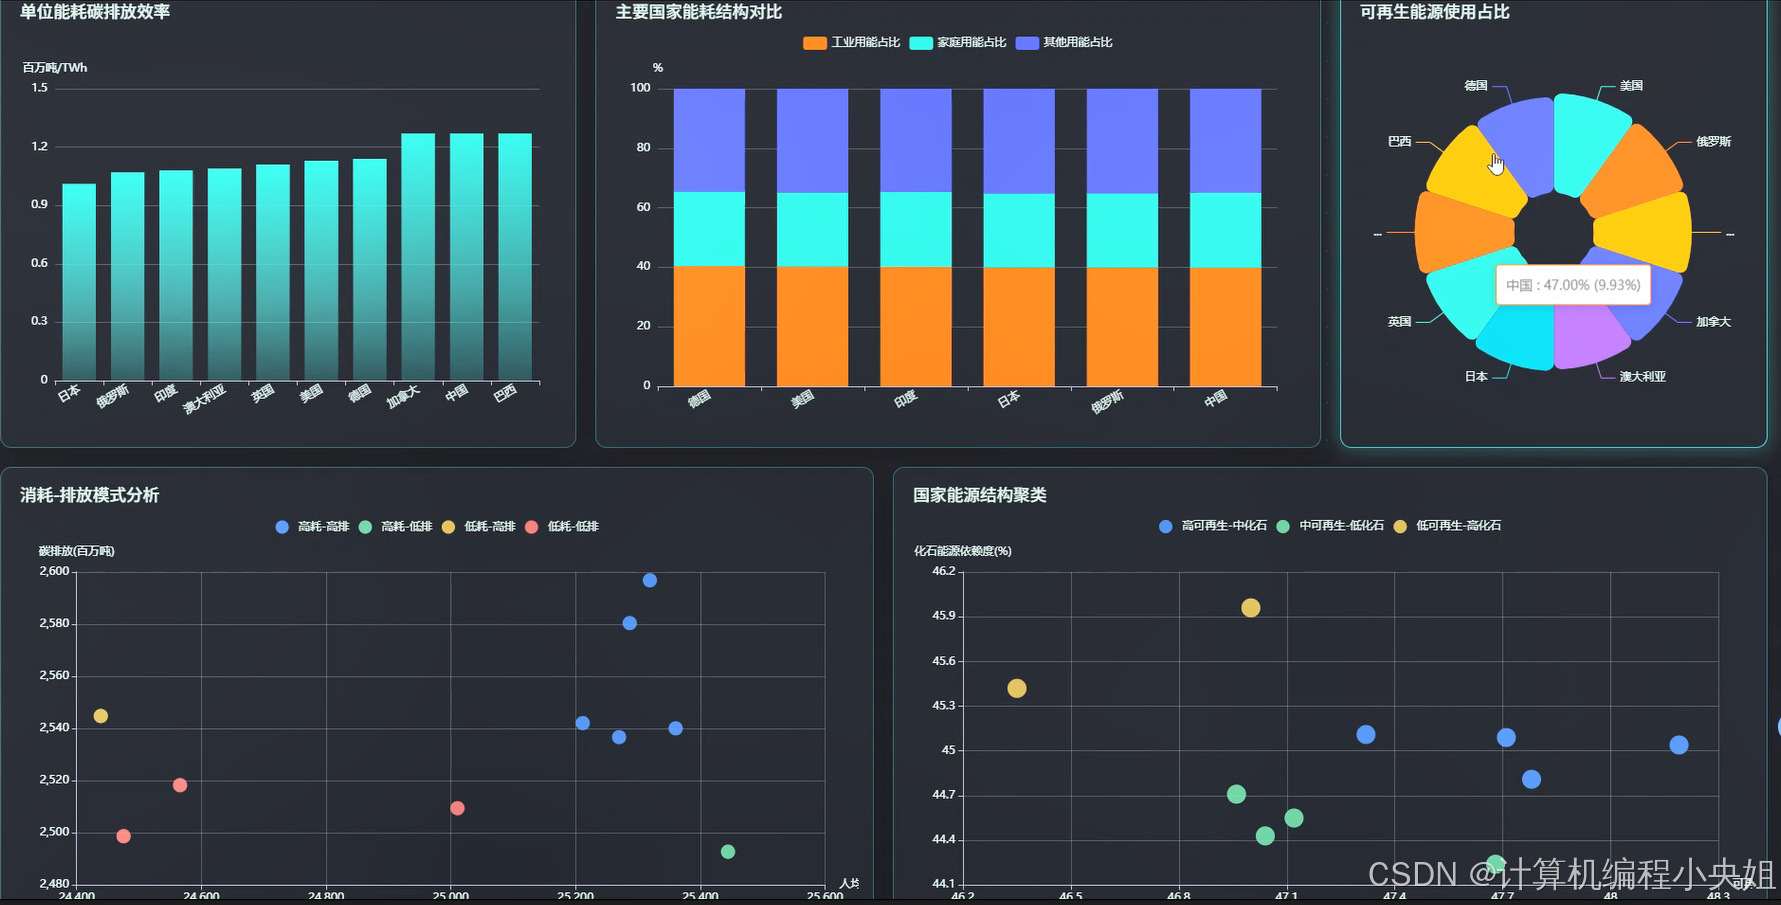
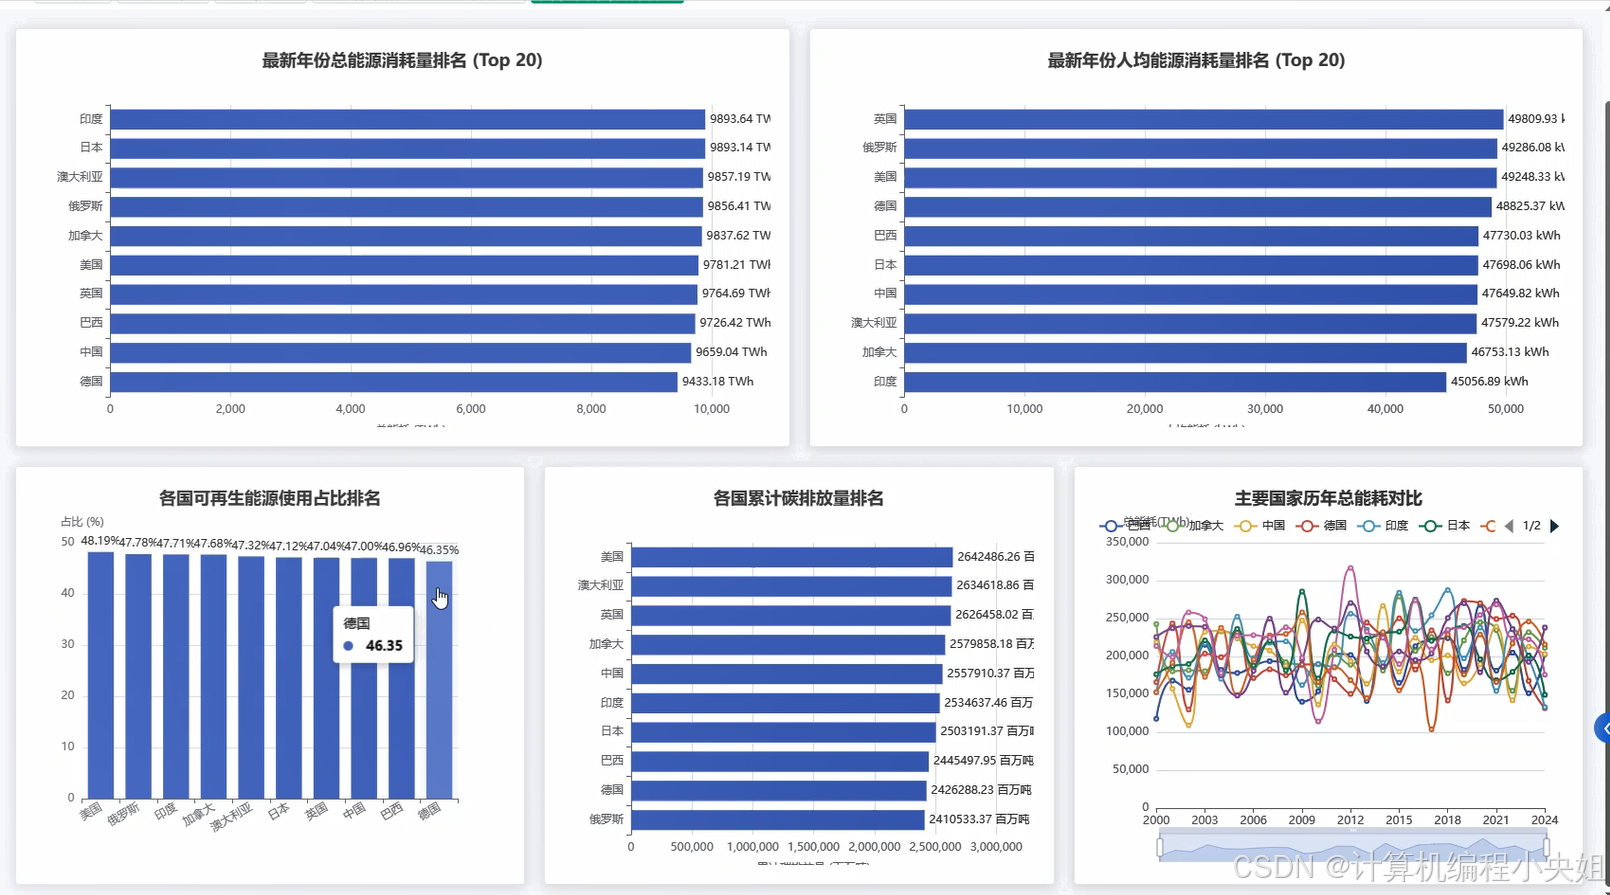
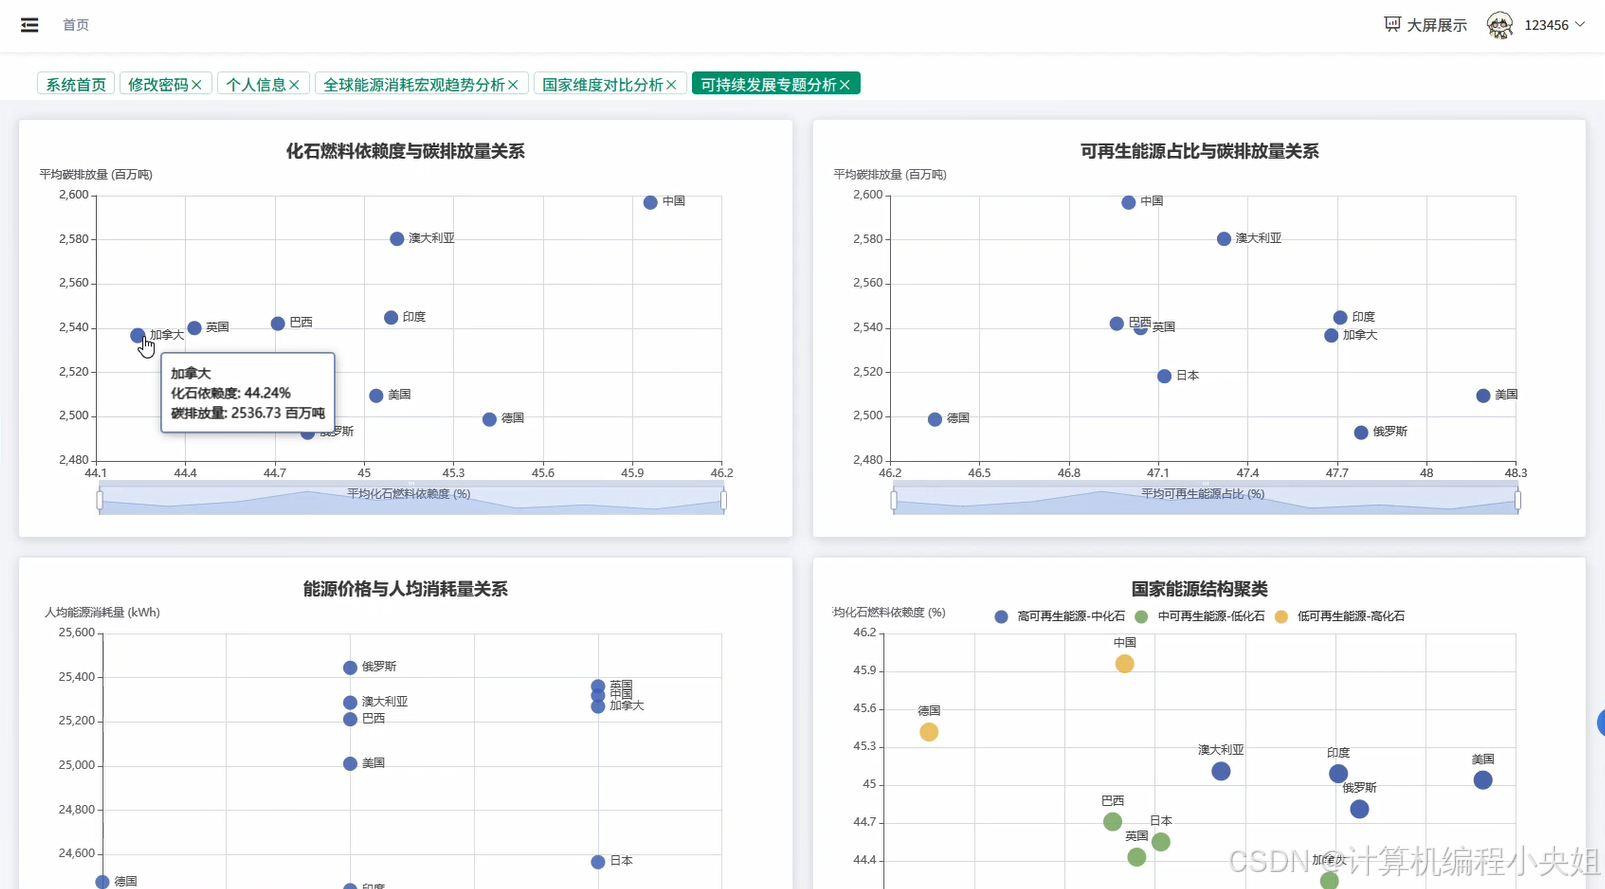
基于Hadoop+Spark的全球能源消耗数据分析与可视化系统是一套面向大数据处理的综合性分析平台,专门用于处理和分析全球范围内的能源消耗相关数据。该系统采用Hadoop分布式文件系统作为底层数据存储架构,结合Spark大数据计算引擎实现对海量能源数据的高效处理和分析。系统后端基于Python语言和Django框架构建,利用Spark SQL、Pandas、NumPy等数据处理工具完成复杂的数据清洗、统计分析和挖掘任务,前端采用Vue.js配合ElementUI组件库和Echarts可视化图表库,为用户提供直观友好的数据展示界面。系统围绕全球能源消耗这一主题,设计了四个核心分析维度:全球能源消耗宏观趋势分析、不同国家维度的能源状况横向对比、能源结构与可持续发展专题分析,以及能源效率与消耗模式分析。通过这些分析维度,系统能够从时间序列、地理分布、结构关系等多个角度深入挖掘能源数据的内在规律,并通过丰富的图表形式将分析结果直观地呈现给用户,帮助用户理解全球能源发展趋势、各国能源政策效果,以及能源转型的进展情况。
基于Hadoop+Spark的全球能源消耗数据分析与可视化系统-系统技术介绍
大数据框架:Hadoop+Spark(本次没用Hive,支持定制)
开发语言:Python+Java(两个版本都支持)
后端框架:Django+Spring Boot(Spring+SpringMVC+Mybatis)(两个版本都支持)
前端:Vue+ElementUI+Echarts+HTML+CSS+JavaScript+jQuery
详细技术点:Hadoop、HDFS、Spark、Spark SQL、Pandas、NumPy
数据库:MySQL
基于Hadoop+Spark的全球能源消耗数据分析与可视化系统-系统背景意义
随着全球工业化进程的不断推进和人类生活水平的持续提高,能源作为经济发展和社会进步的重要支撑,其消耗模式和结构变化日益受到国际社会的广泛关注。当前全球正面临着能源需求快速增长与环境保护要求日趋严格的双重挑战,各国政府和国际组织都在积极推动能源结构转型,致力于提高可再生能源比重,降低对化石燃料的依赖程度。在这样的背景下,如何有效收集、整理和分析全球各国的能源消耗数据,准确把握能源发展趋势,已经成为政策制定者、研究机构和企业决策者关注的重要问题。同时,随着大数据技术的不断成熟和普及,利用先进的数据处理技术对海量能源数据进行深度挖掘和分析,已经成为能源领域研究的重要手段和发展方向,为科学制定能源政策、合理配置能源资源提供了新的技术支撑。
从实用角度来看,这个系统虽然规模有限,但能够为相关研究人员和学习者提供一个相对完整的大数据分析实践平台,帮助他们更好地理解全球能源消耗的基本情况和变化规律。通过系统提供的各类分析功能,用户可以比较直观地观察到不同国家在能源利用方面的差异,了解可再生能源发展的现状,这对于开展相关学术研究或者政策分析具有一定的参考价值。从技术层面来说,该系统整合了Hadoop、Spark等主流大数据技术,展示了这些技术在实际数据处理场景中的应用方法,为学习和掌握大数据技术提供了一个具体的实践案例。对于正在学习相关技术的同学来说,通过研究和使用这个系统,能够加深对分布式数据处理、数据可视化等技术的理解。另外,系统设计的多维度分析框架在一定程度上体现了数据分析的系统性思维,通过宏观趋势、国别对比、结构分析等不同视角,展示了如何从多个角度去认识和分析复杂的数据问题,这种分析思路在其他类似的数据分析项目中也有借鉴意义。
基于Hadoop+Spark的全球能源消耗数据分析与可视化系统-系统演示视频
大数据毕业设计选题推荐:基于Hadoop+Spark的全球能源消耗数据分析与可视化系统
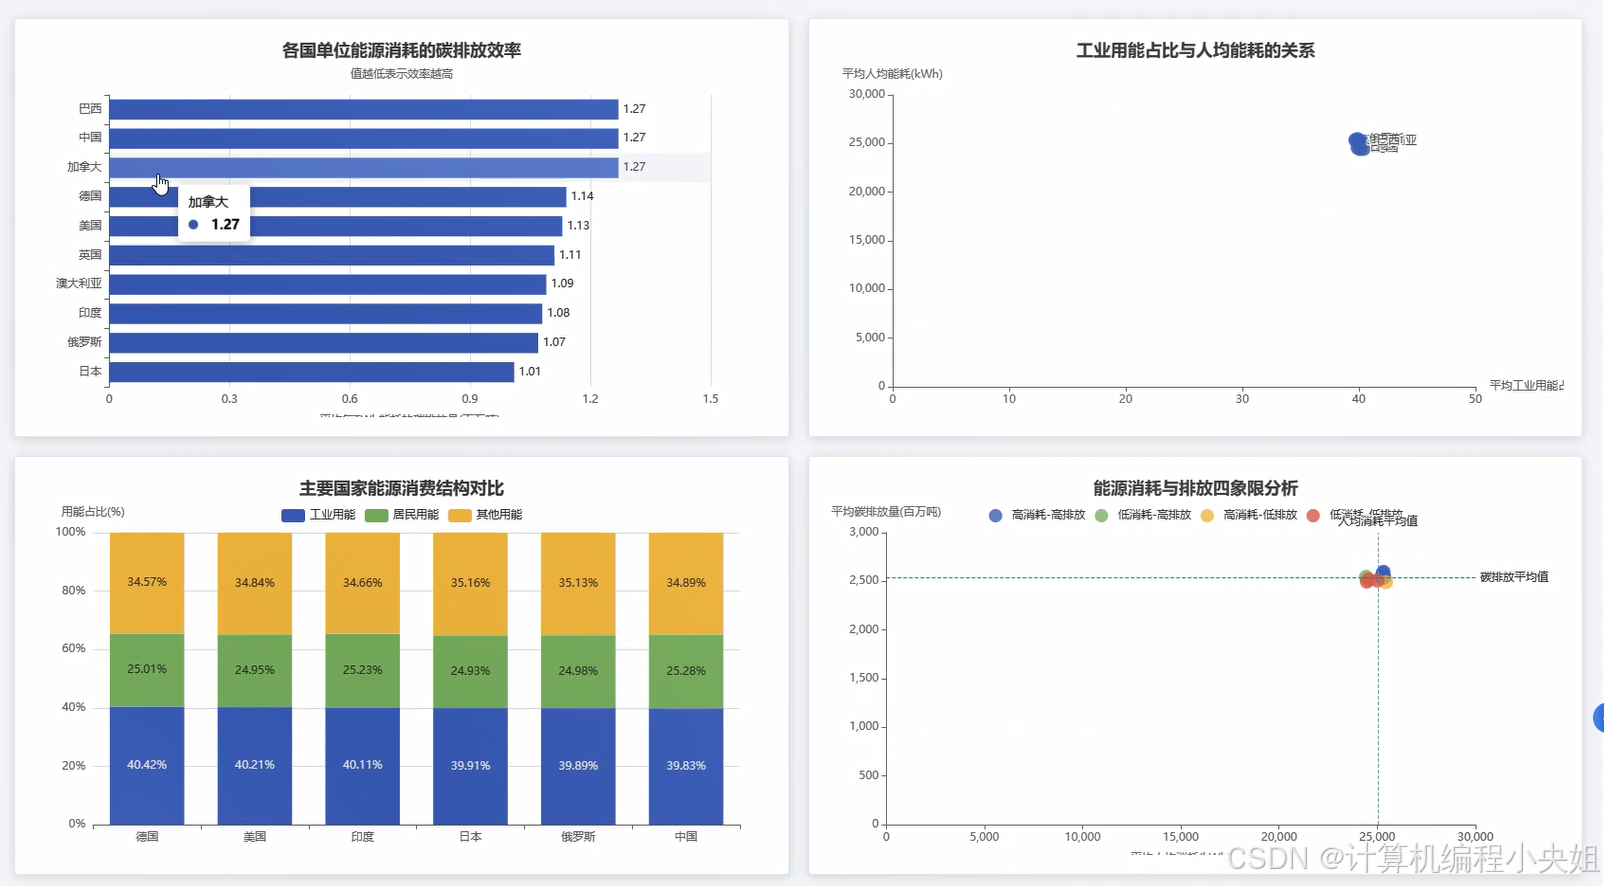
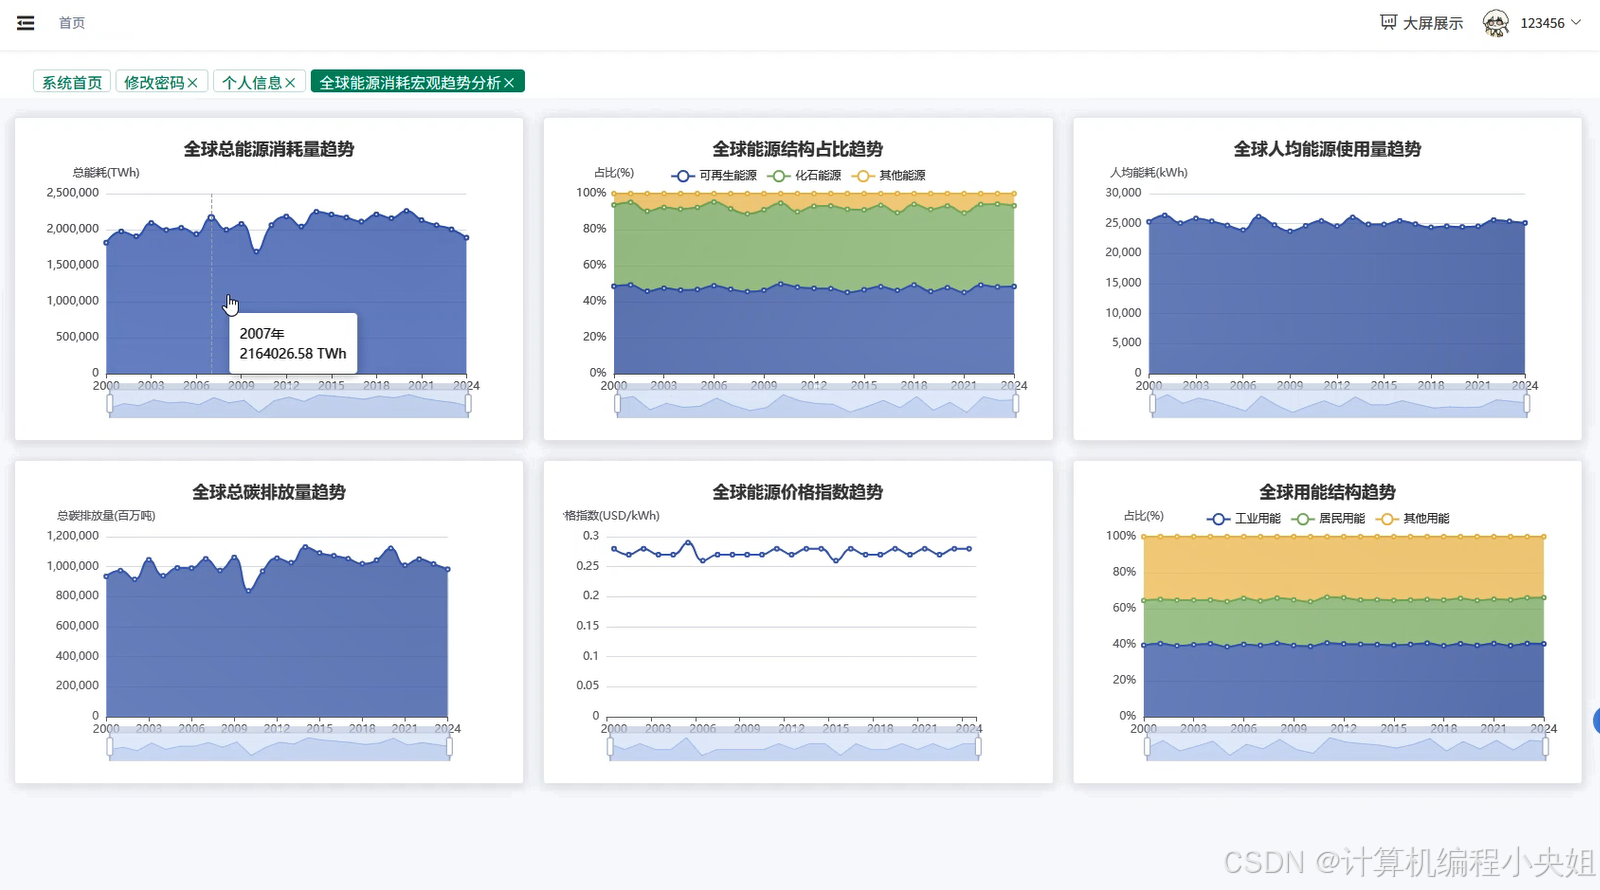
基于Hadoop+Spark的全球能源消耗数据分析与可视化系统-系统演示图片
基于Hadoop+Spark的全球能源消耗数据分析与可视化系统-系统部分代码
python
from pyspark.sql import SparkSession

from pyspark.sql.functions import sum, avg, max, min, year, col, desc, asc

from pyspark.sql.types import StructType, StructField, StringType, IntegerType, DoubleType

from sklearn.cluster import KMeans

import pandas as pd

import numpy as np

from django.http import JsonResponse

from django.views.decorators.http import require_http_methods

import json

import mysql.connector

@require_http_methods(["GET"])

def global_energy_trend_analysis(request):

    spark = SparkSession.builder.appName("GlobalEnergyTrendAnalysis").config("spark.sql.adaptive.enabled", "true").config("spark.sql.adaptive.coalescePartitions.enabled", "true").getOrCreate()

    schema = StructType([StructField("Country", StringType(), True), StructField("Year", IntegerType(), True), StructField("Total_Energy_Consumption", DoubleType(), True), StructField("Renewable_Energy_Share", DoubleType(), True), StructField("Carbon_Emissions", DoubleType(), True), StructField("Per_Capita_Energy_Use", DoubleType(), True), StructField("Energy_Price_Index", DoubleType(), True)])

    energy_df = spark.read.csv("hdfs://localhost:9000/energy_data/global_energy.csv", header=True, schema=schema)

    yearly_trend = energy_df.groupBy("Year").agg(sum("Total_Energy_Consumption").alias("total_consumption"), avg("Renewable_Energy_Share").alias("avg_renewable_share"), sum("Carbon_Emissions").alias("total_emissions"), avg("Per_Capita_Energy_Use").alias("avg_per_capita"), avg("Energy_Price_Index").alias("avg_price_index")).orderBy("Year")

    trend_data = yearly_trend.collect()

    result_list = []

    for row in trend_data:

        yearly_data = {"year": row["Year"], "total_consumption": round(row["total_consumption"], 2), "renewable_share": round(row["avg_renewable_share"], 2), "total_emissions": round(row["total_emissions"], 2), "per_capita_use": round(row["avg_per_capita"], 2), "price_index": round(row["avg_price_index"], 2)}

        result_list.append(yearly_data)

    connection = mysql.connector.connect(host='localhost', database='energy_analysis', user='root', password='123456')

    cursor = connection.cursor()

    cursor.execute("DELETE FROM global_trend_analysis")

    for data in result_list:

        insert_query = "INSERT INTO global_trend_analysis (year, total_consumption, renewable_share, total_emissions, per_capita_use, price_index) VALUES (%s, %s, %s, %s, %s, %s)"

        cursor.execute(insert_query, (data['year'], data['total_consumption'], data['renewable_share'], data['total_emissions'], data['per_capita_use'], data['price_index']))

    connection.commit()

    cursor.close()

    connection.close()

    spark.stop()

    return JsonResponse({"status": "success", "data": result_list, "message": "全球能源消耗趋势分析完成"})

@require_http_methods(["GET"])

def country_energy_ranking_analysis(request):

    spark = SparkSession.builder.appName("CountryEnergyRankingAnalysis").config("spark.sql.adaptive.enabled", "true").config("spark.sql.adaptive.coalescePartitions.enabled", "true").getOrCreate()

    schema = StructType([StructField("Country", StringType(), True), StructField("Year", IntegerType(), True), StructField("Total_Energy_Consumption", DoubleType(), True), StructField("Per_Capita_Energy_Use", DoubleType(), True), StructField("Renewable_Energy_Share", DoubleType(), True), StructField("Carbon_Emissions", DoubleType(), True)])

    energy_df = spark.read.csv("hdfs://localhost:9000/energy_data/global_energy.csv", header=True, schema=schema)

    latest_year = energy_df.agg(max("Year")).collect()[0][0]

    latest_data = energy_df.filter(col("Year") == latest_year)

    consumption_ranking = latest_data.select("Country", "Total_Energy_Consumption").orderBy(desc("Total_Energy_Consumption")).limit(20)

    per_capita_ranking = latest_data.select("Country", "Per_Capita_Energy_Use").orderBy(desc("Per_Capita_Energy_Use")).limit(20)

    renewable_ranking = latest_data.select("Country", "Renewable_Energy_Share").orderBy(desc("Renewable_Energy_Share")).limit(20)

    emissions_ranking = latest_data.select("Country", "Carbon_Emissions").orderBy(desc("Carbon_Emissions")).limit(20)

    consumption_list = [{"country": row["Country"], "value": round(row["Total_Energy_Consumption"], 2), "rank": idx + 1} for idx, row in enumerate(consumption_ranking.collect())]

    per_capita_list = [{"country": row["Country"], "value": round(row["Per_Capita_Energy_Use"], 2), "rank": idx + 1} for idx, row in enumerate(per_capita_ranking.collect())]

    renewable_list = [{"country": row["Country"], "value": round(row["Renewable_Energy_Share"], 2), "rank": idx + 1} for idx, row in enumerate(renewable_ranking.collect())]

    emissions_list = [{"country": row["Country"], "value": round(row["Carbon_Emissions"], 2), "rank": idx + 1} for idx, row in enumerate(emissions_ranking.collect())]

    connection = mysql.connector.connect(host='localhost', database='energy_analysis', user='root', password='123456')

    cursor = connection.cursor()

    cursor.execute("DELETE FROM country_ranking_analysis")

    all_rankings = {"consumption": consumption_list, "per_capita": per_capita_list, "renewable": renewable_list, "emissions": emissions_list}

    for category, ranking_data in all_rankings.items():

        for item in ranking_data:

            insert_query = "INSERT INTO country_ranking_analysis (category, country, value, rank_position, analysis_year) VALUES (%s, %s, %s, %s, %s)"

            cursor.execute(insert_query, (category, item['country'], item['value'], item['rank'], latest_year))

    connection.commit()

    cursor.close()

    connection.close()

    spark.stop()

    return JsonResponse({"status": "success", "data": all_rankings, "latest_year": latest_year, "message": "国家能源消耗排名分析完成"})

@require_http_methods(["GET"])

def energy_structure_cluster_analysis(request):

    spark = SparkSession.builder.appName("EnergyStructureClusterAnalysis").config("spark.sql.adaptive.enabled", "true").config("spark.sql.adaptive.coalescePartitions.enabled", "true").getOrCreate()

    schema = StructType([StructField("Country", StringType(), True), StructField("Year", IntegerType(), True), StructField("Renewable_Energy_Share", DoubleType(), True), StructField("Fossil_Fuel_Dependency", DoubleType(), True), StructField("Industrial_Energy_Use", DoubleType(), True), StructField("Household_Energy_Use", DoubleType(), True)])

    energy_df = spark.read.csv("hdfs://localhost:9000/energy_data/global_energy.csv", header=True, schema=schema)

    country_avg = energy_df.groupBy("Country").agg(avg("Renewable_Energy_Share").alias("avg_renewable"), avg("Fossil_Fuel_Dependency").alias("avg_fossil"), avg("Industrial_Energy_Use").alias("avg_industrial"), avg("Household_Energy_Use").alias("avg_household"))

    country_data = country_avg.collect()

    countries = [row["Country"] for row in country_data]

    features = np.array([[row["avg_renewable"], row["avg_fossil"], row["avg_industrial"], row["avg_household"]] for row in country_data])

    features = np.nan_to_num(features, nan=0.0)

    kmeans = KMeans(n_clusters=4, random_state=42, n_init=10)

    cluster_labels = kmeans.fit_predict(features)

    cluster_centers = kmeans.cluster_centers_

    cluster_names = ["绿色能源主导型", "化石能源依赖型", "工业用能集中型", "均衡发展型"]

    clustered_countries = {}

    for i, country in enumerate(countries):

        cluster_id = int(cluster_labels[i])

        if cluster_id not in clustered_countries:

            clustered_countries[cluster_id] = {"cluster_name": cluster_names[cluster_id], "countries": [], "center": cluster_centers[cluster_id].tolist()}

        country_info = {"country": country, "renewable": round(features[i][0], 2), "fossil": round(features[i][1], 2), "industrial": round(features[i][2], 2), "household": round(features[i][3], 2)}

        clustered_countries[cluster_id]["countries"].append(country_info)

    connection = mysql.connector.connect(host='localhost', database='energy_analysis', user='root', password='123456')

    cursor = connection.cursor()

    cursor.execute("DELETE FROM energy_cluster_analysis")

    for cluster_id, cluster_info in clustered_countries.items():

        cluster_center_json = json.dumps(cluster_info["center"])

        countries_json = json.dumps(cluster_info["countries"])

        insert_query = "INSERT INTO energy_cluster_analysis (cluster_id, cluster_name, cluster_center, countries_data, country_count) VALUES (%s, %s, %s, %s, %s)"

        cursor.execute(insert_query, (cluster_id, cluster_info["cluster_name"], cluster_center_json, countries_json, len(cluster_info["countries"])))

    connection.commit()

    cursor.close()

    connection.close()

    spark.stop()

    return JsonResponse({"status": "success", "data": clustered_countries, "message": "能源结构聚类分析完成"})
基于Hadoop+Spark的全球能源消耗数据分析与可视化系统-结语
💟💟如果大家有任何疑虑,欢迎在下方位置详细交流。