import numpy as np
%matplotlib widget
import matplotlib.pyplot as plt
from plt_one_addpt_onclick import plt_one_addpt_onclick
from lab_utils_common import draw_vthresh
plt.style.use('./deeplearning.mplstyle')
# Input is an array.
input_array = np.array([1,2,3])
exp_array = np.exp(input_array)
print("Input to exp:", input_array)
print("Output of exp:", exp_array)
# Input is a single number
input_val = 1
exp_val = np.exp(input_val)
print("Input to exp:", input_val)
print("Output of exp:", exp_val)
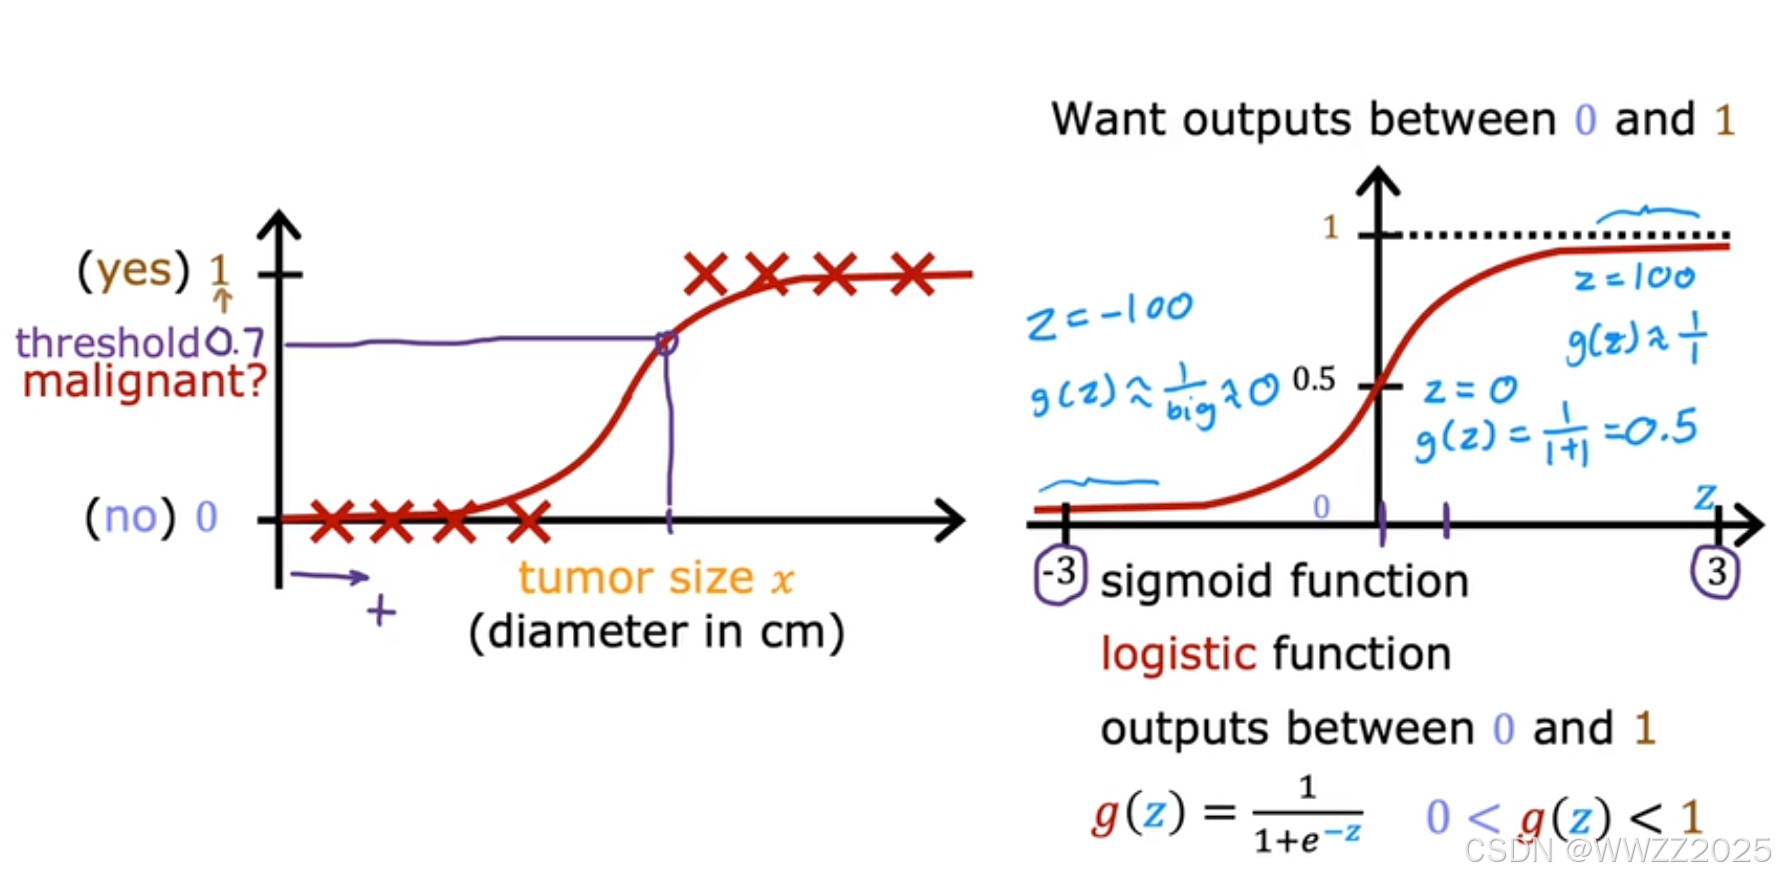
def sigmoid(z):
"""
Compute the sigmoid of z
Args:
z (ndarray): A scalar, numpy array of any size.
Returns:
g (ndarray): sigmoid(z), with the same shape as z
"""
g = 1/(1+np.exp(-z))
return g
# Generate an array of evenly spaced values between -10 and 10
z_tmp = np.arange(-10,11)
# Use the function implemented above to get the sigmoid values
y = sigmoid(z_tmp)
# Code for pretty printing the two arrays next to each other
np.set_printoptions(precision=3)
print("Input (z), Output (sigmoid(z))")
print(np.c_[z_tmp, y])
,图像如下右图。