library(Seurat)
library(tidyverse)
library(dplyr)
library(ggplot2)
library(tibble)
### load data objects ###
Lymphoma_data <- readRDS("Lymphoma_data.rds") #This is saved from Figure 1b.
spatial_niche <- readRDS("spatial_niche.rds")
spatial_niche <- column_to_rownames(spatial_niche, var="Barcode")
Lymphoma_data <- AddMetaData(Lymphoma_data, spatial_niche)
####li
cell_cell_communication_res = readRDS('cell_cell_communication_res.rds')
####cell-cell communication
Lymphoma.meta <- Lymphoma_data@meta.data
meta_for_cell1 <- select(Lymphoma.meta, c("cell_state","CN_cluster","sample_ID"))
colnames(meta_for_cell1)[1:2] <- c("cell_state1","CN_cluster1")
meta_for_cell1 <- rownames_to_column(meta_for_cell1, var="cell1")
cell_cell_communication_res <- left_join(cell_cell_communication_res, meta_for_cell1, by="cell1")
meta_for_cell2 <- select(Lymphoma.meta, c("cell_state","CN_cluster"))
colnames(meta_for_cell2)[1:2] <- c("cell_state2","CN_cluster2")
meta_for_cell2 <- rownames_to_column(meta_for_cell2, var="cell2")
cell_cell_communication_res <- left_join(cell_cell_communication_res, meta_for_cell2, by="cell2")
cell_cell_communication_res$cell_pair <- paste0(cell_cell_communication_res$cell1,":",cell_cell_communication_res$cell2)
aggretrate <- function(a,b,mol_a,mol_b){
data_1 <- filter(cell_cell_communication_res, cell_cell_communication_res$cell_state1==a & cell_cell_communication_res$cell_state2 == b)
data_1 <- data_1[,c(paste0(mol_a,".",mol_b,"_a2b"),"cell_pair","cell1","cell2","cell_state1","CN_cluster1","cell_state2","CN_cluster2")]
data_2 <- filter(cell_cell_communication_res, cell_cell_communication_res$cell_state1==b & cell_cell_communication_res$cell_state2 == a)
data_2 <- data_2[,c(paste0(mol_a,".",mol_b,"_b2a"),"cell_pair","cell1","cell2","cell_state1","CN_cluster1","cell_state2","CN_cluster2")]
colnames(data_1)[1] <- "intensity"
colnames(data_2)[1] <- "intensity"
data <- rbind(data_1, data_2)
data_filter <- filter(data, data$CN_cluster1==data$CN_cluster2)
data_filter$LR <- paste0(mol_a,"-",mol_b)
data_filter$count_ind <- 0
data_filter$count_ind[data_filter$intensity > 0] <- 1
group_mean <- data_filter %>% group_by(CN_cluster1) %>% summarise(mean_value = mean(intensity))
group_mean <- as.numeric(group_mean$mean_value)
group_count <- data_filter %>% group_by(CN_cluster1) %>% summarise(count_value = sum(count_ind))
group_count_sum <- table(data_filter$CN_cluster1)
group_prop <- as.numeric(group_count$count_value/group_count_sum)
data_filter$group_mean <- NA
data_filter$group_prop <- NA
group <- unique(data_filter$CN_cluster1)[order(unique(data_filter$CN_cluster1))]
for (i in 1:length(group)) {
data_filter$group_mean[data_filter$CN_cluster1== group[i]] <- group_mean[i]
data_filter$group_prop[data_filter$CN_cluster1== group[i]] <- group_prop[i]*100
}
return(data_filter)
}
cell_states <- c("C0_Tumor-B","C1_PC_IgG","C2_PC_IgA","C3_Resting-B","C4_PC_IgM","C5_T","C6_TAM_APOE_C1Q","C7_TAM_SPP1","C8_Mac_DUSP1","C9_Mac_CXCL8","C10_Mac_MT2A",
"C11_FRC","C12_HEV","C13_Endothelial_VWF","C14_VSMC","C15_Stromal_CLU","C16_Stressed","C17_Epithelial","C18_RBC")
agg_table <- function(b, mol_b, mol_a){
table <- data.frame()
for(i in mol_a){
for(j in cell_states){
df <- aggretrate(j,b,i,mol_b)
df_unique <- unique(select(df, c("CN_cluster1","LR","group_mean","group_prop")))
df_unique$sender <- j
table <- rbind(table, df_unique)
}
}
return(table)
}
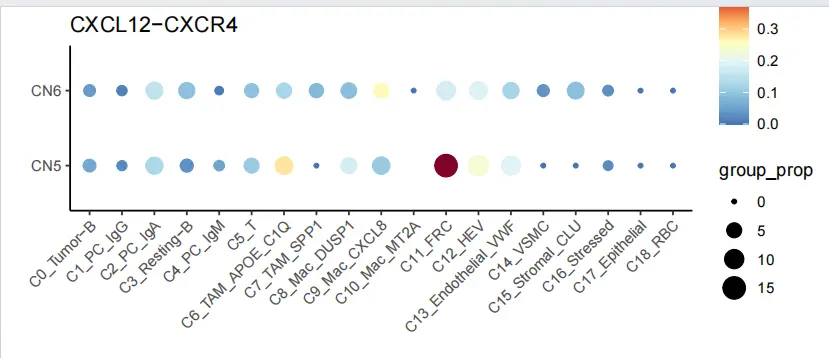
C0_CXCR4_agg_table <- agg_table("C0_Tumor-B", "CXCR4", "CXCL12")
C0_CXCR4_agg_table$sender <- factor(C0_CXCR4_agg_table$sender, levels = c("C0_Tumor-B","C1_PC_IgG","C2_PC_IgA","C3_Resting-B","C4_PC_IgM","C5_T",
"C6_TAM_APOE_C1Q","C7_TAM_SPP1","C8_Mac_DUSP1","C9_Mac_CXCL8","C10_Mac_MT2A",
"C11_FRC","C12_HEV","C13_Endothelial_VWF","C14_VSMC","C15_Stromal_CLU",
"C16_Stressed","C17_Epithelial","C18_RBC"))
ggplot(filter(C0_CXCR4_agg_table, C0_CXCR4_agg_table$CN_cluster1 %in% c("CN5","CN6")), aes(x = sender, y = CN_cluster1, color = group_mean, size = group_prop)) +
scale_color_gradientn(values = seq(0,1,0.1),colours = c("#4575b4","#74add1","#abd9e9","#e0f3f8","#ffffbf","#fdae61","#d73027","#800026"))+
geom_point(stat = 'identity') +
xlab("") + ylab("") +
ggtitle("CXCL12-CXCR4") +
theme_classic()+
theme(axis.text.x = element_text(angle = 45, hjust = 1))
 https://mp.weixin.qq.com/s/8E1vYJMNhe5m0DXieBHfzA.