GEE统计特定区域特定时间上的Landsat/Sentinel的影像信息
前言
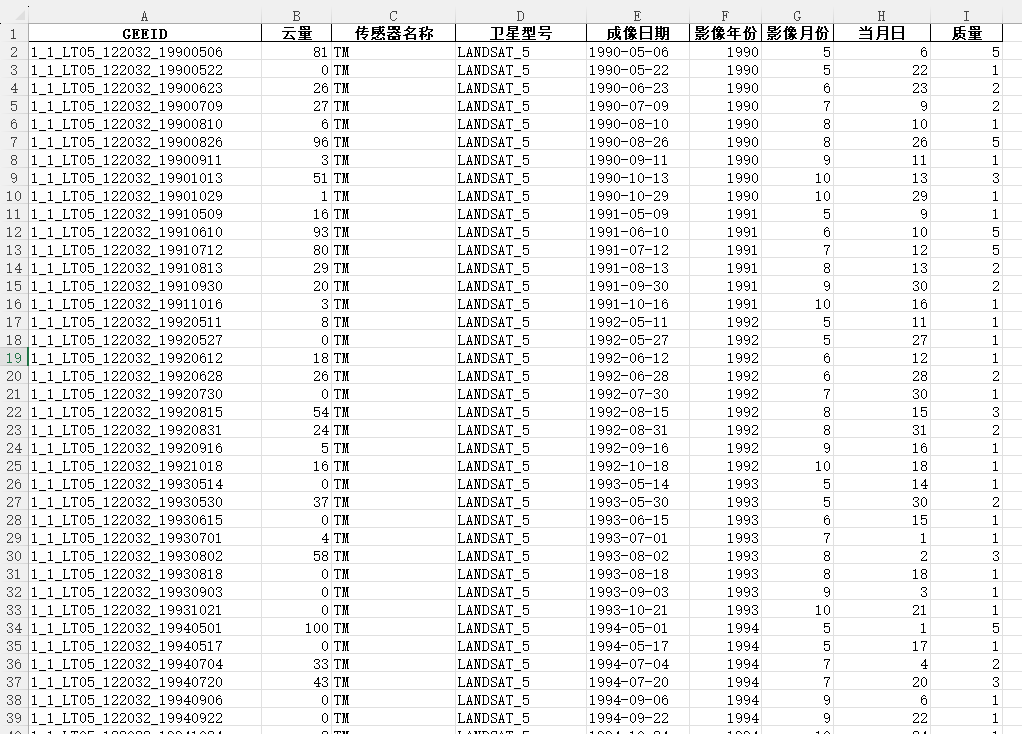
很多时候,我们会想查看一个特定的研究区和研究时间范围内的Landsat 或者 Sentinel系列数据集中影像的一些参数信息,如成像时间,云量,数量等等,以帮助我们确定应该如何筛选影像。比如,我想知道1990年至2020年期间,所有覆盖到北京市的Landsat影像的信息,如下图所示。Landsat系列和Sentinel系列是目前使用最为广泛的两个影像数据集,现在,我提供了实现这一操作的代码框架,大家可以在此基础上进行修改,以得到你想要提取的信息。基于此框架,你还可以扩展到其他影像数据集(如MODIS等)。
统计Landsat影像的信息
统计Landsat系列信息的代码如下:
python
import ee
import geemap
import pandas as pd
geemap.set_proxy(port=7778)
geemap.ee_initialize()
Map = geemap.Map()

# 加载研究区
json_path = './北京市.geojson'
study_region = geemap.geojson_to_ee(json_path)
bound = study_region.bounds()
start_year = 1990
end_year = 2020
start_month = 4
end_month = 10

# 创建Landsat影像集合,过滤日期和区域
landsat5 = ee.ImageCollection("LANDSAT/LT05/C02/T1_L2")
landsat7 = ee.ImageCollection("LANDSAT/LE07/C02/T1_L2")
landsat8 = ee.ImageCollection("LANDSAT/LC08/C02/T1_L2")
landsat9 = ee.ImageCollection("LANDSAT/LC09/C02/T1_L2")

landsat_collection1 = ee.ImageCollection.merge(landsat5, landsat7)
landsat_collection2 = ee.ImageCollection.merge(landsat8, landsat9)
landsat_collection = ee.ImageCollection.merge(landsat_collection1, landsat_collection2) \
    .filterBounds(study_region) \
    .filter(ee.Filter.calendarRange(start_year, end_year, 'year')) \
    .filter(ee.Filter.calendarRange(start_month, end_month, 'month'))

# 云量和质量等级函数
# 云量小于20%-1级,20%到40%-2级,40%-60%-3级, 60%-80%-4级,大于80%-5级
def assign_quality(cloud_coverage):
    if 0 <= cloud_coverage < 20:
        return 1
    elif 20 <= cloud_coverage < 40:
        return 2
    elif 40 <= cloud_coverage < 60:
        return 3
    elif 60 <= cloud_coverage < 80:
        return 4
    elif 80 <= cloud_coverage <= 100:
        return 5
    else:
        return None

# 提取影像的日期和传感器信息
def extract_info(image):
    date = image.date().format('YYYY-MM-dd')
    satellite = image.get('SPACECRAFT_ID')
    sensor = image.get('SENSOR_ID')
    year = image.date().get('year')
    month = image.date().get('month')
    day = image.date().get('day')
    cloud_coverage = image.get('CLOUD_COVER')
    quality = ee.Algorithms.If(
        ee.Number(cloud_coverage).lt(20), 1,
        ee.Algorithms.If(ee.Number(cloud_coverage).lt(40), 2,
        ee.Algorithms.If(ee.Number(cloud_coverage).lt(60), 3,
        ee.Algorithms.If(ee.Number(cloud_coverage).lt(80), 4, 5))))
    imgID = image.id()

    return ee.Feature(None, {
        '成像日期': date,
        '卫星型号': satellite,
        '传感器名称': sensor,
        '影像年份': year,
        '影像月份': month,
        '当月日': day,
        '云量': cloud_coverage,
        '质量': quality,
        'GEEID': imgID
    })

# 应用函数并创建特征集合
image_data = landsat_collection.map(extract_info)
feature_collection = ee.FeatureCollection(image_data)

# 获取数据并转换为DataFrame
data = feature_collection.getInfo()
features = data['features']
records = []

for feature in features:
    records.append(feature['properties'])

# 创建DataFrame
df = pd.DataFrame(records)

# 导出为Excel文件
df.to_excel('./landsat_statistic.xlsx', index=False)
在这段代码中,我统计1990年-2020年北京市生长季(4-10月)的Landsat影像的信息,最总结果输出为'landsat_statistic.xlsx'的excel表格。
统计Sentinel影像的信息
统计Sentinel影像信息的代码与统计Landsat影像的代码思路是一致的,以下是详细代码:
python
import ee
import geemap
import pandas as pd
geemap.set_proxy(port=7778)
geemap.ee_initialize()
Map = geemap.Map()

# 加载研究区
json_path = './北京市.geojson'
study_region = geemap.geojson_to_ee(json_path)
bound = study_region.bounds()
start_year = 1990
end_year = 2020
start_month = 4
end_month = 10

# 创建Sentinel-2影像合集
s2Collection = (ee.ImageCollection("COPERNICUS/S2_SR_HARMONIZED")
                .filterBounds(study_region)
                .filter(ee.Filter.calendarRange(start_year, end_year, 'year'))
                .filter(ee.Filter.calendarRange(start_month, end_month, 'month'))
                )

# 云量和质量等级函数
def assign_quality(cloud_coverage):
    if 0 <= cloud_coverage < 20:
        return 1
    elif 20 <= cloud_coverage < 40:
        return 2
    elif 40 <= cloud_coverage < 60:
        return 3
    elif 60 <= cloud_coverage < 80:
        return 4
    elif 80 <= cloud_coverage <= 100:
        return 5
    else:
        return None

# 提取影像的日期和传感器信息
def extract_info(image):
    img_id = image.get('system:id')
    date = image.date().format('YYYY-MM-dd')
    year = image.date().get('year')
    month = image.date().get('month')
    day = image.date().get('day')
    doy = ee.Date(image.get('system:time_start')).getRelative('day','year').add(1)
    cloud_coverage = image.get('CLOUDY_PIXEL_PERCENTAGE')
    quality = ee.Algorithms.If(
        ee.Number(cloud_coverage).lt(20), 1,
        ee.Algorithms.If(ee.Number(cloud_coverage).lt(40), 2,
        ee.Algorithms.If(ee.Number(cloud_coverage).lt(60), 3,
        ee.Algorithms.If(ee.Number(cloud_coverage).lt(80), 4, 5))))

    return ee.Feature(None, {
        'ID': img_id,
        '成像日期': date,
        '影像年份': year,
        '影像月份': month,
        '当月日': day,
        '云量': cloud_coverage,
        '质量': quality,
        'doy': doy
    })

# 应用函数并创建特征集合
image_data = s2Collection.map(extract_info)
feature_collection = ee.FeatureCollection(image_data)

# 获取数据并转换为DataFrame
data = feature_collection.getInfo()
features = data['features']
records = []

for feature in features:
    records.append(feature['properties'])

# 创建DataFrame
df = pd.DataFrame(records)

# 导出为Excel文件
df.to_excel('./S2影像信息统计.xlsx', index=False)
这段代码同样统计了1990至2020年北京市生长季的Sentinel2的影像信息