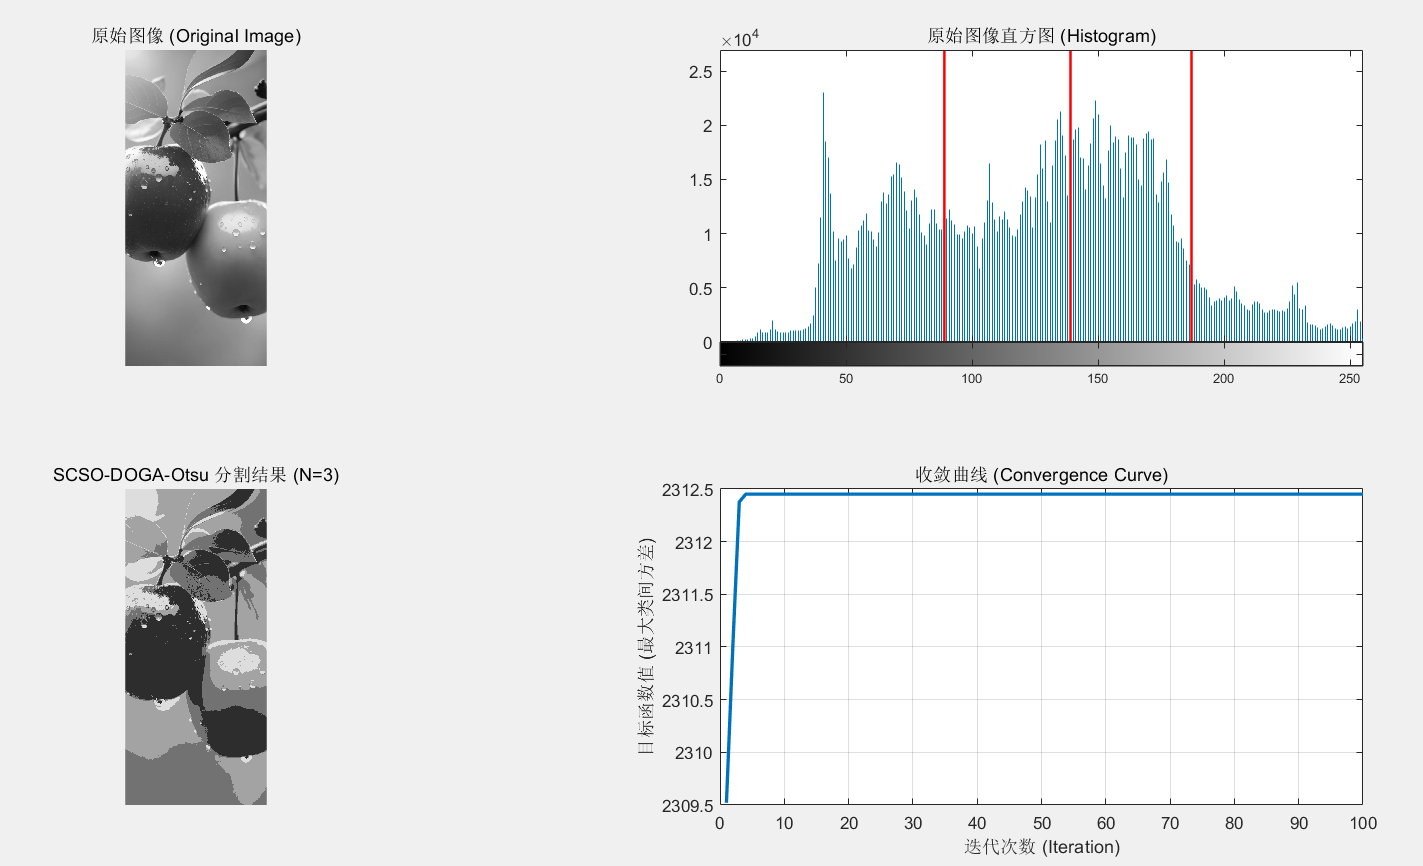
本文提出了一种基于改进沙猫群优化算法(SCSO-DOGA)的Otsu多阈值图像分割方法。首先初始化算法参数并加载图像,通过SCSO-DOGA优化器寻找最优阈值,其中目标函数为最大化类间方差。实验结果显示,该方法能有效找到最佳阈值并进行图像分割,同时提供收敛曲线分析算法性能。最后通过可视化对比原始图像、直方图和分割结果,验证了该方法的有效性。该算法适用于灰度图像的多阈值分割任务,具有较好的优化性能。
Matlab
% =========================================================================
% 主函数: 基于改进沙猫群优化算法(SCSO-DOGA)的Otsu多阈值图像分割
% Main Function: Otsu Multi-threshold Image Segmentation based on
% Improved Sand Cat Swarm Optimization (SCSO-DOGA)
% =========================================================================

clear;
close all;
clc;

%% 1. 参数设置 (Parameter Settings)
disp('正在初始化参数...');

% 优化算法参数
pop_size = 30;         % 种群数量 (Population size)
max_iter = 100;        % 最大迭代次数 (Max iterations)
n_thresholds = 3;      % 寻找的阈值数量 (Number of thresholds to find)
lb = 0;                % 搜索下界 (Lower bound for thresholds)
ub = 255;              % 搜索上界 (Upper bound for thresholds)

% 加载图像
img = imread('0.jpg'); % 您可以替换成自己的图像
if size(img, 3) > 1
    img = rgb2gray(img);
end

% 获取图像直方图
img_hist = imhist(img);
img_hist = img_hist'; % 转为行向量方便计算

%% 2. 运行 SCSO-DOGA 优化算法 (Run SCSO-DOGA Optimizer)
disp(['正在使用SCSO-DOGA寻找 ' num2str(n_thresholds) ' 个最佳阈值...']);

% 定义目标函数句柄
% 注意: 优化器通常是最小化, 而Otsu是最大化类间方差, 因此目标函数返回负值
obj_func = @(thresholds) OtsuObjectiveFunction(thresholds, img_hist);

% 调用SCSO-DOGA算法
[best_thresholds, best_fitness, convergence_curve] = SCSO_DOGA(obj_func, pop_size, max_iter, n_thresholds, lb, ub, img_hist);

% 最佳阈值和最大类间方差
best_thresholds = sort(round(best_thresholds));
max_variance = -best_fitness;

disp('优化完成!');
disp(['找到的最佳阈值: ' num2str(best_thresholds)]);
disp(['对应的最大类间方差: ' num2str(max_variance)]);

%% 3. 图像分割与结果展示 (Image Segmentation and Result Display)

% 根据找到的阈值进行分割
segmented_img = zeros(size(img));
thresholds = [lb, best_thresholds, ub];
for i = 1:length(thresholds)-1
    % 定义每个分割区间的灰度值
    segment_value = (thresholds(i) + thresholds(i+1)) / 2;
    % 找到属于该区间的像素
    mask = (img > thresholds(i)) & (img <= thresholds(i+1));
    segmented_img(mask) = segment_value;
end

% 显示结果
figure;
subplot(2, 2, 1);
imshow(img);
title('原始图像 (Original Image)');

subplot(2, 2, 2);
imhist(img);
title('原始图像直方图 (Histogram)');
hold on;
% 在直方图上标记找到的阈值
for i = 1:length(best_thresholds)
    line([best_thresholds(i), best_thresholds(i)], ylim, 'Color', 'r', 'LineWidth', 1.5);
end
hold off;

subplot(2, 2, 3);
imshow(uint8(segmented_img));
title(['SCSO-DOGA-Otsu 分割结果 (N=' num2str(n_thresholds) ')']);

subplot(2, 2, 4);
plot(1:max_iter, -convergence_curve, 'LineWidth', 2);
title('收敛曲线 (Convergence Curve)');
xlabel('迭代次数 (Iteration)');
ylabel('目标函数值 (最大类间方差)');
grid on;