【MySQL】MySQL 有效利用 profile 分析 SQL 语句的执行过程
在日常的工作中,我们通常要分析 SQL 语句的性能,通过会使用到执行计划,利用执行计划来分析 SQL 语句的性能,并进行相应的优化;本文将利用 profile 分析 SQL 语句的执行过程来辅助的分析 SQL 语句,做好优化;
本文描述了如何使用 MySQL profile 以及利用 Performance_Schema 来查询 profile 的 SQL 执行过程的样例;
一、有关 profile 的描述
1、查看 profiling 系统变量
sql
root@localhost [wjq]>show variables like '%profil%';
+------------------------+-------+
| Variable_name          | Value |
+------------------------+-------+
| have_profiling         | YES   |
| profiling              | OFF   |
| profiling_history_size | 15    |
+------------------------+-------+
3 rows in set (0.00 sec)
参数说明:
-
have_profiling:只读变量,用于控制是否有系统变量开启或关闭 profiling
-
profiling:开启或关系 SQ L语句剖析功能
-
profiling_history_size:设置保留 profiling 的数据,默认是 15,范围为 0~100,0 表示将禁用 profiling
2、获取 profiling 的帮助信息
sql
root@localhost [wjq]>help profile
Name: 'SHOW PROFILE'
Description:
Syntax:
SHOW PROFILE [type [, type] ... ]
    [FOR QUERY n]
    [LIMIT row_count [OFFSET offset]]

type:
    ALL                 #显示所有的开销信息
  | BLOCK IO            #显示块IO的开销信息
  | CONTEXT SWITCHES    #上下文切换开销信息
  | CPU                 #显示CPU相关开销信息
  | IPC                 #显示发送和接受相关开销信息
  | MEMORY              #显示内存相关开销信息
  | PAGE FAULTS         #显示页面错误相关开销信息
  | SOURCE              #显示和source_funcation、source_file、source_line相关的开销信息
  | SWAPS               #显示交换次数相关开销信息

The SHOW PROFILE and SHOW PROFILES statements display profiling
information that indicates resource usage for statements executed
during the course of the current session.
3、开启 porfiling
启用 session 级别的 profiling
sql
root@localhost [wjq]>SET profiling = 1;
Query OK, 0 rows affected, 1 warning (0.00 sec)

root@localhost [wjq]>show variables like '%profil%';
+------------------------+-------+
| Variable_name          | Value |
+------------------------+-------+
| have_profiling         | YES   |
| profiling              | ON    |
| profiling_history_size | 15    |
+------------------------+-------+
3 rows in set (0.01 sec)
4、执行 SQL 查询
sql
root@localhost [wjq]>select count(*) from wjq_innodb_count2;
+----------+
| count(*) |
+----------+
|        4 |
+----------+
1 row in set (0.00 sec)

root@localhost [wjq]>select count(*) from wjq_innodb_count1;
+----------+
| count(*) |
+----------+
|   100001 |
+----------+
1 row in set (0.04 sec)
5、查看当前 session 所有已产生的 profile
sql
root@localhost [wjq]>show profiles;
+----------+------------+----------------------------------------+
| Query_ID | Duration   | Query                                  |
+----------+------------+----------------------------------------+
|        1 | 0.00156350 | show variables like '%profil%'         |
|        2 | 0.00023575 | select count(*) from wjq_innodb_count2 |
|        3 | 0.03346325 | select count(*) from wjq_innodb_count1 |
+----------+------------+----------------------------------------+
3 rows in set, 1 warning (0.00 sec)
发现有一个告警信息
sql
root@localhost [wjq]>show warnings\G;
*************************** 1. row ***************************
  Level: Warning
   Code: 1287
Message: 'SHOW PROFILES' is deprecated and will be removed in a future release. Please use Performance Schema instead
1 row in set (0.00 sec)
告警是说 SHOW PROFILES 命令将来会被 Performance_Schema 替换掉。关于利用 Performance_Schema 来查询 profile 将在文章第二部分进行介绍;
6、获取 SQL 语句的开销信息
开启 profiling 后,我们可以通过 show profile 等方式查看,其实这些开销信息被记录到 information_schema.profiling 表中。注 show profile 之类的语句不会被 profiling,即自身不会产生 Profiling。
我们下面的这个 show profile 查看的是 show warnings 产生的相应开销。
sql
root@localhost [wjq]>show profile;
+----------------+----------+
| Status         | Duration |
+----------------+----------+
| starting       | 0.000051 |
| query end      | 0.000005 |
| closing tables | 0.000006 |
| freeing items  | 0.000009 |
| cleaning up    | 0.000012 |
+----------------+----------+
5 rows in set, 1 warning (0.00 sec)
7、获取指定查询的开销(Druation 表示持续时间)
sql
root@localhost [wjq]>show profile for query 3;
+----------------------+----------+
| Status               | Duration |
+----------------------+----------+
| starting             | 0.000067 |
| checking permissions | 0.000007 |
| Opening tables       | 0.000017 |
| init                 | 0.000013 |
| System lock          | 0.000008 |
| optimizing           | 0.000004 |
| statistics           | 0.000013 |
| preparing            | 0.000011 |
| executing            | 0.000003 |
| Sending data         | 0.033256 |
| end                  | 0.000010 |
| query end            | 0.000011 |
| closing tables       | 0.000013 |
| freeing items        | 0.000018 |
| cleaning up          | 0.000014 |
+----------------------+----------+
15 rows in set, 1 warning (0.00 sec)
输入说明
-
Sending data :这个状态的名称很具有误导性,所谓的"
Sending data"并不是单纯的发送数据,而是包括"收集 + 发送数据"。 -
query end:表示语句执行完毕了,但是还有一些后续工作没做完时的状态。
-
freeing items:释放查询缓存里面的空间,如果是 DML 操作,所以相应的缓存里的记录就无效了,所以需要有这一步做处理。
查看所有开销
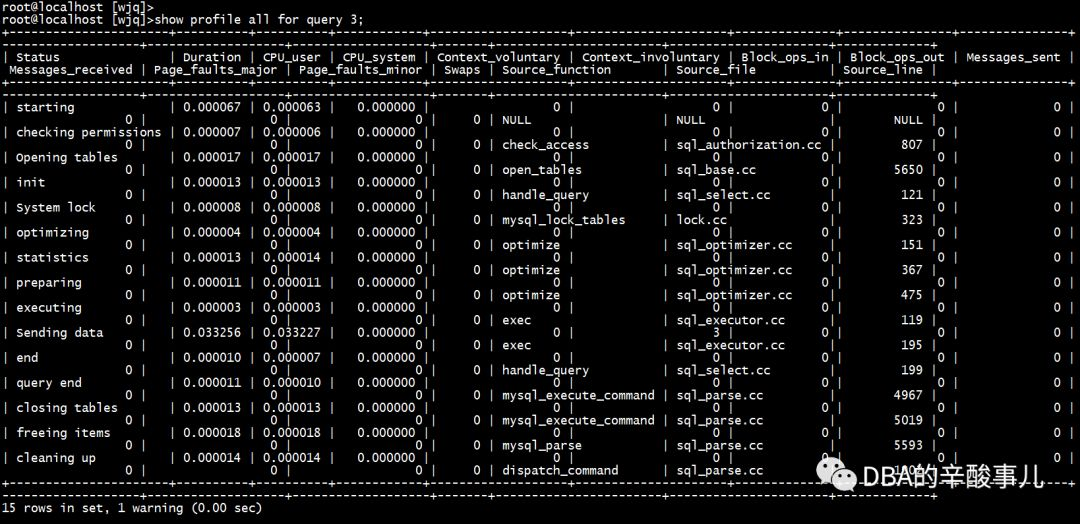
查看特定部分的开销,如下为 CPU 部分的开销
sql
root@localhost [wjq]>show profile cpu for query 3;
+----------------------+----------+----------+------------+
| Status               | Duration | CPU_user | CPU_system |
+----------------------+----------+----------+------------+
| starting             | 0.000067 | 0.000063 |   0.000000 |
| checking permissions | 0.000007 | 0.000006 |   0.000000 |
| Opening tables       | 0.000017 | 0.000017 |   0.000000 |
| init                 | 0.000013 | 0.000013 |   0.000000 |
| System lock          | 0.000008 | 0.000008 |   0.000000 |
| optimizing           | 0.000004 | 0.000004 |   0.000000 |
| statistics           | 0.000013 | 0.000014 |   0.000000 |
| preparing            | 0.000011 | 0.000011 |   0.000000 |
| executing            | 0.000003 | 0.000003 |   0.000000 |
| Sending data         | 0.033256 | 0.033227 |   0.000000 |
| end                  | 0.000010 | 0.000007 |   0.000000 |
| query end            | 0.000011 | 0.000010 |   0.000000 |
| closing tables       | 0.000013 | 0.000013 |   0.000000 |
| freeing items        | 0.000018 | 0.000018 |   0.000000 |
| cleaning up          | 0.000014 | 0.000014 |   0.000000 |
+----------------------+----------+----------+------------+
15 rows in set, 1 warning (0.00 sec)
查看 MEMORY 部分的开销
sql
root@localhost [wjq]>show profile memory for query 3;
+----------------------+----------+
| Status               | Duration |
+----------------------+----------+
| starting             | 0.000067 |
| checking permissions | 0.000007 |
| Opening tables       | 0.000017 |
| init                 | 0.000013 |
| System lock          | 0.000008 |
| optimizing           | 0.000004 |
| statistics           | 0.000013 |
| preparing            | 0.000011 |
| executing            | 0.000003 |
| Sending data         | 0.033256 |
| end                  | 0.000010 |
| query end            | 0.000011 |
| closing tables       | 0.000013 |
| freeing items        | 0.000018 |
| cleaning up          | 0.000014 |
+----------------------+----------+
15 rows in set, 1 warning (0.00 sec)
同时查看不同资源开销
sql
root@localhost [wjq]>show profile block io,cpu,memory for query 3;
+----------------------+----------+----------+------------+--------------+---------------+
| Status               | Duration | CPU_user | CPU_system | Block_ops_in | Block_ops_out |
+----------------------+----------+----------+------------+--------------+---------------+
| starting             | 0.000067 | 0.000063 |   0.000000 |            0 |             0 |
| checking permissions | 0.000007 | 0.000006 |   0.000000 |            0 |             0 |
| Opening tables       | 0.000017 | 0.000017 |   0.000000 |            0 |             0 |
| init                 | 0.000013 | 0.000013 |   0.000000 |            0 |             0 |
| System lock          | 0.000008 | 0.000008 |   0.000000 |            0 |             0 |
| optimizing           | 0.000004 | 0.000004 |   0.000000 |            0 |             0 |
| statistics           | 0.000013 | 0.000014 |   0.000000 |            0 |             0 |
| preparing            | 0.000011 | 0.000011 |   0.000000 |            0 |             0 |
| executing            | 0.000003 | 0.000003 |   0.000000 |            0 |             0 |
| Sending data         | 0.033256 | 0.033227 |   0.000000 |            0 |             0 |
| end                  | 0.000010 | 0.000007 |   0.000000 |            0 |             0 |
| query end            | 0.000011 | 0.000010 |   0.000000 |            0 |             0 |
| closing tables       | 0.000013 | 0.000013 |   0.000000 |            0 |             0 |
| freeing items        | 0.000018 | 0.000018 |   0.000000 |            0 |             0 |
| cleaning up          | 0.000014 | 0.000014 |   0.000000 |            0 |             0 |
+----------------------+----------+----------+------------+--------------+---------------+
15 rows in set, 1 warning (0.00 sec)
8、INFORMATION_SCHEMA.PROFILING
上面已经看到了,show profile 命令即将移除,所以可以直接去 information_schema.profiling 表查看,灵活度更大,其表结构信息如下:
sql
root@localhost [information_schema]>desc profiling;
+---------------------+--------------+------+-----+----------+-------+
| Field               | Type         | Null | Key | Default  | Extra |
+---------------------+--------------+------+-----+----------+-------+
| QUERY_ID            | int(20)      | NO   |     | 0        |       |
| SEQ                 | int(20)      | NO   |     | 0        |       |
| STATE               | varchar(30)  | NO   |     |          |       |
| DURATION            | decimal(9,6) | NO   |     | 0.000000 |       |
| CPU_USER            | decimal(9,6) | YES  |     | NULL     |       |
| CPU_SYSTEM          | decimal(9,6) | YES  |     | NULL     |       |
| CONTEXT_VOLUNTARY   | int(20)      | YES  |     | NULL     |       |
| CONTEXT_INVOLUNTARY | int(20)      | YES  |     | NULL     |       |
| BLOCK_OPS_IN        | int(20)      | YES  |     | NULL     |       |
| BLOCK_OPS_OUT       | int(20)      | YES  |     | NULL     |       |
| MESSAGES_SENT       | int(20)      | YES  |     | NULL     |       |
| MESSAGES_RECEIVED   | int(20)      | YES  |     | NULL     |       |
| PAGE_FAULTS_MAJOR   | int(20)      | YES  |     | NULL     |       |
| PAGE_FAULTS_MINOR   | int(20)      | YES  |     | NULL     |       |
| SWAPS               | int(20)      | YES  |     | NULL     |       |
| SOURCE_FUNCTION     | varchar(30)  | YES  |     | NULL     |       |
| SOURCE_FILE         | varchar(20)  | YES  |     | NULL     |       |
| SOURCE_LINE         | int(20)      | YES  |     | NULL     |       |
+---------------------+--------------+------+-----+----------+-------+
18 rows in set (0.00 sec)
下面的 SQL 语句用于查询 query_id 为 3 的 SQL 开销,且按最大耗用时间倒序排列
sql
root@localhost [information_schema]>set @query_id=3;
Query OK, 0 rows affected (0.00 sec)

root@localhost [information_schema]>SELECT STATE, SUM(DURATION) AS Total_R,
    -> ROUND(
    ->    100 * SUM(DURATION) /
    ->      (SELECT SUM(DURATION)
    ->           FROM INFORMATION_SCHEMA.PROFILING
    ->           WHERE QUERY_ID = @query_id
    ->       ), 2) AS Pct_R,
    ->    COUNT(*) AS Calls,
    ->    SUM(DURATION) / COUNT(*) AS "R/Call"
    -> FROM INFORMATION_SCHEMA.PROFILING
    -> WHERE QUERY_ID = @query_id
    -> GROUP BY STATE
    -> ORDER BY Total_R DESC;
+----------------------+----------+-------+-------+--------------+
| STATE                | Total_R  | Pct_R | Calls | R/Call       |
+----------------------+----------+-------+-------+--------------+
| Sending data         | 0.033256 | 99.38 |     1 | 0.0332560000 |
| starting             | 0.000067 |  0.20 |     1 | 0.0000670000 |
| freeing items        | 0.000018 |  0.05 |     1 | 0.0000180000 |
| Opening tables       | 0.000017 |  0.05 |     1 | 0.0000170000 |
| cleaning up          | 0.000014 |  0.04 |     1 | 0.0000140000 |
| statistics           | 0.000013 |  0.04 |     1 | 0.0000130000 |
| init                 | 0.000013 |  0.04 |     1 | 0.0000130000 |
| closing tables       | 0.000013 |  0.04 |     1 | 0.0000130000 |
| query end            | 0.000011 |  0.03 |     1 | 0.0000110000 |
| preparing            | 0.000011 |  0.03 |     1 | 0.0000110000 |
| end                  | 0.000010 |  0.03 |     1 | 0.0000100000 |
| System lock          | 0.000008 |  0.02 |     1 | 0.0000080000 |
| checking permissions | 0.000007 |  0.02 |     1 | 0.0000070000 |
| optimizing           | 0.000004 |  0.01 |     1 | 0.0000040000 |
| executing            | 0.000003 |  0.01 |     1 | 0.0000030000 |
+----------------------+----------+-------+-------+--------------+
15 rows in set, 16 warnings (0.01 sec)
停止 profile,可以设置 profiling 参数,或者在 session 退出之后, profiling 会被自动关闭。
关于show profile的使用详细可参考:https://dev.mysql.com/doc/refman/5.7/en/show-profile.html
二、利用 Performance_Schema 来查询 profile
第一部分中介绍了,输出 show profiles 会有一个告警信息;告警信息内容已经过期即将在未来版本中删除,那么我们来看看新版本中推荐的 performace_schema 如何使用。先切换到 performance_schema 下,这是 MySQL 新增的性能优化引擎,在 5.6 以前是关闭的,5.6, 5.7 中是默认开启的,5.7 切换的时候还会有一句提示:
sql
root@localhost [(none)]>use performance_schema;
Reading table information for completion of table and column names
You can turn off this feature to get a quicker startup with -A
提示我们在连接 MySQL 的时候可以使用 -A 参数预读数据库。
使用profile涉及几个表,setup_actors、setup_instruments、setup_consumers。默认表 setup_actors 的内容如下:
sql
root@localhost [performance_schema]>select * from setup_actors;
+------+------+------+---------+---------+
| HOST | USER | ROLE | ENABLED | HISTORY |
+------+------+------+---------+---------+
| %    | %    | %    | YES     | YES     |
+------+------+------+---------+---------+
1 row in set (0.00 sec)
按照官方的建议,默认是启用,可以根据需求禁用。
sql
root@localhost [performance_schema]>update performance_schema.setup_actors set enabled='no',history='no' where user='%' and host='%';
Query OK, 1 row affected (0.00 sec)
Rows matched: 1  Changed: 1  Warnings: 0
禁用后的结果如下:
sql
root@localhost [performance_schema]>select * from setup_actors;
+------+------+------+---------+---------+
| HOST | USER | ROLE | ENABLED | HISTORY |
+------+------+------+---------+---------+
| %    | %    | %    | NO      | NO      |
+------+------+------+---------+---------+
1 row in set (0.00 sec)
然后加入指定的用户
sql
root@localhost [performance_schema]>insert into performance_schema.setup_actors values('localhost','root','%','YES','YES');
Query OK, 1 row affected (0.00 sec)

root@localhost [performance_schema]>select * from setup_actors;
+-----------+------+------+---------+---------+
| HOST      | USER | ROLE | ENABLED | HISTORY |
+-----------+------+------+---------+---------+
| %         | %    | %    | NO      | NO      |
| localhost | root | %    | YES     | YES     |
+-----------+------+------+---------+---------+
2 rows in set (0.00 sec)好了,setup_actors 的配置就这样,另外两个表的内容修改也是大同小异。
- 表
setup_consumers描述各种事件, - 表
setup_instruments描述这个数据库下的表名以及是否开启监控。
我统计了一下,两个表的默认数据还不少。
setup_instruments1028 rowssetup_consumers15 rows
下面我们按照官方的建议来修改,可以看到修改的不是一行,而是相关的很多行。
sql
root@localhost [performance_schema]>UPDATE performance_schema.setup_instruments SET ENABLED = 'YES', TIMED = 'YES'
    -> WHERE NAME LIKE '%statement/%';
Query OK, 0 rows affected (0.00 sec)
Rows matched: 193  Changed: 0  Warnings: 0

root@localhost [performance_schema]>UPDATE performance_schema.setup_instruments SET ENABLED = 'YES', TIMED = 'YES'
    -> WHERE NAME LIKE '%stage/%';
Query OK, 123 rows affected (0.00 sec)
Rows matched: 132  Changed: 123  Warnings: 0

root@localhost [performance_schema]>UPDATE performance_schema.setup_consumers SET ENABLED = 'YES'
    -> WHERE NAME LIKE '%events_statements_%';
Query OK, 1 row affected (0.00 sec)
Rows matched: 3  Changed: 1  Warnings: 0

root@localhost [performance_schema]>UPDATE performance_schema.setup_consumers SET ENABLED = 'YES'
    -> WHERE NAME LIKE '%events_stages_%';
Query OK, 3 rows affected (0.00 sec)
Rows matched: 3  Changed: 3  Warnings: 0
OK,配置完成;
下面我们来看一下具体要怎么用:
1、切换到 wjq 数据库
sql
root@localhost [performance_schema]>use wjq;
Reading table information for completion of table and column names
You can turn off this feature to get a quicker startup with -A
Database changed
root@localhost [wjq]>
2、创建一个测试表 test_profile,插入几行数据
sql
root@localhost [wjq]>create table test_profile as select * from information_schema.columns limit 1,5;
ERROR 1786 (HY000): Statement violates GTID consistency: CREATE TABLE ... SELECT.

root@localhost [wjq]>create table test_profile like information_schema.columns;
Query OK, 0 rows affected (0.00 sec)

root@localhost [wjq]>insert into test_profile select * from information_schema.columns limit 1,5;
Query OK, 5 rows affected (0.06 sec)
Records: 5  Duplicates: 0  Warnings: 0
3、运行语句来得到一些详细的统计信息。
sql
root@localhost [wjq]>select * from test.test_profile limit 1,2 \G
ERROR 1146 (42S02): Table 'test.test_profile' doesn't exist
root@localhost [wjq]>
root@localhost [wjq]>select * from test_profile limit 1,2 \G;
*************************** 1. row ***************************
           TABLE_CATALOG: def
            TABLE_SCHEMA: information_schema
              TABLE_NAME: CHARACTER_SETS
             COLUMN_NAME: DESCRIPTION
        ORDINAL_POSITION: 3
          COLUMN_DEFAULT:
             IS_NULLABLE: NO
               DATA_TYPE: varchar
CHARACTER_MAXIMUM_LENGTH: 60
  CHARACTER_OCTET_LENGTH: 180
       NUMERIC_PRECISION: NULL
           NUMERIC_SCALE: NULL
      DATETIME_PRECISION: NULL
      CHARACTER_SET_NAME: utf8
          COLLATION_NAME: utf8_general_ci
             COLUMN_TYPE: varchar(60)
              COLUMN_KEY:
                   EXTRA:
              PRIVILEGES: select
          COLUMN_COMMENT:
   GENERATION_EXPRESSION:
*************************** 2. row ***************************
           TABLE_CATALOG: def
            TABLE_SCHEMA: information_schema
              TABLE_NAME: CHARACTER_SETS
             COLUMN_NAME: MAXLEN
        ORDINAL_POSITION: 4
          COLUMN_DEFAULT: 0
             IS_NULLABLE: NO
               DATA_TYPE: bigint
CHARACTER_MAXIMUM_LENGTH: NULL
  CHARACTER_OCTET_LENGTH: NULL
       NUMERIC_PRECISION: 19
           NUMERIC_SCALE: 0
      DATETIME_PRECISION: NULL
      CHARACTER_SET_NAME: NULL
          COLLATION_NAME: NULL
             COLUMN_TYPE: bigint(3)
              COLUMN_KEY:
                   EXTRA:
              PRIVILEGES: select
          COLUMN_COMMENT:
   GENERATION_EXPRESSION:
2 rows in set (0.00 sec)
4、根据下面的语句查询一个历史表,从表名可以看出是和事件相关的,感觉越来越像 Oracle 了
sql
root@localhost [wjq]>SELECT EVENT_ID, TRUNCATE(TIMER_WAIT/1000000000000,6) as Duration, SQL_TEXT
    -> FROM performance_schema.events_statements_history_long
    -> WHERE SQL_TEXT like '%limit 1,2%';
+----------+----------+-------------------------------------------+
| EVENT_ID | Duration | SQL_TEXT                                  |
+----------+----------+-------------------------------------------+
|    13818 | 0.000174 | select * from test.test_profile limit 1,2 |
|    13826 | 0.000324 | select * from test_profile limit 1,2      |
+----------+----------+-------------------------------------------+
2 rows in set (0.00 sec)我们通过上面的语句可以得到一个概览,对应的事件和执行时间。然后到stage相关的历史表中查看事件的详细信息,这就是我们期望的性能数据。如此一来应该就明白上面的配置表中所要做的工作是什么意思了。
sql
root@localhost [wjq]>SELECT event_name AS Stage, TRUNCATE(TIMER_WAIT/1000000000000,6) AS Duration
    -> FROM performance_schema.events_stages_history_long
    -> WHERE NESTING_EVENT_ID=13826;
+--------------------------------+----------+
| Stage                          | Duration |
+--------------------------------+----------+
| stage/sql/starting             | 0.000079 |
| stage/sql/checking permissions | 0.000007 |
| stage/sql/Opening tables       | 0.000020 |
| stage/sql/init                 | 0.000039 |
| stage/sql/System lock          | 0.000009 |
| stage/sql/optimizing           | 0.000002 |
| stage/sql/statistics           | 0.000017 |
| stage/sql/preparing            | 0.000012 |
| stage/sql/executing            | 0.000000 |
| stage/sql/Sending data         | 0.000094 |
| stage/sql/end                  | 0.000001 |
| stage/sql/query end            | 0.000010 |
| stage/sql/closing tables       | 0.000009 |
| stage/sql/freeing items        | 0.000013 |
| stage/sql/cleaning up          | 0.000001 |
+--------------------------------+----------+
15 rows in set (0.00 sec)
整体来看,看到这个特性的输出,十分类似于 Oracle 中的 Datapump,输出实在是太像了,很有条理。