The paired t-test | explained with a sample example
Basic Definition
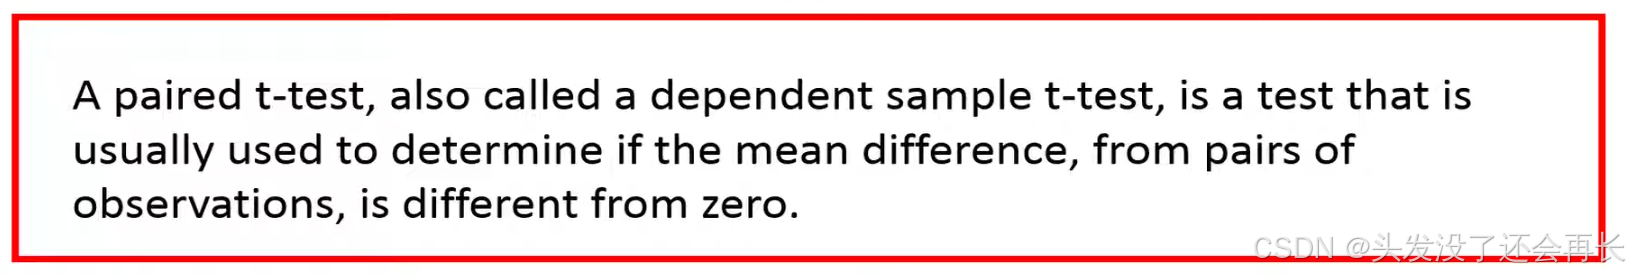
Example 1
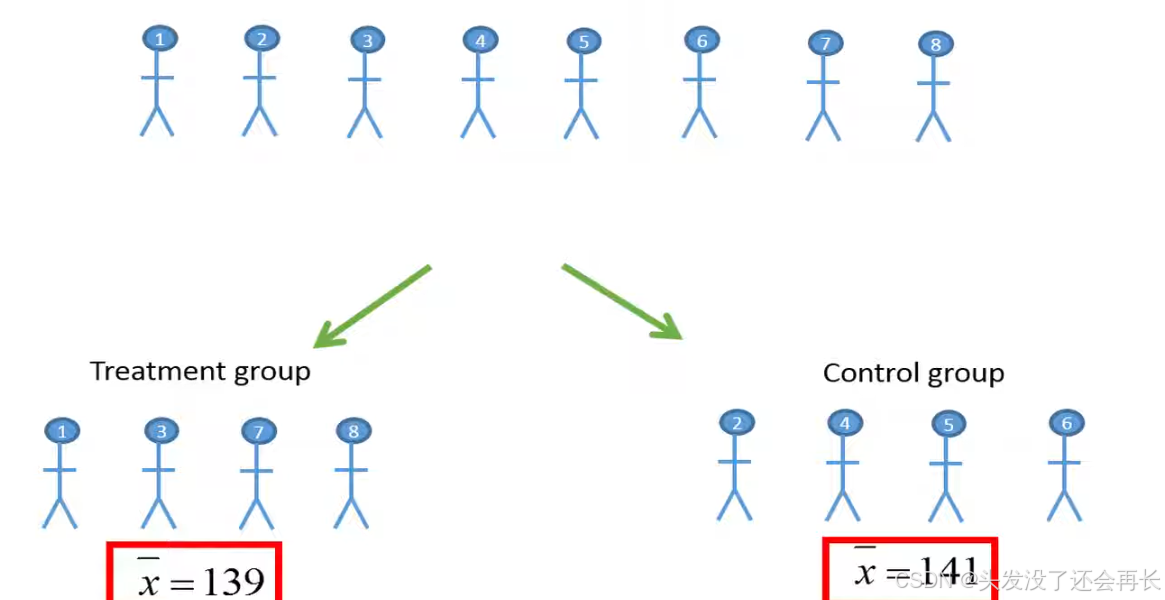
Let's say that we have collected eight individuals and would like to test new drug which is supposed to reduce the systolic blood pressure to test if the drug has an effect.
One could randomly assign the individuals into a treatment group and a control group due to chance person number 1 3 7 and eight were placed in the drug treatment group whereas person number 2, 4, 5 and six were placed in the control group. The individuals in the control group will not receive the drug instead these individuals might receive a place treatment.
After some some time we measure the blood pressure of the individuals and compare the mean historic blood pressure between the two groups . Since the individuals in the two groups are independent an unpaired teat test would be appropriate which could be used to test if there is a difference in the mean total blood pressure between the two groups.
Another strategy could be to pair the individuals based on the current historic blood pressure and gender. These number represents systolic blood pressures for the eight individuals before the treatment.
We have four men and four women for example we could pair person number one and eight who have a similar blood pressure and they both men .
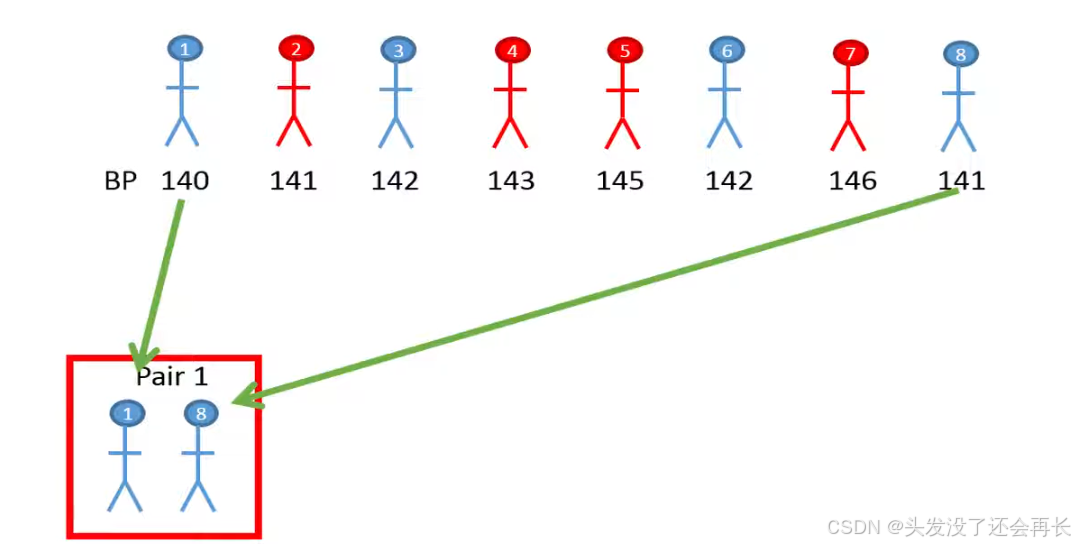
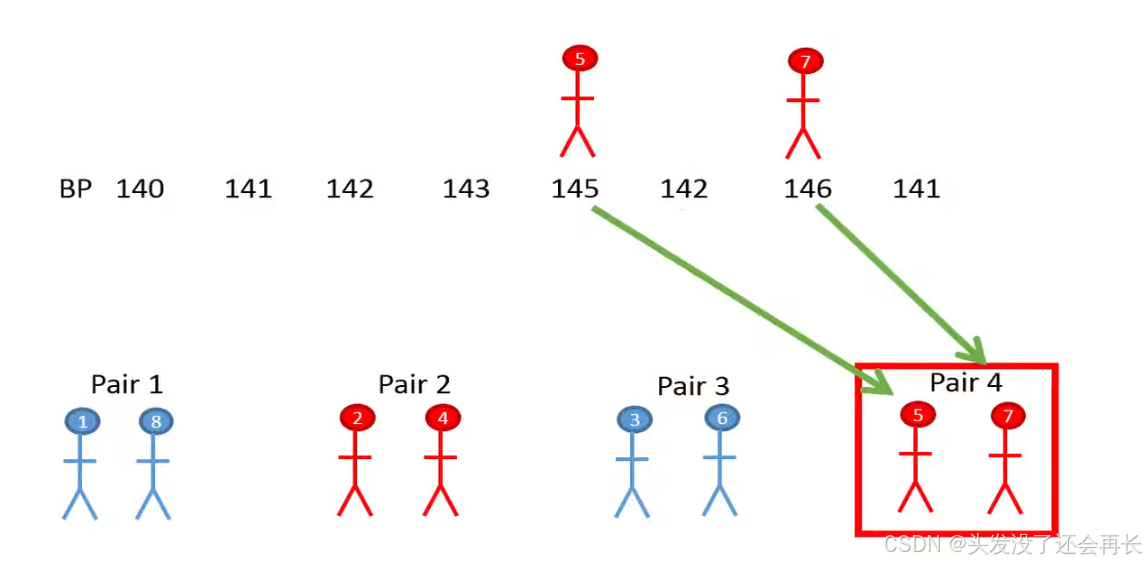
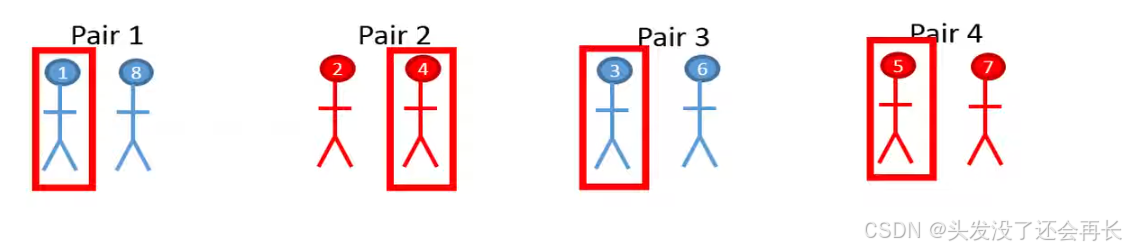
We could then randomly assign which person in the pairs who should get the drug treatment.
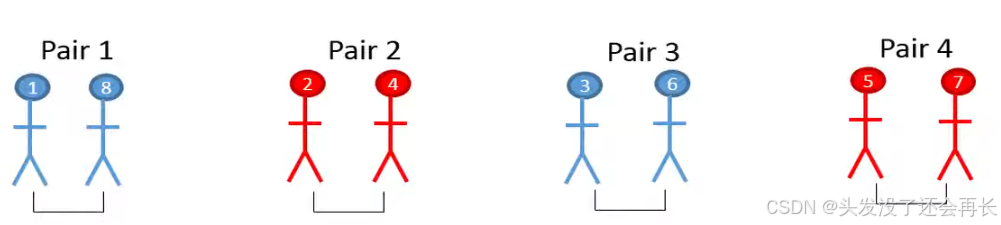
After some times, we check the difference in systolic blood pressure between the pairs , the advantage of this study design is that we will reduce the variability between people since we look at the differ difference between similar individuals.
For this type of study design a pair t-test would be appropriate because we have observations based on paired individuals .
Example 2:
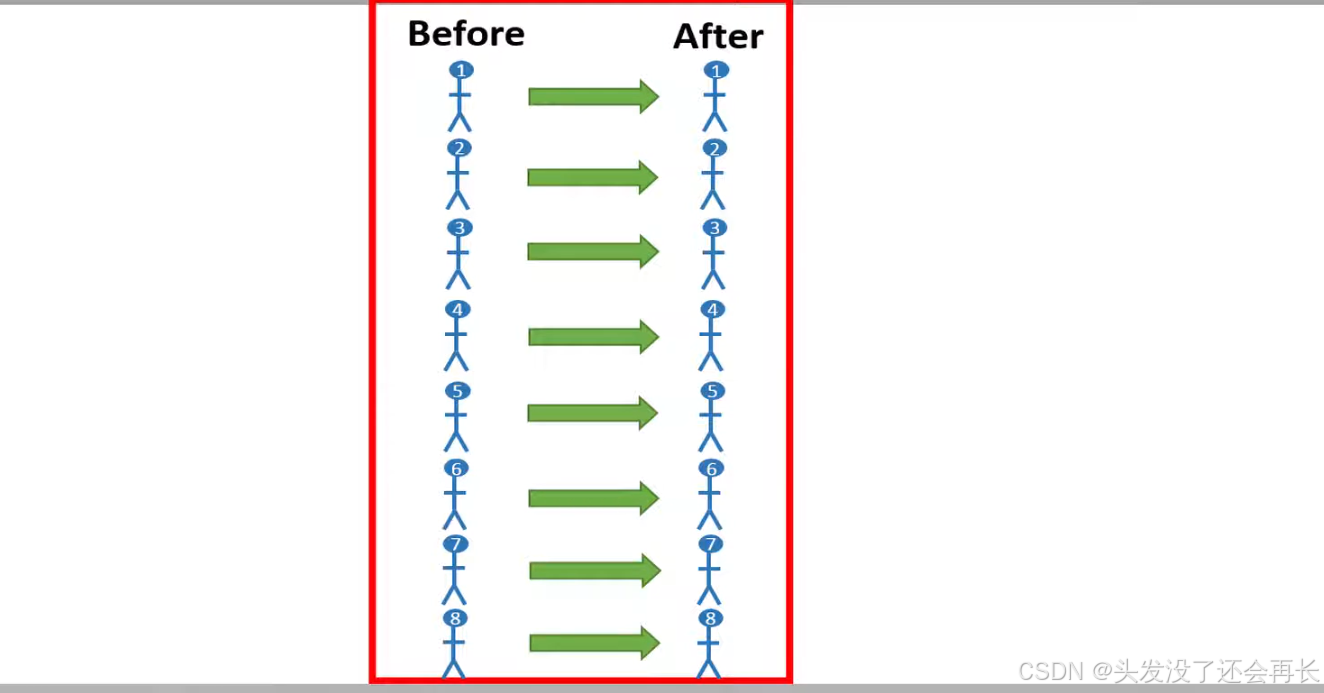
Another common type of paired study design is the so-called before and after studies .
For example I could measure the historic blood pressure of all 8 individuals before taking the drug , and then measure the systolic blood pressure on the same individuals after a certain time since the start of the drug treatment.
We would then calculate the deference in the systolic blood pressure before and after. The data from such before and after design would be appropriate for a paired t-test since the data comes from paired measurements on the same individuals .
Example 3:
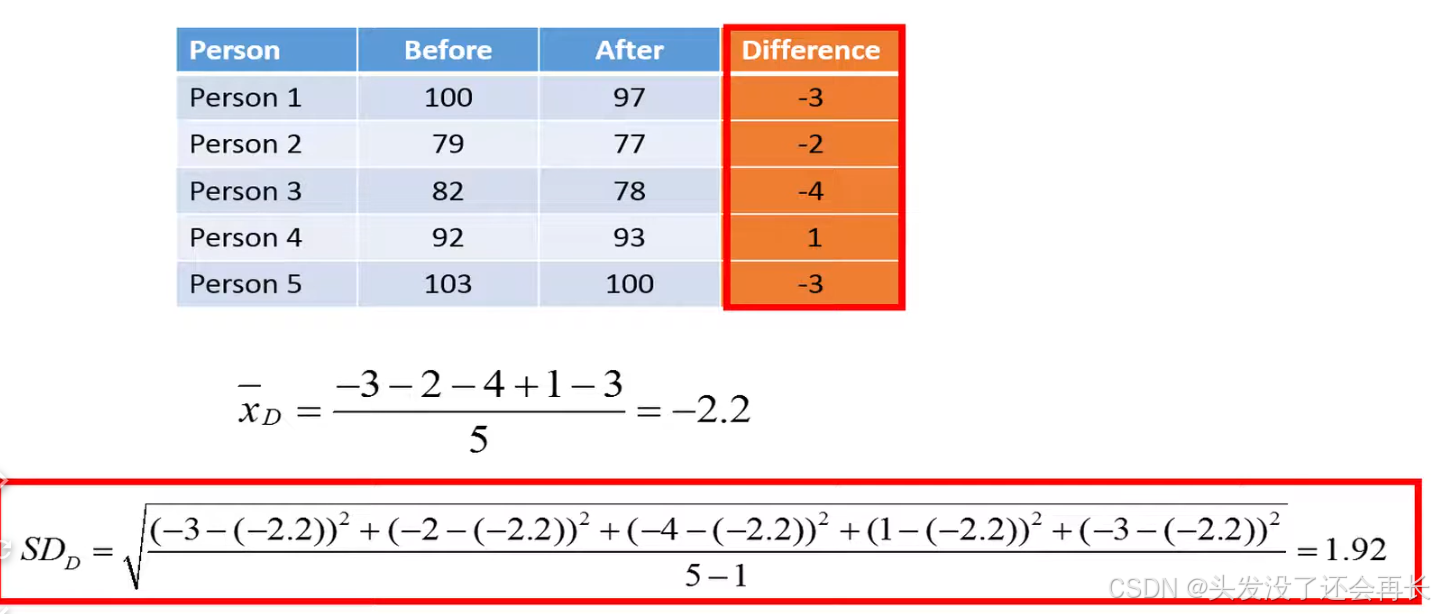
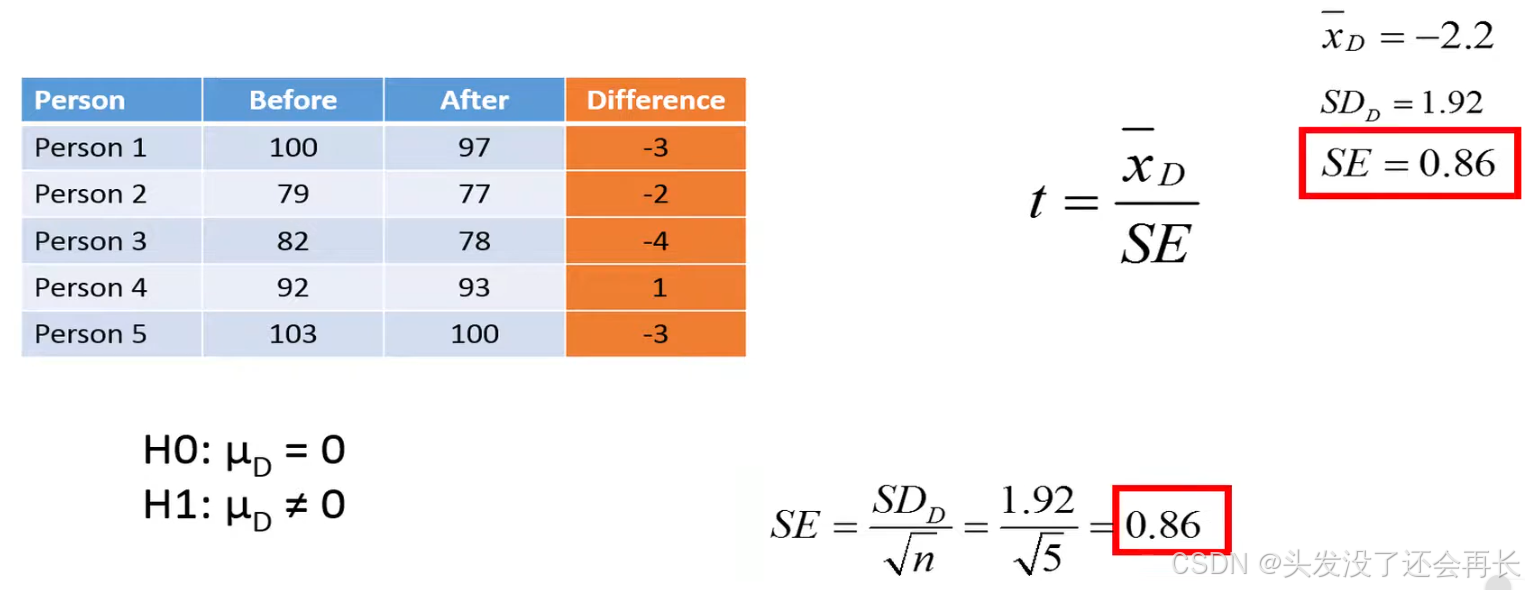
We'll hear use some example data on weights in kilos before and after five individuals have tried a new diet for 3 weeks the differences in weight before and after are shown in last column.
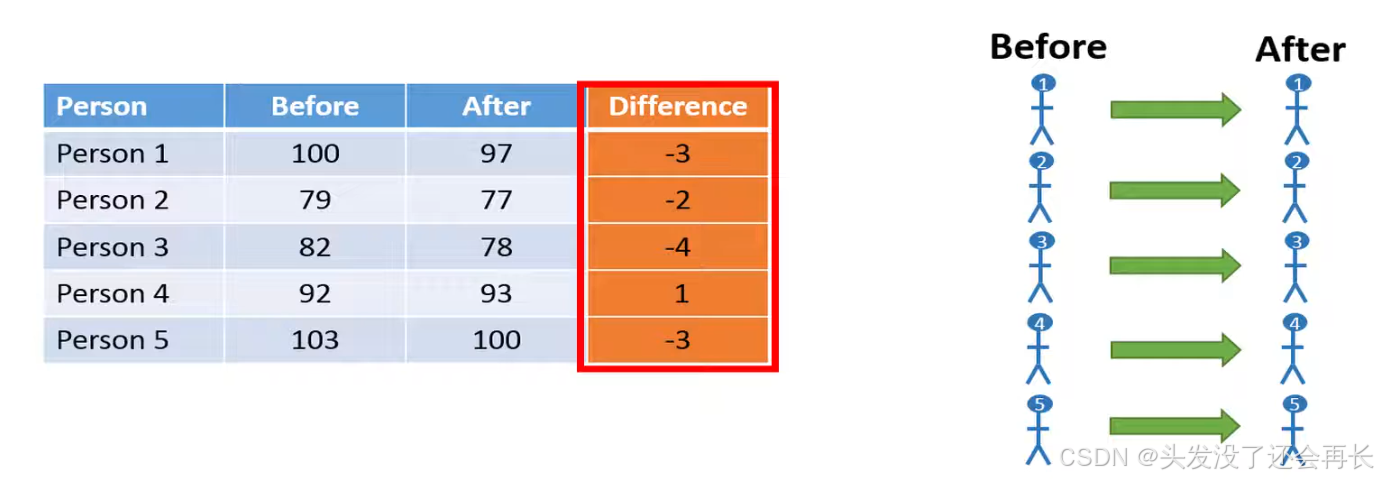
We then calculate the mean of these differences we see that on average the five individuals have lost 2.2 kilos of their diet let's also calculate the standard deviation of the differences which in this case results in a value 1.92.
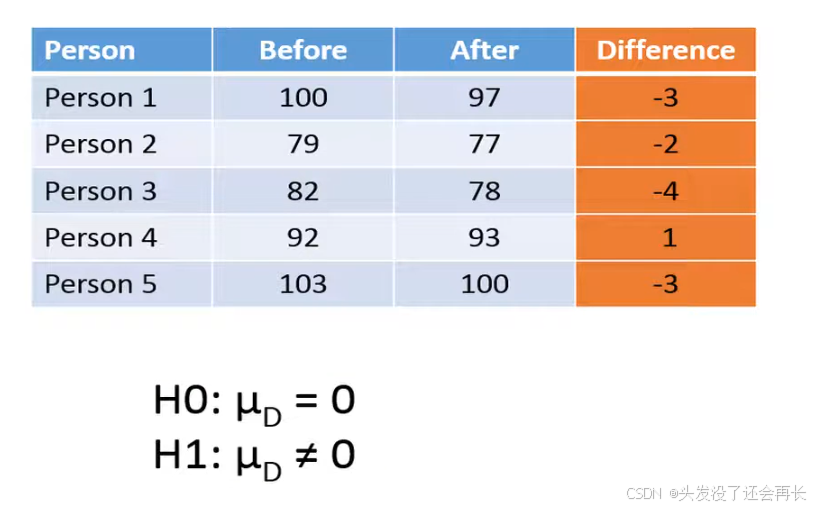
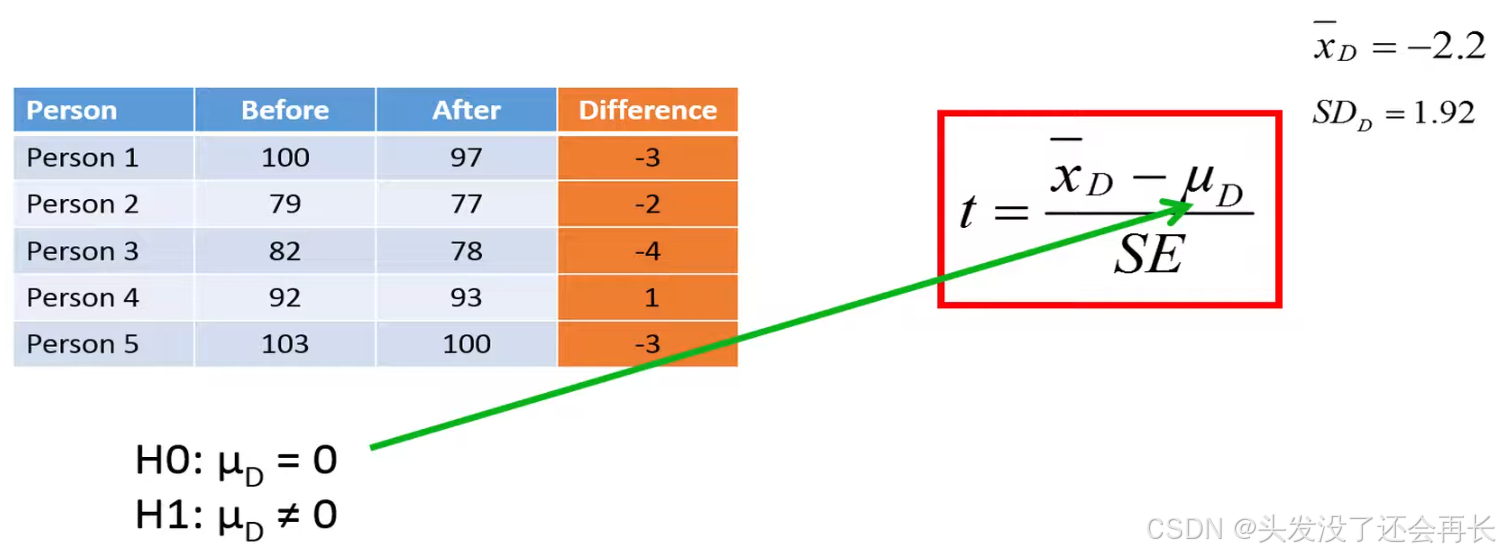
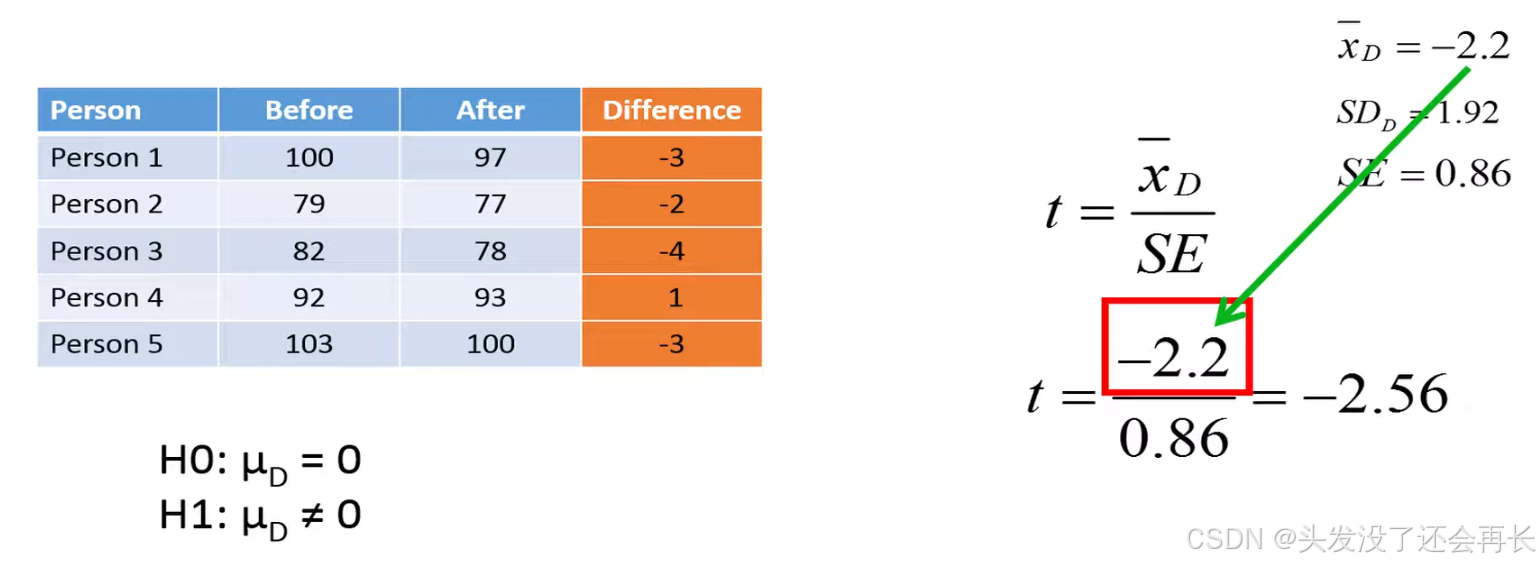
We'll now use the pair t-test to determine if you should reject the null hypothesis or not, the null hypothesis States the population mean difference between the paired values is equal to zero whereas the alternative hypothesis for a two-sided test states that the population mean difference between the paired values is not equal to zero . In other words the null hypothesis States the diet will not change the weight whereas the alternative hypothesis states that the diet will change the weight the mean of the differences.
In our sample indicates that the diet might result in weight loss, however we'll now use a par T test to see if this observed difference is enough to reject an null hypothesis, in other words we'll use a pair t-test to determine if we have enough evidence to say that the observed weight loss is not just due to chance .
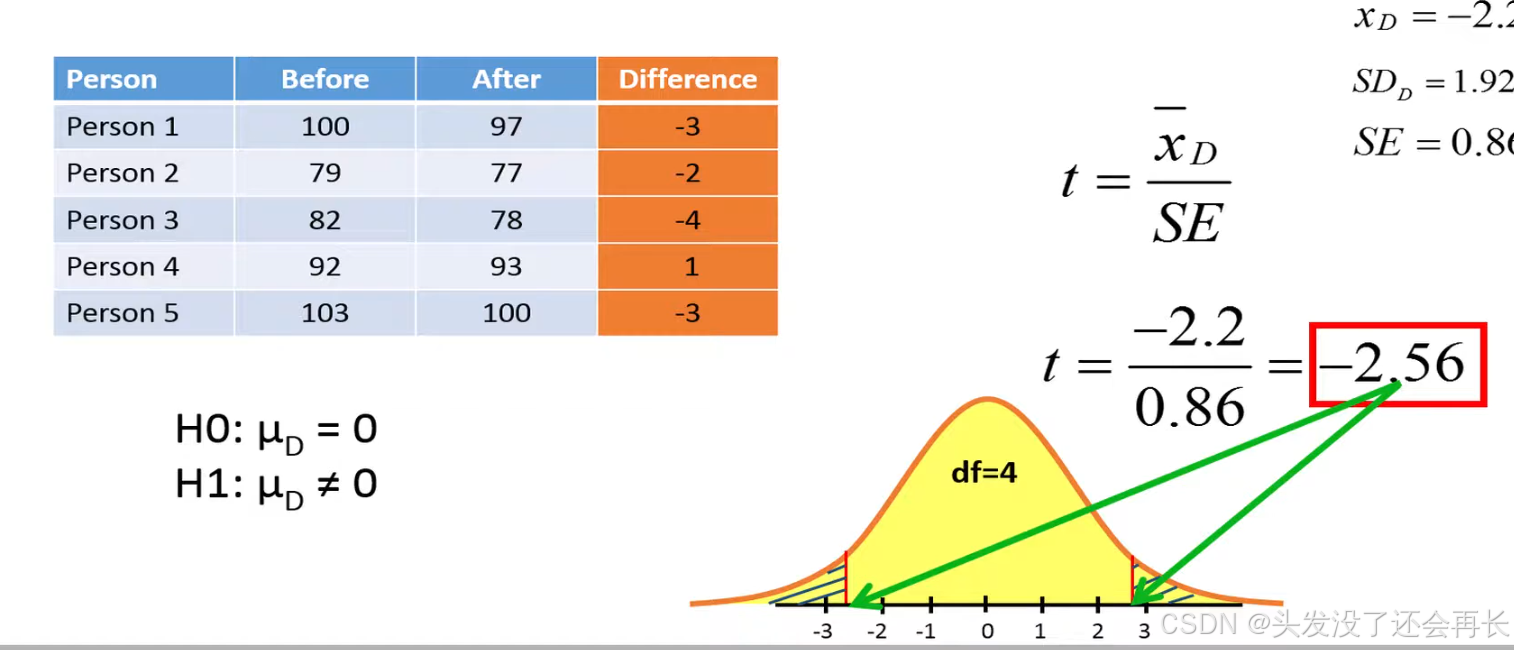
We use alpha=0.05 in this case.
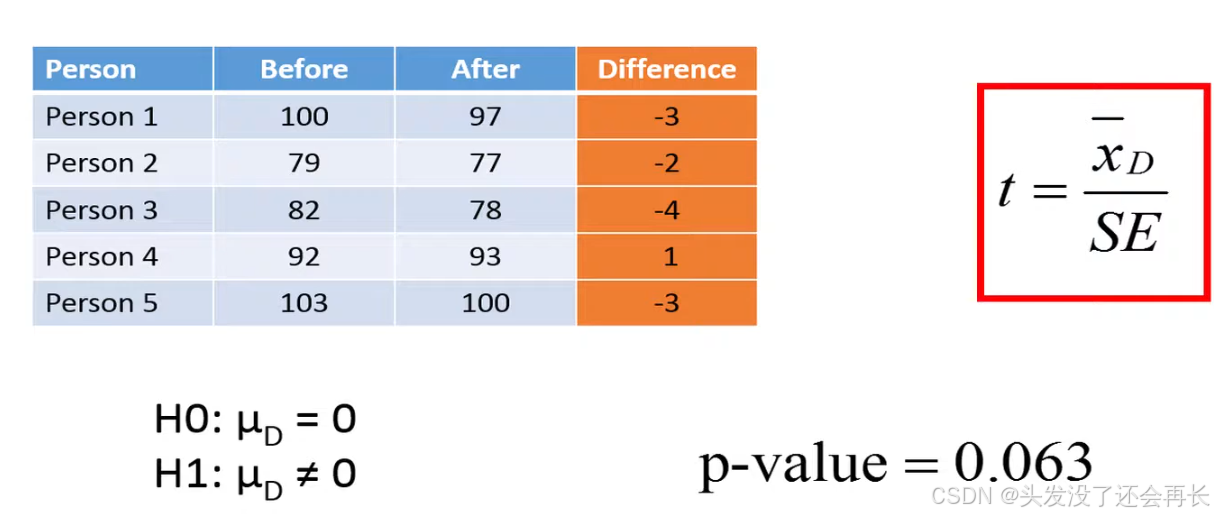
We use freedom degree=5-1=4. we get the area on t-distribution of df=4, and the p-value = area = 0.063. Because 0.063>0.05, so we do not reject the null hypothesis, we conclude that the diet has no significant effect on the body weight.
Although the mean weight loss is 2.2 kilos could be due to that the sample size is too small . If you had observed the same average weight loss with the largest sample size the standard error would have been reduced and the T statistic would have been bigger this would lead to a smaller P value that would allow us to reject a null hypothesis.
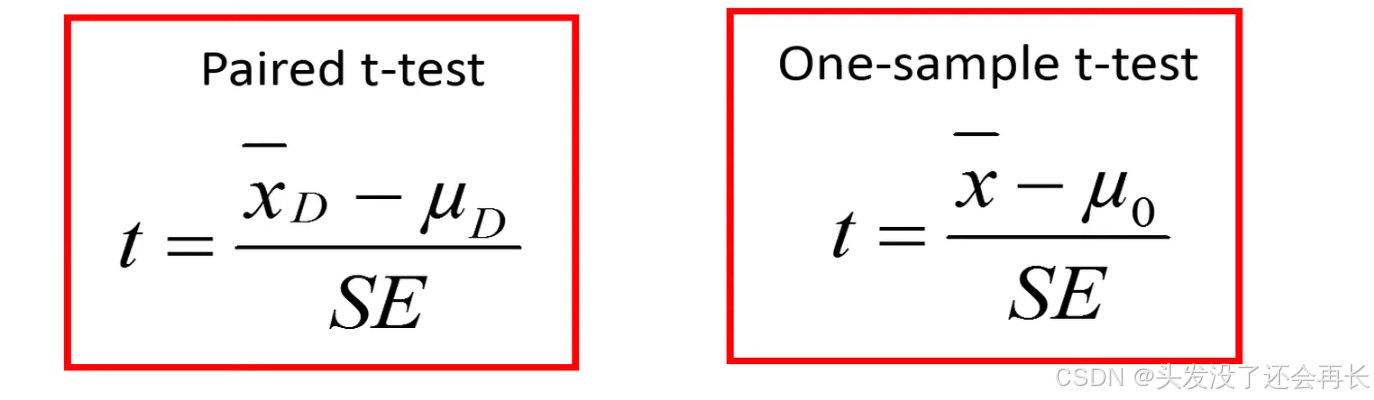
The difference between a paired and one-sample t-test
Unpaired T Test is simply just a one sample test which is based on the differences between the pairs.
Whereas the one sample T Test may also involve the mean of any continuous variable, therefore the one sample T test is not restricted to only differences between Pairs.
By using a one sample T Test based on the differences would have got the same results.