12. One-way ANOVA
The basics
One way refers that it involves only one factor , for example a two-way ANOVA involves two factors.
Example
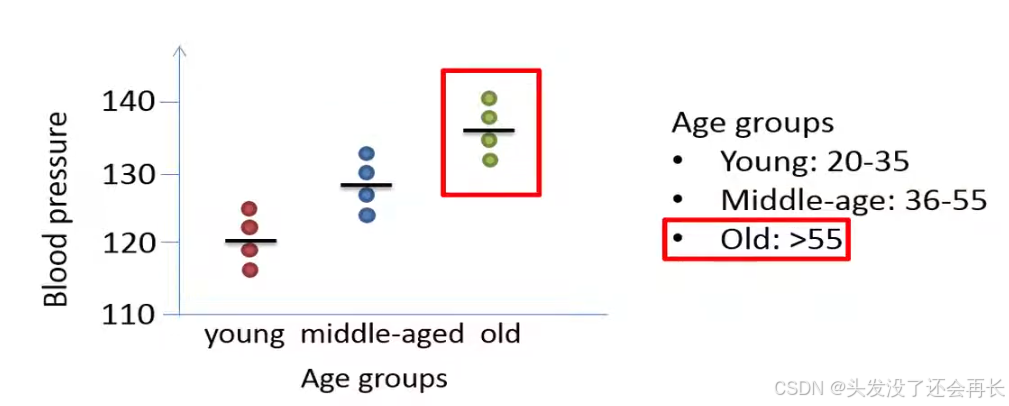
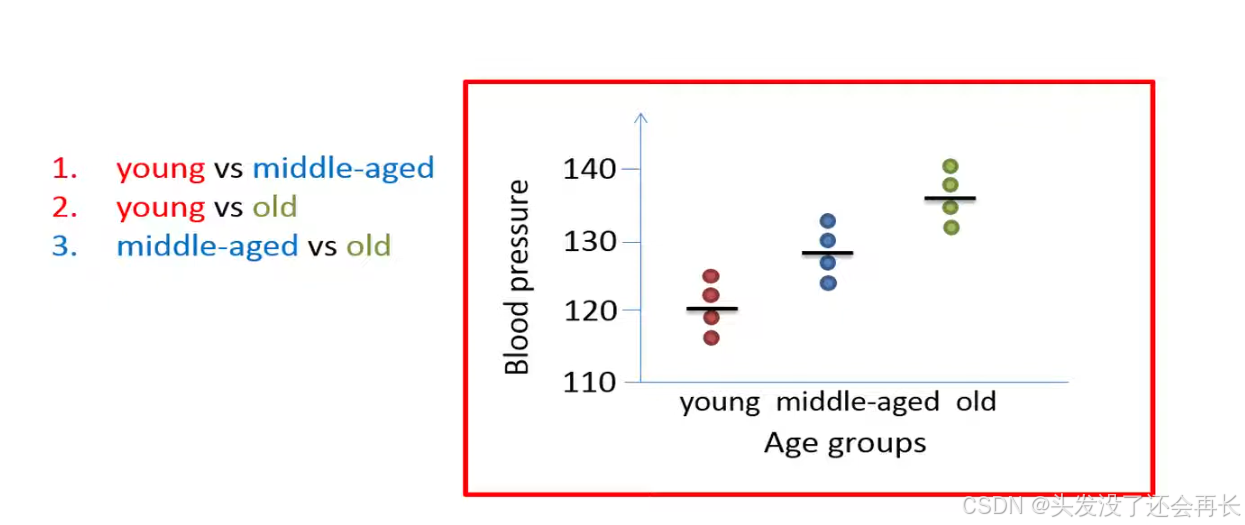
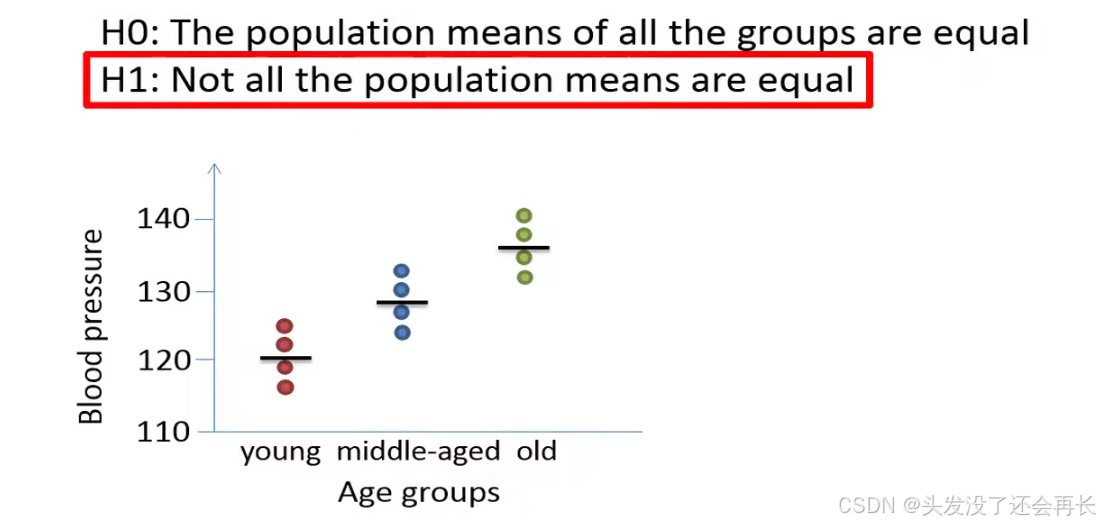
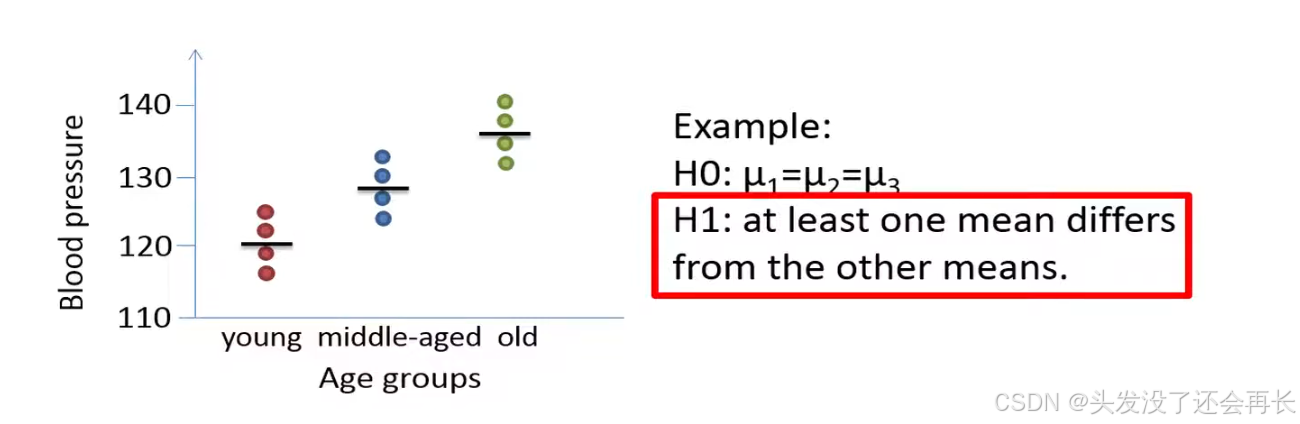
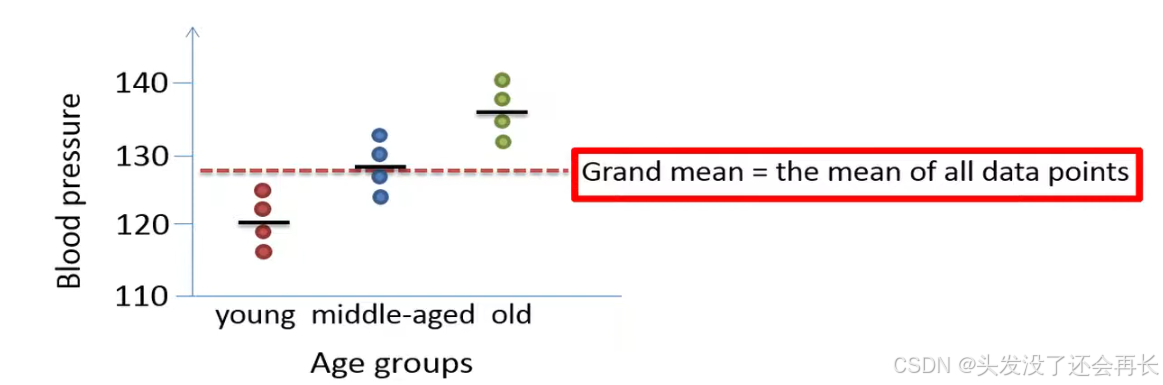
We look at an example of blood pressure data, the data includes values that represent this total blood pressure from 12 individuals.
The study design is balanced in this example since we have an equal number observations in each of the three groups , each age group therefore includes four individuals the blood pressure has been measured on four young individuals in age 20 to 35, four middle aged individuals and four individuals that are older than 55 years of age.
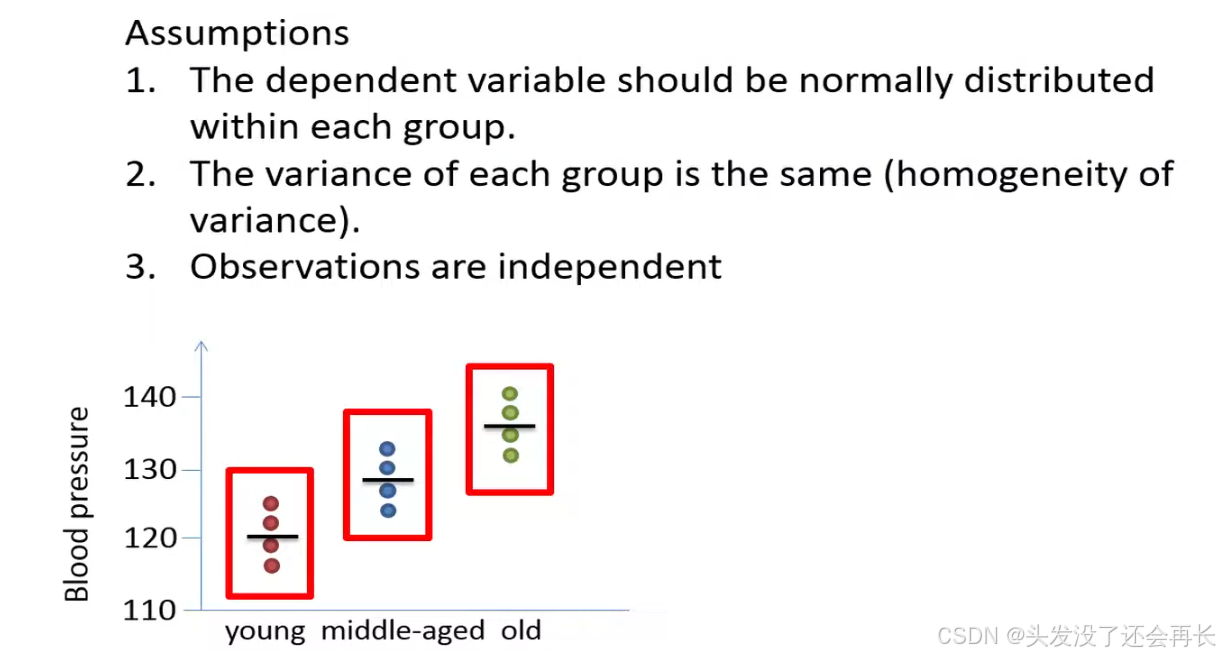
ANOVA is a method that can be used when we like to compare the means between three or more group s.
The dependent variable(blood pressures) should have a continuous scale and the independent variable(Age groups) the factor should have a categorical scale .
In our example the blood pressure has a continuous scale whereas the age variable has a categorical categories.
Note that ANOVA can also be used to compare the means of two groups , which will result in an equivalent outcome as the unpaired t-test. Before we go into the details about ANOVA. Let's first compare it to the unpaired t-test so that we understand the difference between the two methods.
ANOVA vs. t-test
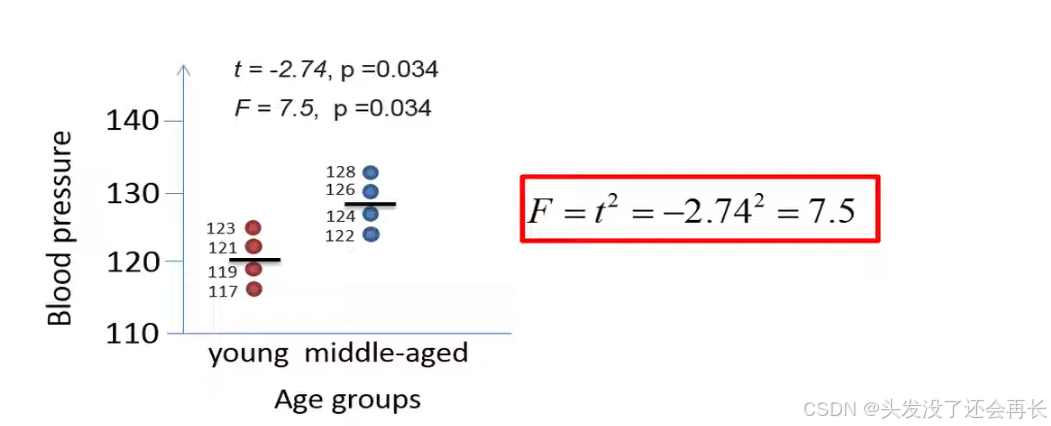
The f statistic computed by the ANOVA is in fact equal to the square of the t statistic from the t test.
In the following example a two tailed t test would result in a t-statistic of negative 2.74 and a p-value of 0.034
The two methods use different calculations and are based on different distribution . Note that the t distribution has two tails whereas the f distribution has only one tail.
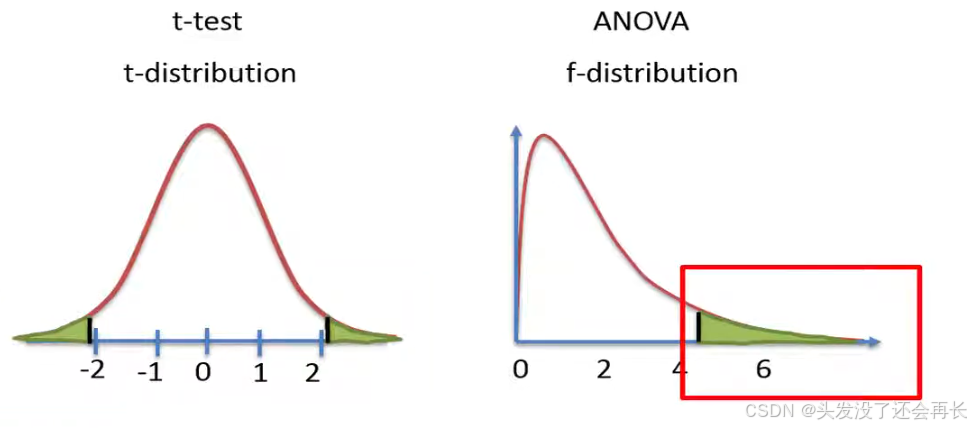
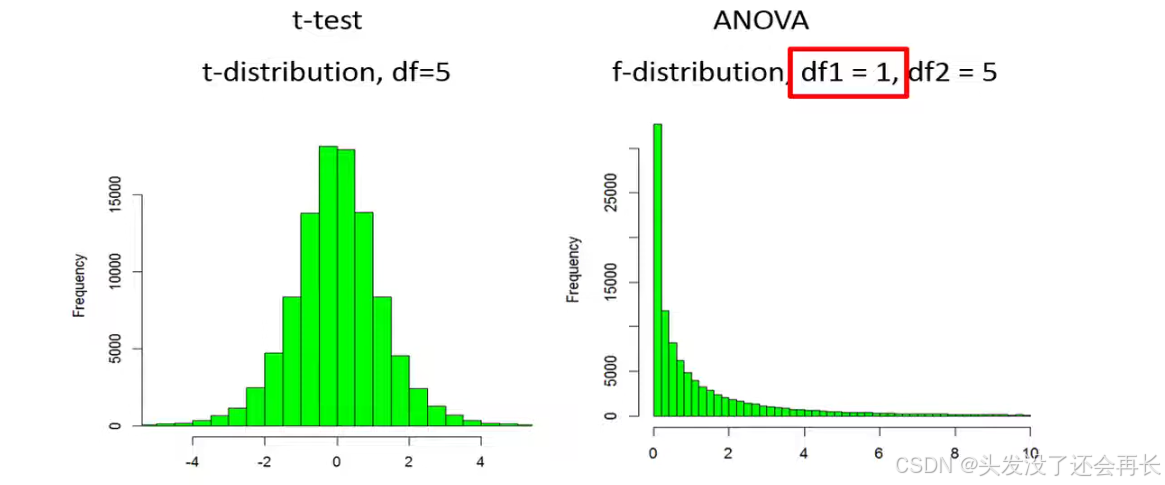
for example if we draw 100 000 values from a t distribution with five years of freedom, the values would be distributed like this. Note that about half of the values are negative and half are positive.
If we square all those values then we would only have positive values that would be distributed like an f distribution with one and five degrees of freedom . The extra degrees of freedom for an f distribution represents the number of groups that we have minus one , in this example we had only two groups which means that the first degrees of freedom is equal to one.
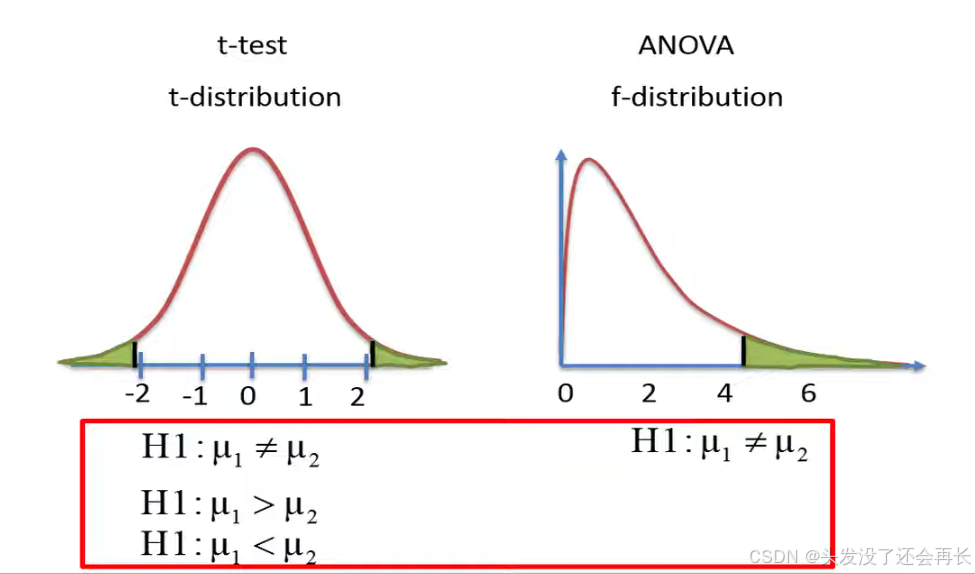
Since the t-distribution has both positive and negative values , a t-test can never be used to test either two-sided hypotheses to test if the two means are different or a one-sided hypothesis to test if one mean is either greater or less than other mean.
In contrast an ANOVA can only be used to test a two-sided hypothesis since the f-distribution has only one tail with positive values, therefore the ANOVA can only test if there is a difference within the means.
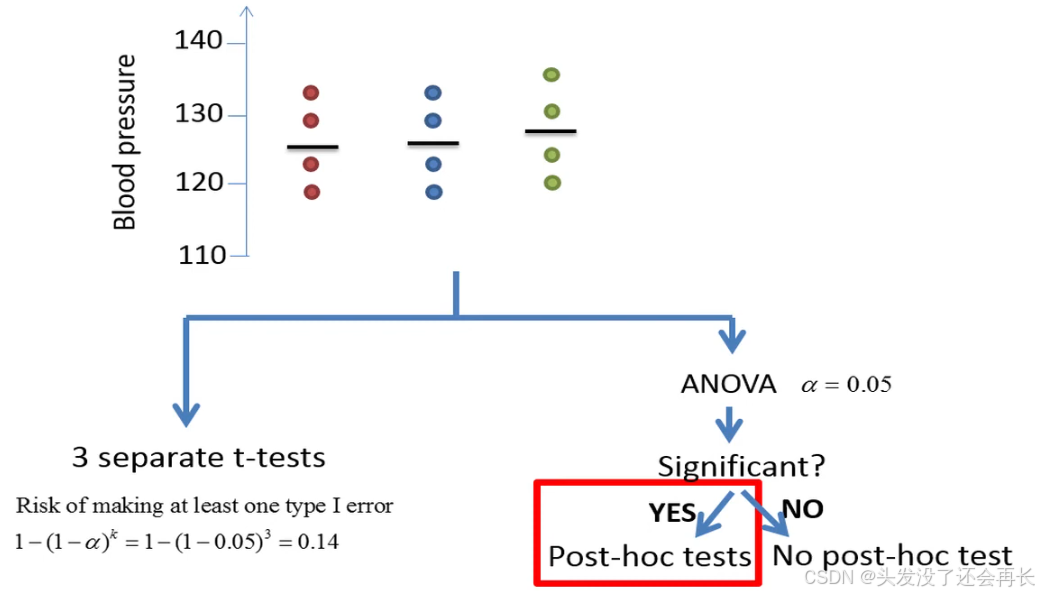
let's say that we would like to use a t-test to analyze, if there's a significant difference in the mean blood pressure between the three different age groups .
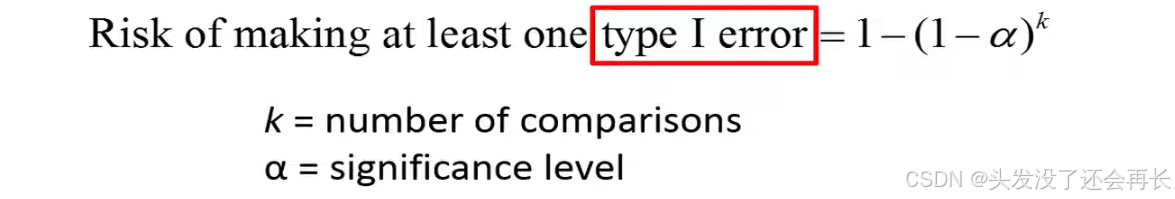
However every time we do a t-test and the null hypothesis applies which means that the groups have equal means we're under 5 risk of committing type 1 error .
A type 1 error is defined as the error we make if we reject the null hypothesis even though it is true. For example, if no difference exists between the population mean values of the two groups but we mistakenly conclude that there is a difference.
The following equation can be used to estimate the risk of making at least one type one error .
ANOVA Calculation
Hypothesis
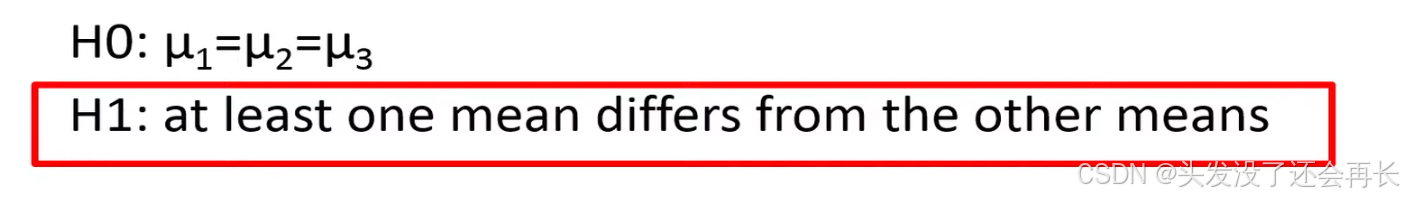
We'll now have a look at how ANOVA works, the null hypothesis of the test states that the population means of all the groups are equal whereas the alternative hypothesis states that not all the population means are equal .
But alternative hypothesis not state which of the means that are different, if we reject the null hypothesis we can perform a so-called postdoc test to identify which mean that is different from the other means.
Assumptions
- If the assumption of normality is severely violated, one can consider the corresponding
non-parametric Kruskal-Wallis testor try to transform the data. - Unbalanced designs one can consider using for example the
welch's ANOVA. - If the data comes from several repeated measurements on the same individuals, one can consider using a
repeated measurement ANOVA.
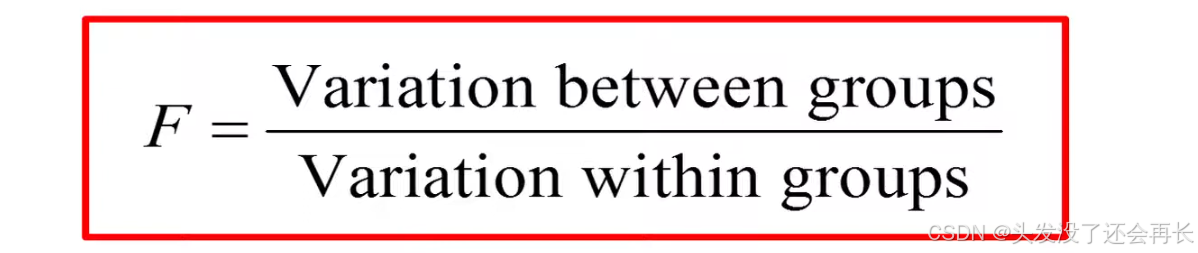
f statistic
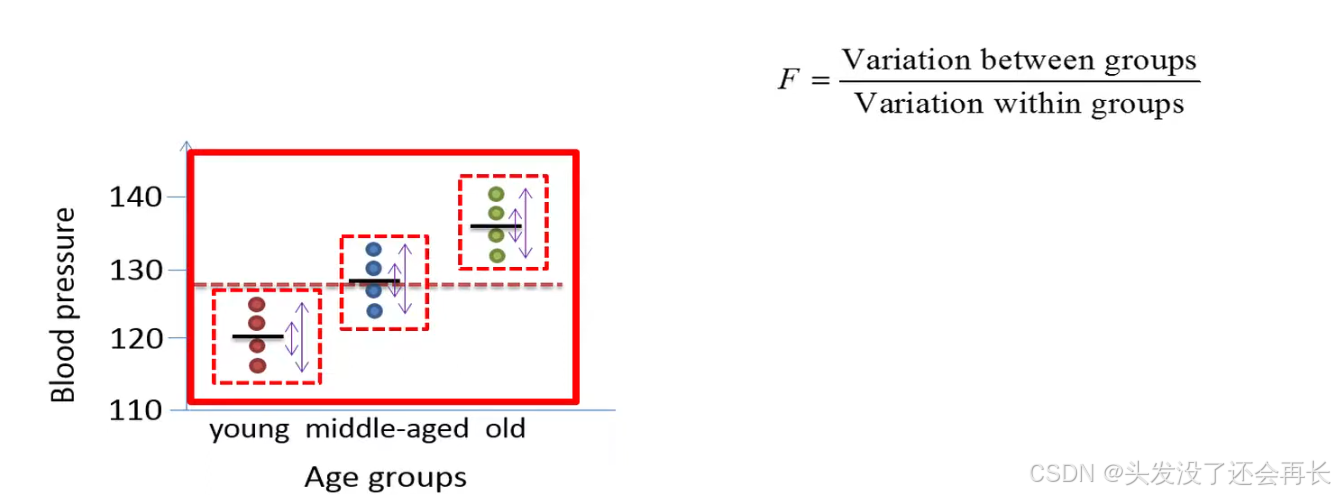
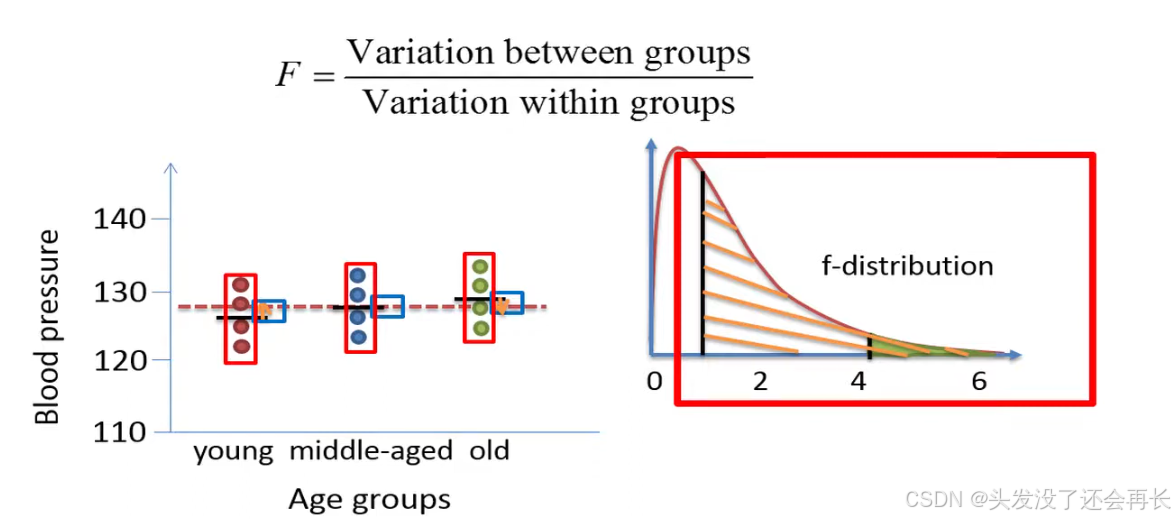
ANOVA involves the calculations of the so-called f ratio also called f statistic, the f ratio is the ratio of the variation between the groups and the variation within the groups.
how it works
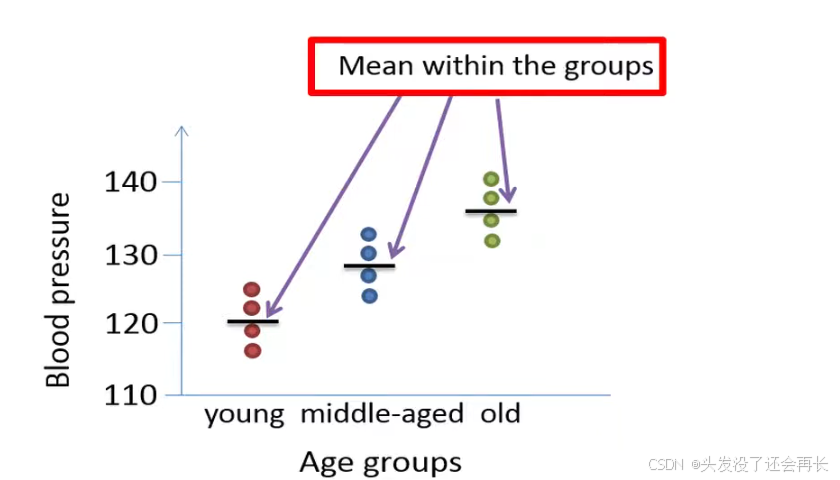
- Calculate the mean within each group.
-
Calculate the total mean(grand mean).
-
Calculate the pooled variation within the groups, which is based on the distance between the data points and their corresponding group means .
-
Calculate the variation between the groups, which is based on the distance between a grand mean and the group means
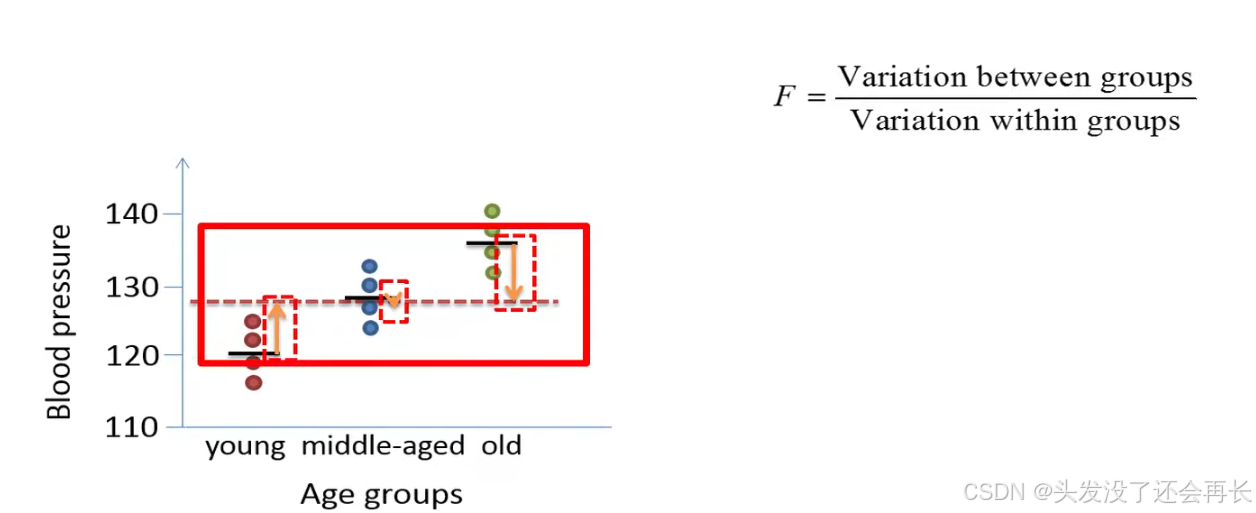
In this example, the variation within the groups is greater than the variation between the groups , since the means of the three groups do not vary much around the grand mean.
if the variation within the groups is greater than the variation between the groups, then the f ratio will be less than one , an f ratio that is less than 1 would be much smaller than the critical value , which is 4.26 in this example since this is the value that defines 5 of the tail in an f distribution with 2 and 9 degrees of freedom.
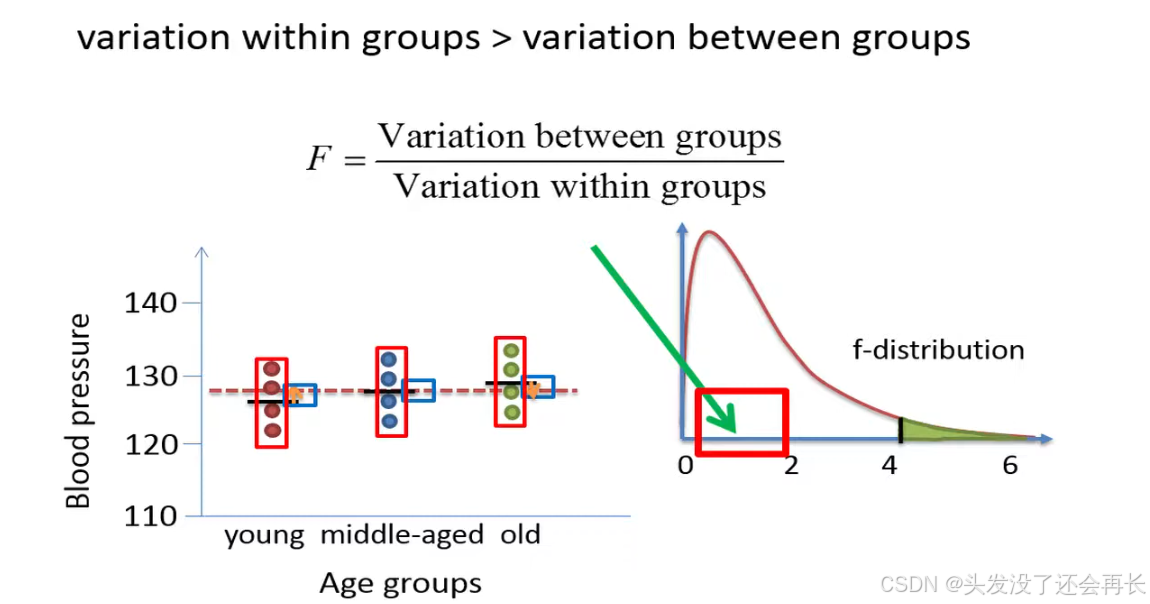
The p-value is therefore expected to be much bigger than 0.05 , we therefore not reject the null hypothesis. We will therefore conclude that the mean blood pressure is equal between the age groups.
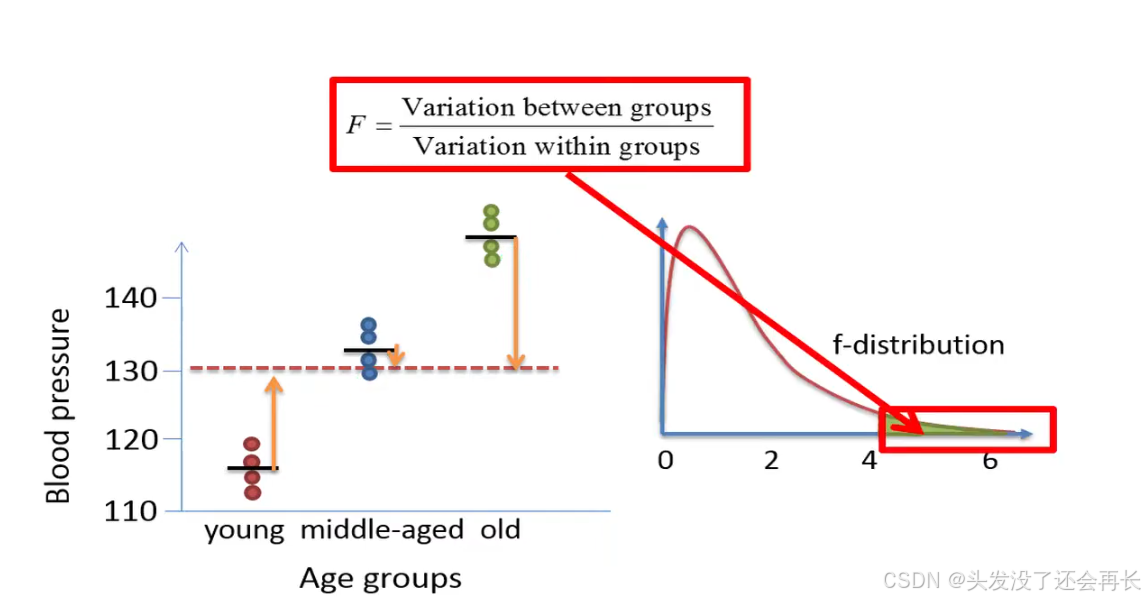
In contrast, let's consider a case where the variation between the groups is relatively large compared to the variation within the groups .
In this example we see that the average variation the group means around the grand mean is larger than the average variation within the groups.
In this example the f ratio will be greater than 4.26, which means that the p-value will be less than 0.05 , and that we will reject the null hypothesis, to summarize we'll reject the null hypothesis of the ANOVA only if the variation between the groups is much larger than the variation within groups.
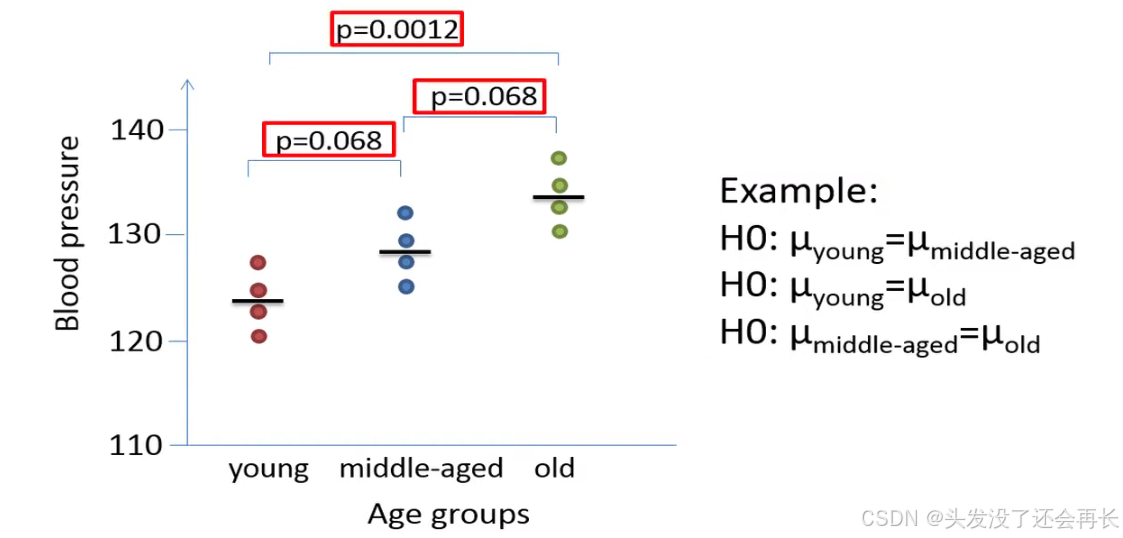
We know that at least one mean differs from the other means, to see which mean value that differs from the other means we could perform a so-called postdoc test.
A postdoc test is quite similar to performing three separate t-tests based on the following hypotheses.
Let's say that the postdoc test results in the forming p-values when the individual group means are compared, based on the p-values we would reject only the second null hypothesis, since the corresponding p-value is the only one that is less than our significance level of 0.05.
We would then conclude that there is a significant difference in immense historic blood pressure only between young and old people , although it appears to be a difference between for example the blood pressure of young and middle-aged the sample size might be too small to detect it.
t-test vs ANOVA (example)
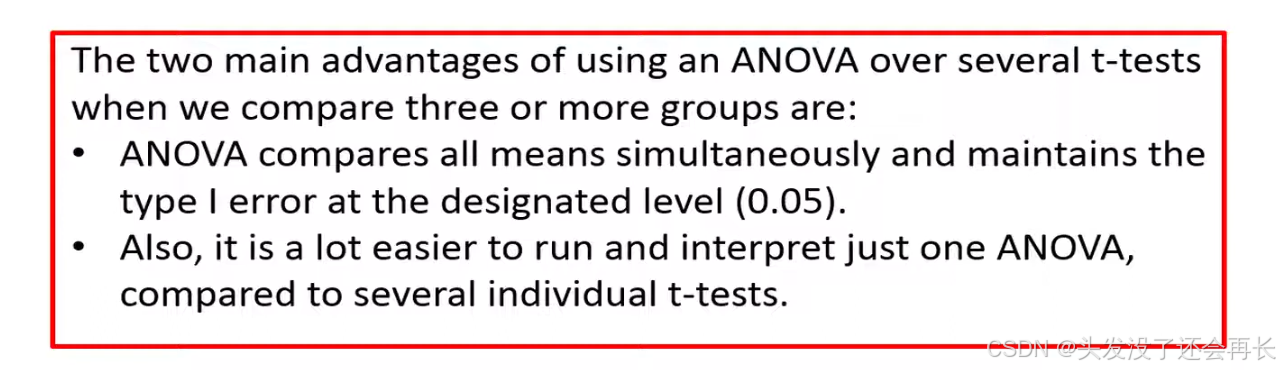
We'll discuss the importance of using ANOVA instead of separate t-tests.
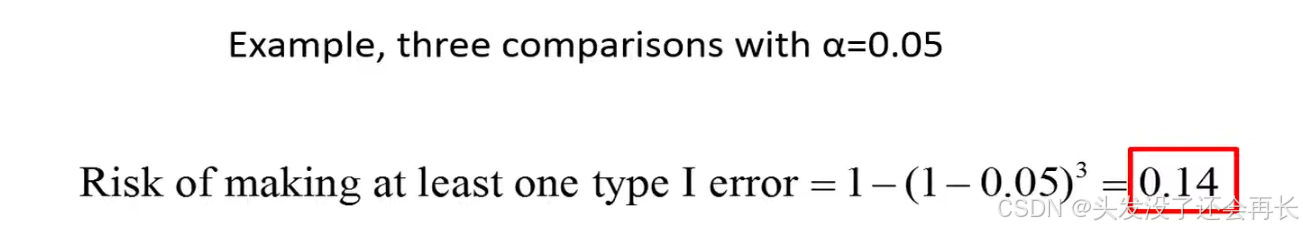
When we use three separate t-tests the risk that we make at least one type one error increases from five percent to about fourteen percent.
In comparison using an ANOVA is like using a filter we usually only apply the postdoc test if the null hypothesis is rejected by the ANOVA .
If the null hypothesis is not rejected by the ANOVA we do not perform any further tests, this prevents further testing of means that are likely to be equal, which will reduce the risk of committing type 1 error.
if all means are equal the risk that we make at least one type on error is 5 percent. however postdoc tests can still increase the risk of committing several type 1 errors if you compare many groups , this is why postdoc tests usually involve some sort of correction of the p-values.