一、背景
在调查进程内的非预期的较长时间的唤醒关系时,已经增加了trace_marker ftrace的trace_marker使用 并从抓到的异常状态的trace里发现有进程内的两个线程之间有一个从增加的trace_marker的用户态的函数逻辑来看是不存在锁关联情况的一次唤醒关系。且这次唤醒关系由于被唤醒者是高优线程,唤醒者是低优线程,唤醒者由于是低优被其他中优或者高优线程抢占,导致等了较长的时间后再执行逻辑,再去唤醒高优线程,如下图:
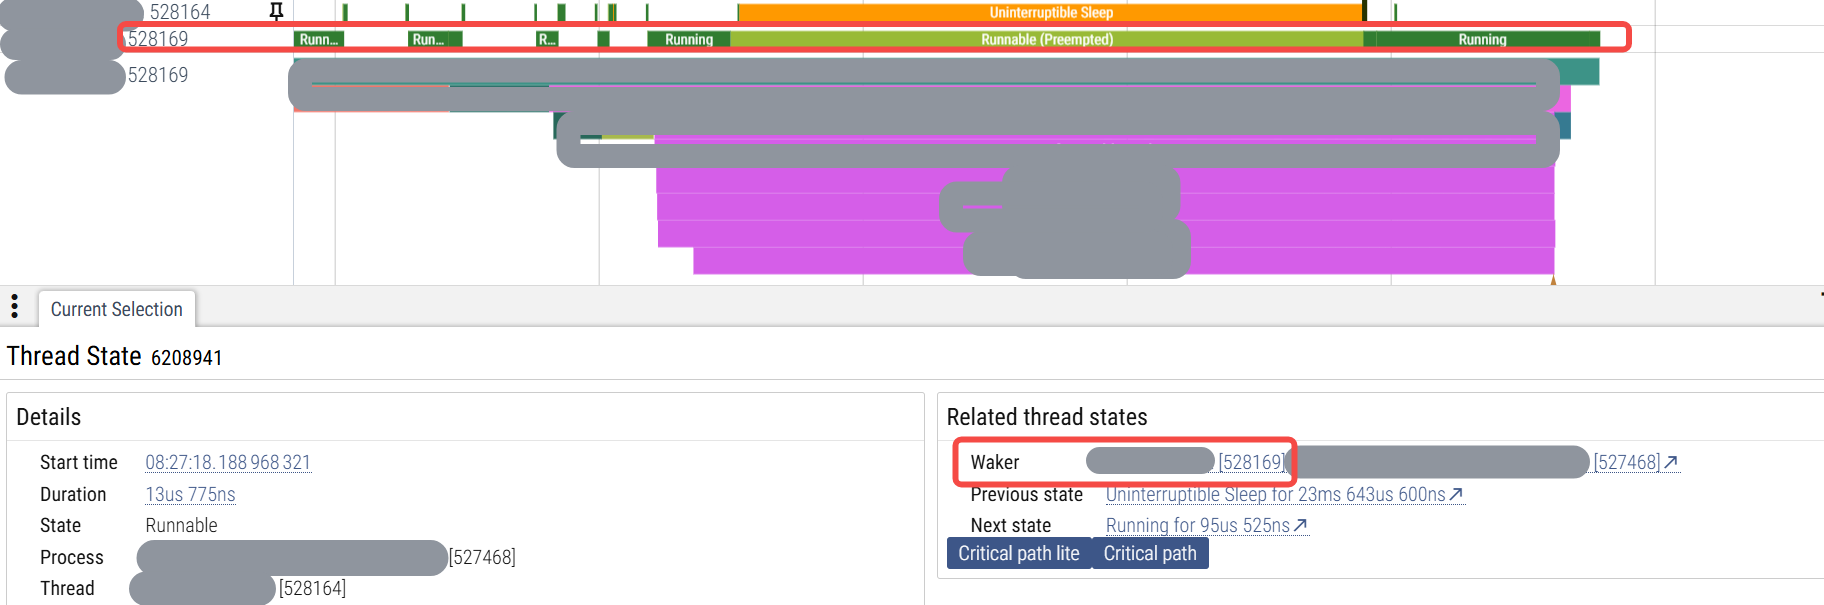
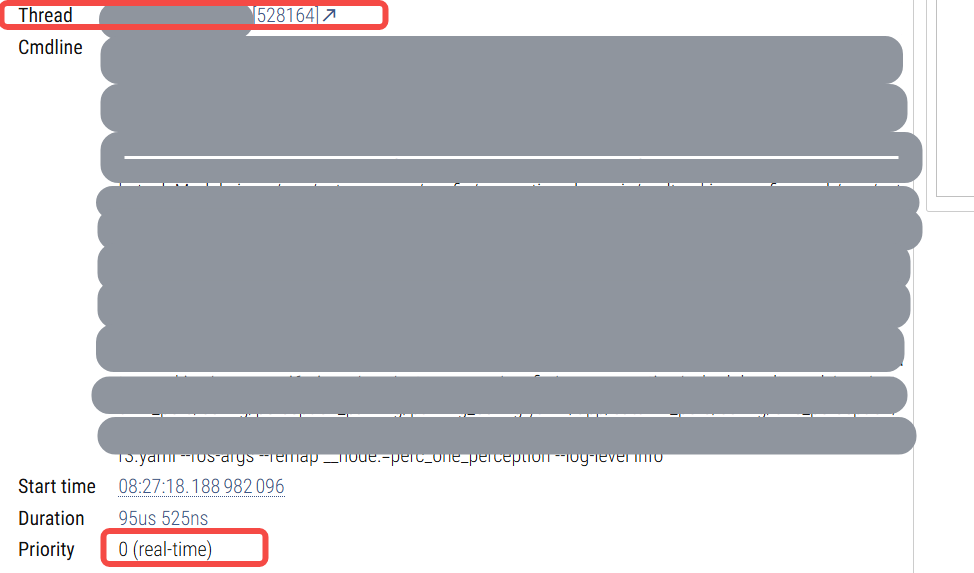
从上图里可以看到低优线程528169被抢占了很久时间后才继续运行,唤醒了528164线程,而528164线程是以D的状态陷入了睡眠,说明是在等内核的锁,而我们是rt-linux系统,底层的内核锁如果是用的mutex或者spinlock的话,它是有优先级继承的,怎么会没有更早让唤醒者528169提高优先级而得到调度,这样如此高优(都已经设置成了99这种rt了)的528164线程可以早一些被唤醒。所以可以说明这个锁并不是内核里的mutex或者spinlock。那么到底是什么锁呢?我们在下面第二章里通过ko来抓这样的唤醒栈,另外,这部分逻辑可能也涉及用户栈,所以抓取程序也抓用户栈的内容,相关用户态解析的程序及相关的逻辑见之前的博客 内核逻辑里抓取用户栈的几种方法 和 用户栈的高效解析逻辑。另外,在第三章里,我们针对抓取程序及抓取到的内容进行相关解释。
二、抓取程序的ko
2.1 抓取唤醒栈的程序
cpp
#include <linux/module.h>
#include <linux/capability.h>
#include <linux/sched.h>
#include <linux/uaccess.h>
#include <linux/proc_fs.h>
#include <linux/ctype.h>
#include <linux/seq_file.h>
#include <linux/poll.h>
#include <linux/types.h>
#include <linux/ioctl.h>
#include <linux/errno.h>
#include <linux/stddef.h>
#include <linux/lockdep.h>
#include <linux/kthread.h>
#include <linux/sched.h>
#include <linux/delay.h>
#include <linux/wait.h>
#include <linux/init.h>
#include <asm/atomic.h>
#include <trace/events/workqueue.h>
#include <linux/sched/clock.h>
#include <linux/string.h>
#include <linux/mm.h>
#include <linux/interrupt.h>
#include <linux/tracepoint.h>
#include <trace/events/osmonitor.h>
#include <trace/events/sched.h>
#include <trace/events/irq.h>
#include <trace/events/kmem.h>
#include <linux/ptrace.h>
#include <linux/uaccess.h>
#include <asm/processor.h>
#include <linux/sched/task_stack.h>
#include <linux/nmi.h>
#include <linux/version.h>
#include <linux/sched/mm.h>
#include <asm/irq_regs.h>
#include <linux/kallsyms.h>
#include <linux/kprobes.h>
#include <linux/stop_machine.h>
#include <linux/perf_event.h>

MODULE_LICENSE("GPL");
MODULE_AUTHOR("zhaoxin");
MODULE_DESCRIPTION("Module for monitor wakeup.");
MODULE_VERSION("1.0");

static int wakerpid = 0;
module_param(wakerpid, int, S_IRUGO);
static int wakeepid = 0;
module_param(wakeepid, int, S_IRUGO);

#define TEST_STACK_TRACE_ENTRIES   32

typedef unsigned int (*stack_trace_save_tsk_func)(struct task_struct *task,
				  unsigned long *store, unsigned int size,
				  unsigned int skipnr);
stack_trace_save_tsk_func _stack_trace_save_tsk;

typedef void (*perf_callchain_user_func)(struct perf_callchain_entry_ctx *entry,
				struct pt_regs *regs);
perf_callchain_user_func _perf_callchain_user;

void init_get_perf_callchain_func(void)
{
	int ret;
	struct kprobe kp;
	memset(&kp, 0, sizeof(kp));
	kp.symbol_name = "perf_callchain_user";
	kp.pre_handler = NULL;
	kp.addr = NULL;	// 作为强调,提示使用symbol_name
	ret = register_kprobe(&kp);
	if (ret < 0) {
		printk("register_kprobe fail!\n");
		return;
	}
	printk("register_kprobe succeed!\n");
	_perf_callchain_user = (void*)kp.addr;
	unregister_kprobe(&kp);
}

#define FILENAME        "dlog.txt"

#define TESTDIOMONITOR_FILE_MAXLEN  1024
#define PERF_MAX_STACK_DEPTH		127

typedef struct testdmonitor_sample {
    struct timespec64 time;
    u64 timens;
    int cpu;
    int pid;
    int tgid;
    int ppid;
    char comm[TASK_COMM_LEN];
    char ppidcomm[TASK_COMM_LEN];
    int stackn;
    void* parray_stack[TEST_STACK_TRACE_ENTRIES];
    int stackn_user;
    void* parray_stack_user[PERF_MAX_STACK_DEPTH];
    int wakercpu;
    int wakerpid;
    int wakertgid;
    int wakerppid;
    char wakercomm[TASK_COMM_LEN];
    char wakerppidcomm[TASK_COMM_LEN];
    int wakerstackn;
    void* parray_wakerstack[TEST_STACK_TRACE_ENTRIES];
    int waker_stackn_user;
    void* waker_parray_stack_user[PERF_MAX_STACK_DEPTH];
    u32 writedone;  // 0 or 1
} testdmonitor_sample;

#define TESTDIOMONITOR_SAMPLE_RINGBUFF_MAXCOUNT  8192*4

typedef struct testdmonitor_sample_ringbuff {
    testdmonitor_sample* parray_sample;
    volatile u64 wp;    // Index is wp & (TESTDIOMONITOR_SAMPLE_RINGBUFF_MAXCOUNT - 1).
    volatile u64 rp;    // Index is rp & (TESTDIOMONITOR_SAMPLE_RINGBUFF_MAXCOUNT - 1).
    u32 skipcount;  // 0 means no skip any abnormal event
} testdmonitor_sample_ringbuff;

#define TESTDIOMONITOR_LINEBUFF  1024
#define MAX_CPU_COUNT   64

typedef struct testdmonitor_env {
    struct file* file;
    char file_linebuff[TESTDIOMONITOR_LINEBUFF];
    int headoffset;
    loff_t file_pos;
    testdmonitor_sample_ringbuff ringbuff;
    struct perf_callchain_entry* pentry[MAX_CPU_COUNT];
} testdmonitor_env;

static testdmonitor_env _env;

static struct delayed_work work_write_file;
static struct workqueue_struct *wq_write_file;

void init_file(void)
{
    _env.file = filp_open(FILENAME, O_WRONLY | O_CREAT | O_TRUNC, 0644);
    if (IS_ERR(_env.file)) {
        _env.file = NULL;
    }
}

void exit_file(void)
{
    if (_env.file) {
        filp_close(_env.file, NULL);
    }
}

void testdmonitor_write_file(char* i_pchar, int i_size)
{
    if (_env.file) {
        kernel_write(_env.file, i_pchar, i_size, &_env.file_pos);
    }
}

void testdmonitor_write_file_emptyline(void)
{
    testdmonitor_write_file("\n", strlen("\n"));
}

void testdmonitor_file_oneline(const char* i_format, ...)
{
    char* pcontent = &_env.file_linebuff[_env.headoffset];
    va_list args;
    va_start(args, i_format);
    vsnprintf(pcontent, TESTDIOMONITOR_LINEBUFF - _env.headoffset, i_format, args);
    va_end(args);
    testdmonitor_write_file(_env.file_linebuff, strlen(_env.file_linebuff));
}

void testdmonitor_checkget_parentinfo(testdmonitor_sample* io_psample, struct task_struct* i_ptask)
{
    struct task_struct* parent;
    rcu_read_lock();
    parent = rcu_dereference(i_ptask->real_parent);
    io_psample->ppid = parent->pid;
    strlcpy(io_psample->ppidcomm, parent->comm, TASK_COMM_LEN);
    rcu_read_unlock();
}

void testdmonitor_checkget_parentinfo_waker(testdmonitor_sample* io_psample, struct task_struct* i_ptask)
{
    struct task_struct* parent;
    rcu_read_lock();
    parent = rcu_dereference(i_ptask->real_parent);
    io_psample->wakerppid = parent->pid;
    strlcpy(io_psample->wakerppidcomm, parent->comm, TASK_COMM_LEN);
    rcu_read_unlock();
}

static inline u64 gettscns(void)
{
    struct timespec64 ts;
    ktime_get_ts64(&ts);
    return timespec64_to_ns(&ts);
}

#define HEAD_USER       "user "

static void write_file(struct work_struct *w)
{
    //ssize_t ret;
    u32 index;
    testdmonitor_sample* psample;
    struct tm t;
    char timestr[64];
    int stacki;
    while (_env.ringbuff.rp != _env.ringbuff.wp) {
        index = (_env.ringbuff.rp & (TESTDIOMONITOR_SAMPLE_RINGBUFF_MAXCOUNT - 1));
        psample = &_env.ringbuff.parray_sample[index];
        if (psample->writedone != 1) {
            break;
        }
        testdmonitor_write_file_emptyline();
        _env.headoffset = sprintf(_env.file_linebuff, "[%llu] ", _env.ringbuff.rp);
        time64_to_tm(psample->time.tv_sec + 8 * 60 * 60, 0, &t);
        snprintf(timestr, 64, "%04ld-%02d-%02d-%02d_%02d_%02d.%09ld",
		    1900 + t.tm_year, t.tm_mon + 1, t.tm_mday, t.tm_hour, t.tm_min, t.tm_sec, psample->time.tv_nsec);
        testdmonitor_file_oneline("[skipcount:%u]begin...time[%s][%llu]wakercpu[%d]\n",
            _env.ringbuff.skipcount, timestr, psample->timens, psample->wakercpu);
        testdmonitor_file_oneline("wakertgid[%d]wakerpid[%d]wakercomm[%s]wakerppid[%d]wakerppidcomm[%s]\n",
            psample->wakertgid, psample->wakerpid, psample->wakercomm, psample->wakerppid, psample->wakerppidcomm);
        testdmonitor_file_oneline("stack[%d]:\n", psample->wakerstackn);
        for (stacki = 0; stacki < psample->wakerstackn; stacki++) {
            testdmonitor_file_oneline("%*c%pS\n", 5, ' ', (void *)psample->parray_wakerstack[stacki]);
        }
        for (stacki = 0; stacki < psample->waker_stackn_user; stacki++) {
            testdmonitor_file_oneline(HEAD_USER "%d %*c%llx\n",
                psample->wakertgid, 5, ' ', (u64)psample->waker_parray_stack_user[stacki]);
        }
        testdmonitor_file_oneline("cpu[%d]tgid[%d]pid[%d]comm[%s]ppid[%d]ppidcomm[%s]\n",
            psample->cpu, psample->tgid, psample->pid, psample->comm, psample->ppid, psample->ppidcomm);
        testdmonitor_file_oneline("stack[%d]:\n", psample->stackn);
        for (stacki = 0; stacki < psample->stackn; stacki++) {
            testdmonitor_file_oneline("%*c%pS\n", 5, ' ', (void *)psample->parray_stack[stacki]);
        }
        for (stacki = 0; stacki < psample->stackn_user; stacki++) {
            testdmonitor_file_oneline(HEAD_USER "%d %*c%llx\n",
                psample->tgid, 5, ' ', (u64)psample->parray_stack_user[stacki]);
        }
        testdmonitor_write_file_emptyline();
        smp_wmb();
        psample->writedone = 0;
        _env.ringbuff.rp ++;
    }
    queue_delayed_work_on(nr_cpu_ids - 1, wq_write_file,
        &work_write_file, 1);
}

static void init_write_file(void)
{
    init_file();
    wq_write_file = alloc_workqueue("testdmonitor_write_file", WQ_MEM_RECLAIM, 0);
    INIT_DELAYED_WORK(&work_write_file, write_file);
    queue_delayed_work_on(nr_cpu_ids - 1, wq_write_file,
        &work_write_file, 3);
}

static void exit_write_file(void)
{
    cancel_delayed_work_sync(&work_write_file);
    destroy_workqueue(wq_write_file);
    exit_file();
}

void init_testdmonitor_sample_ringbuff(void)
{
    int i;
    _env.ringbuff.parray_sample = kvzalloc(sizeof(testdmonitor_sample) * TESTDIOMONITOR_SAMPLE_RINGBUFF_MAXCOUNT, GFP_KERNEL);
    for (i = 0; i < MAX_CPU_COUNT; i++) {
        _env.pentry[i] = kmalloc(sizeof(struct perf_callchain_entry) + sizeof(__u64) * PERF_MAX_STACK_DEPTH,
            GFP_KERNEL);
    }
}

void exit_testdmonitor_sample_ringbuff(void)
{
    int i;
    for (i = 0; i < MAX_CPU_COUNT; i++) {
        kvfree(_env.pentry[i]);
    }
    kvfree(_env.ringbuff.parray_sample);
}

testdmonitor_sample* testdmonitor_get_psample(void)
{
    u64 windex_raw, windex_raw_old;
    u32 windex;
    while (1) {
        windex_raw = _env.ringbuff.wp;
        if (windex_raw - _env.ringbuff.rp >= (u64)(TESTDIOMONITOR_SAMPLE_RINGBUFF_MAXCOUNT)) {
            _env.ringbuff.skipcount ++;
            return NULL;
        }
        // atomic_cmpxchg return old value
		windex_raw_old = atomic64_cmpxchg((atomic64_t*)&_env.ringbuff.wp,
			windex_raw, windex_raw + 1);
        if (windex_raw_old == windex_raw) {
            break;
        }
    }
    windex = (u32)(windex_raw & (u64)(TESTDIOMONITOR_SAMPLE_RINGBUFF_MAXCOUNT - 1));
    return &_env.ringbuff.parray_sample[windex];
}

void store_user_stack(int *o_pstackn_user, void** parray_stack_user, struct task_struct *i_p)
{
    int i;
    struct perf_callchain_entry_ctx ctx;
    struct perf_callchain_entry* pentry = NULL;
    struct pt_regs *regs = task_pt_regs(i_p);
    *o_pstackn_user = 0;
    pentry = _env.pentry[smp_processor_id()];
    ctx.entry     = pentry;
    ctx.max_stack = PERF_MAX_STACK_DEPTH;
    ctx.nr	      = pentry->nr = 0;
    ctx.contexts       = 0;
    ctx.contexts_maxed = false;
    _perf_callchain_user(&ctx, regs);
    *o_pstackn_user = pentry->nr;
    for (i = 0; i < pentry->nr; i++) {
        parray_stack_user[i] = (void*)pentry->ip[i];
    }
}

void testdmonitor_add_sample(struct task_struct* i_task)
{
    testdmonitor_sample* psample = testdmonitor_get_psample();
    if (!psample) {
        return;
    }
    ktime_get_real_ts64(&psample->time);
    psample->timens = gettscns();
    psample->cpu = task_cpu(i_task);
    psample->pid = i_task->pid;
    psample->tgid = i_task->tgid;
    strlcpy(psample->comm, i_task->comm, TASK_COMM_LEN);
    testdmonitor_checkget_parentinfo(psample, i_task);
    psample->stackn = _stack_trace_save_tsk(i_task, (unsigned long*)psample->parray_stack, TEST_STACK_TRACE_ENTRIES, 0);
    store_user_stack(&psample->stackn_user, psample->parray_stack_user, i_task);
    psample->wakercpu = smp_processor_id();
    psample->wakerpid = current->pid;
    psample->wakertgid = current->tgid;
    strlcpy(psample->wakercomm, current->comm, TASK_COMM_LEN);
    testdmonitor_checkget_parentinfo_waker(psample, current);
    psample->wakerstackn = _stack_trace_save_tsk(current, (unsigned long*)psample->parray_wakerstack, TEST_STACK_TRACE_ENTRIES, 0);
    store_user_stack(&psample->waker_stackn_user, psample->waker_parray_stack_user, current);
    smp_wmb();
    psample->writedone = 1;
}

static void cb_sched_waking(void *i_data, struct task_struct *i_p)
{
    if (i_p->on_cpu || i_p->on_rq == 1) {
        return;
    }
    //if (current->tgid == 3366)
    if (current->pid == wakerpid && i_p->pid == wakeepid)
    {
        testdmonitor_add_sample(i_p);
    }
}

struct kern_tracepoint {
    void *callback;
    struct tracepoint *ptr;
    bool bregister;
};
static void clear_kern_tracepoint(struct kern_tracepoint *tp)
{
    if (tp->bregister) {
        tracepoint_probe_unregister(tp->ptr, tp->callback, NULL);
    }
}

#define INIT_KERN_TRACEPOINT(tracepoint_name) \
    static struct kern_tracepoint mykern_##tracepoint_name = {.callback = NULL, .ptr = NULL, .bregister = false};


#define TRACEPOINT_CHECK_AND_SET(tracepoint_name)                                             \
    static void tracepoint_name##_tracepoint_check_and_set(struct tracepoint *tp, void *priv) \
    {                                                                                \
        if (!strcmp(#tracepoint_name, tp->name))                                     \
        {                                                                            \
            ((struct kern_tracepoint *)priv)->ptr = tp;                          \
            return;                                                                  \
        }                                                                            \
    }

INIT_KERN_TRACEPOINT(sched_waking)
TRACEPOINT_CHECK_AND_SET(sched_waking)

typedef unsigned long (*kallsyms_lookup_name_func)(const char *name);
kallsyms_lookup_name_func _kallsyms_lookup_name_func;

void* get_func_by_symbol_name_kallsyms_lookup_name(void)
{
    int ret;
    void* pfunc = NULL;
	struct kprobe kp;
	memset(&kp, 0, sizeof(kp));
	kp.symbol_name = "kallsyms_lookup_name";
	kp.pre_handler = NULL;
	kp.addr = NULL;	// 作为强调,提示使用symbol_name
	ret = register_kprobe(&kp);
	if (ret < 0) {
		printk("register_kprobe fail!\n");
		return NULL;
	}
	printk("register_kprobe succeed!\n");
    pfunc = (void*)kp.addr;
	unregister_kprobe(&kp);
    return pfunc;
}

void* get_func_by_symbol_name(const char* i_symbol)
{
    if (_kallsyms_lookup_name_func == NULL) {
        return NULL;
    }
    return (void*)_kallsyms_lookup_name_func(i_symbol);
}

static int __init testwakeup_init(void)
{
    if (wakerpid == 0 || wakeepid == 0) {
        printk(KERN_ERR "wakerpid and wakeepid should NOT be 0\n");
        return -EINVAL;
    }
    _kallsyms_lookup_name_func = get_func_by_symbol_name_kallsyms_lookup_name();
    init_get_perf_callchain_func();
    init_testdmonitor_sample_ringbuff();
    init_write_file();
    _stack_trace_save_tsk = get_func_by_symbol_name("stack_trace_save_tsk");
    if (_stack_trace_save_tsk == NULL) {
        printk(KERN_ERR "get_func_by_symbol_name stack_trace_save_tsk failed!\n");
        return -1;
    }
    mykern_sched_waking.callback = cb_sched_waking;
    for_each_kernel_tracepoint(sched_waking_tracepoint_check_and_set, &mykern_sched_waking);
    if (!mykern_sched_waking.ptr) {
        printk(KERN_ERR "mykern_sched_waking register failed!\n");
        return -1;
    }
    else {
        printk(KERN_INFO "mykern_sched_waking register succeeded!\n");
    }
    tracepoint_probe_register(mykern_sched_waking.ptr, mykern_sched_waking.callback, NULL);
    mykern_sched_waking.bregister = 1;
    return 0;
}

static void __exit testwakeup_exit(void)
{
    clear_kern_tracepoint(&mykern_sched_waking);
    tracepoint_synchronize_unregister();
    exit_write_file();
    exit_testdmonitor_sample_ringbuff();
}

module_init(testwakeup_init);
module_exit(testwakeup_exit);
上面的ko程序有抓取用户栈的PC,相关的用户栈的解析见之前的博客。
2.2 使用方法
使用方法还是比较简单的,就是insmod时传入waker和wakee的参数,如下:
insmod testwakeup.ko waker=1 wakee=10
抓取的就是tid是1的线程唤醒tid是10的线程的唤醒栈。
三、相关解释
3.1 抓到的这次没有优先级继承的唤醒栈
通过ftrace开启抓取叠加同时insmod上面第二章的ko,在抓取到异常事件的trace后,rmmod掉ko,运行用户态解析程序,解析出完整的带用户栈的调用栈信息。根据perfetto里打开异常的trace里看到的时间来找对应的包含用户栈的完整调用栈,得到如下这个唤醒栈:
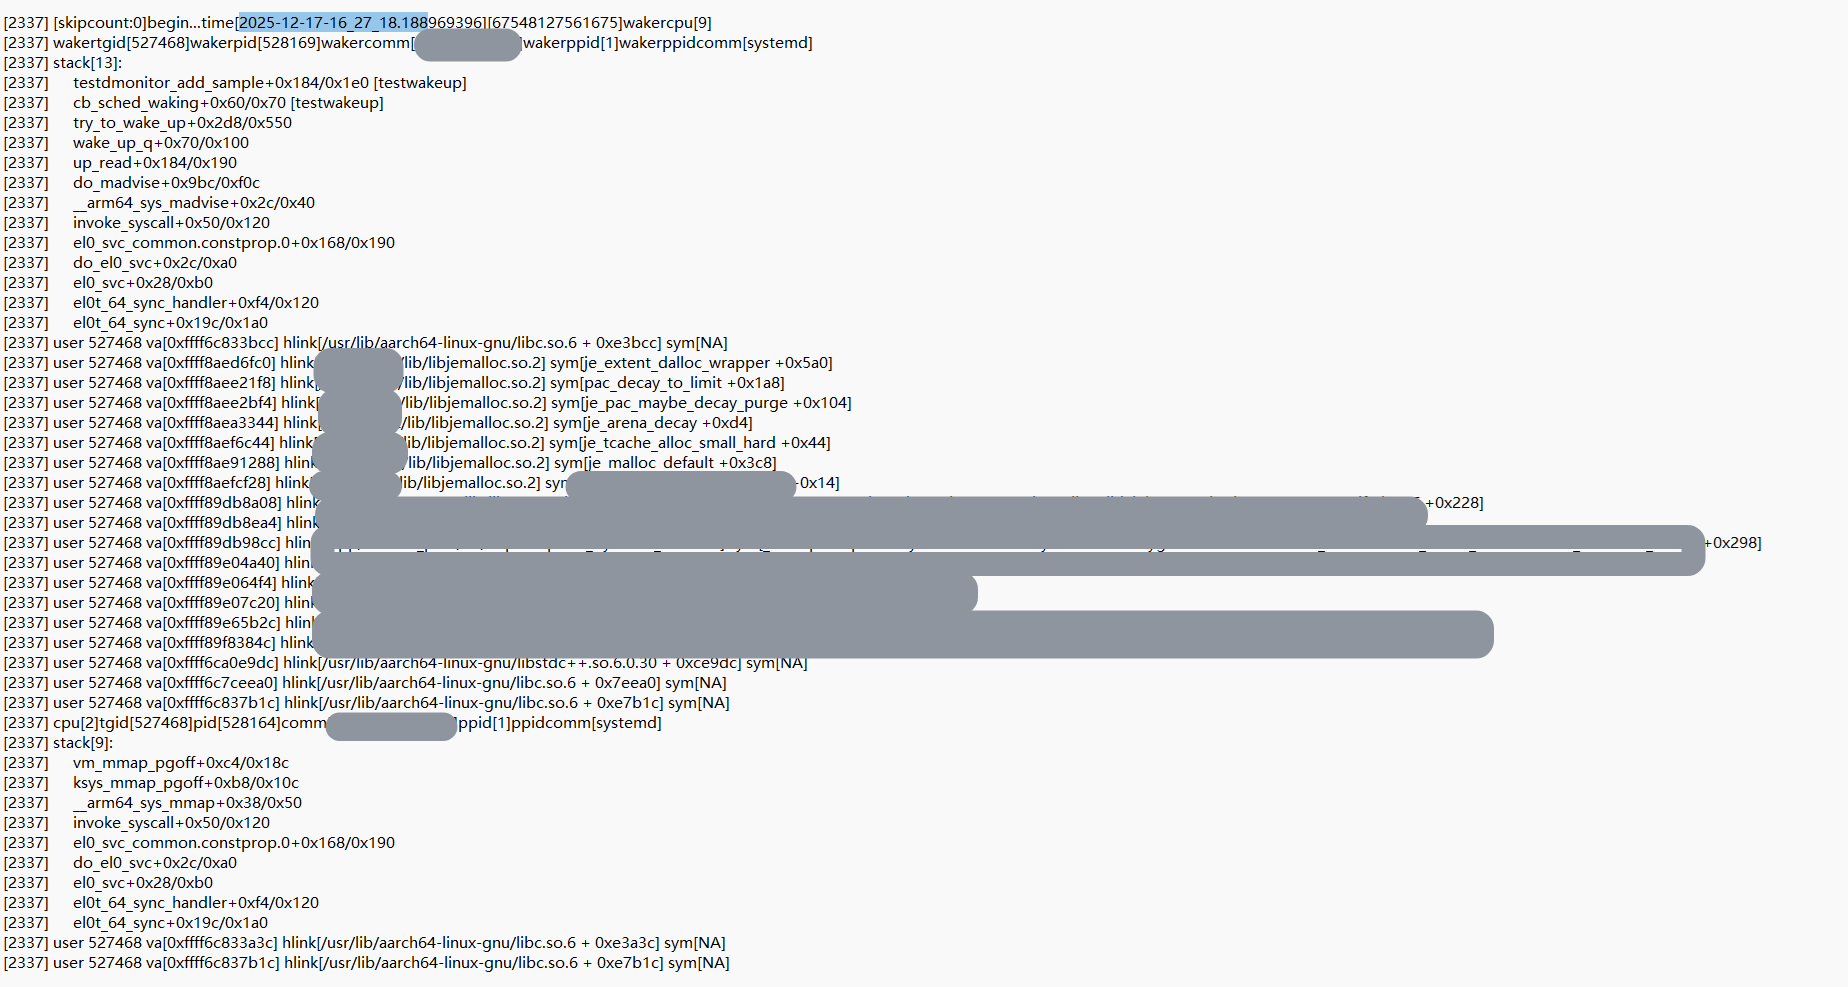
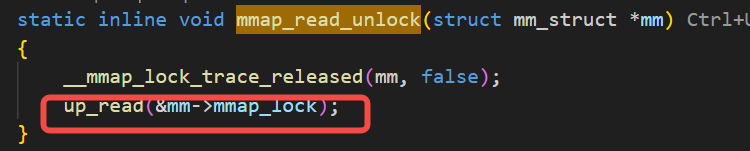
可以从上图里看到,唤醒者在执行内存分配的动作,内存分配用的jemalloc的库,在执行内存分配逻辑时触发了madvise的操作,而madvise的操作里有用到读写sem(上图里的up_read就是线索),这个读写sem,其实就是著名的mmap的读写sem,而被唤醒者也正在需要用这把mmap读写sem,因为被唤醒者在执行mmap的逻辑。do_madvise里调用的up_read的相关代码逻辑如下:
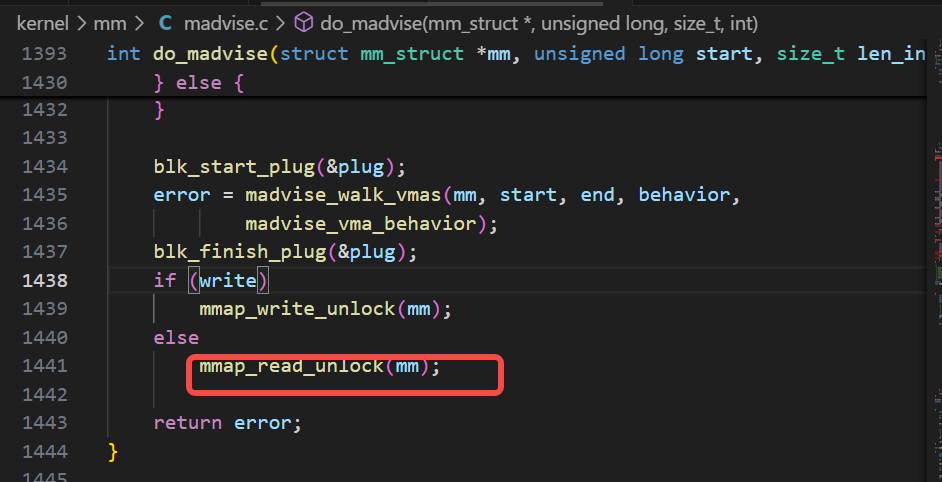
mmap的读写sem是一个进程内的锁,是一个与映射有关的内存操作都需要用到的一把常见锁,虽然rt-linux里的mutex和spinlock都是优先级继承的,但是读写锁并不是。
3.2 非正在运行的调用栈会抓取不全用户栈
可以从 3.1 里说到的抓到的下图的堆栈里可以看到:
被唤醒者,也就是在抓取时候没有正在运行的任务,其用户栈的抓取可能是不全的,无论是用perf抓还是用自己写的ko抓,都是一样的现象。
这种情况下,如果要进一步来找更细的用户栈,就需要去on-cpu的进行抓取,可通过:
bash
perf record -g -t <tid>来抓一个具体的线程,然后再perf script去找到底是哪个具体的调用链路执行的mmap系统调用。