1.前言
父组件-传递total值与data饼图数据
父组件正常请求访问后端数据获取饼图数据以及总数(总数前端亦可以自行计算)
javascript
<template>
<div class="team-composition">
<!-- 子组件调用 -->
<ChartComponent
:data="chartData"
:teamCountCount="totalNumber"
/>
</div>
</template>
<script setup lang="ts">
import { ref, onMounted } from 'vue'
import ChartComponent from './components/ImproveMechanismCircle.vue'
interface SeriesItem {
value: number;
name: string;
}
const chartData = ref<{
legendData: string[],
seriesData: SeriesItem[]
}>({
legendData: [],
seriesData: []
})
const totalNumber = ref<number>(0)
// 模拟API获取数据
onMounted(() => {
const mockData = [
{ value: 55, name: '前端开发' },
{ value: 45, name: '后端开发' },
{ value: 10, name: 'UI设计' }
]
chartData.value.seriesData = mockData
chartData.value.legendData = mockData.map(item => item.name)
totalNumber.value = mockData.reduce((acc, curr) => acc + curr.value, 0)
})
</script>
<style scoped>
/* 整体样式 */
.team-composition {
padding: 5px;
height: 100px;
width: 100%;
background-color: #4A698A;
color: #ffffff;
}
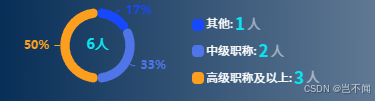
</style>子组件-接收数据圆环图进行渲染/信息面板根据需求进行调整修改
接收父组件传递数据进行圆环图形渲染,对应的基本圆环信息配置如代码所示,右侧信息面板渲染可过滤选择渲染图表数据或自定义渲染
javascript
<!-- 圆环数据展示 -->
<template>
  <div class="echarts-all">

    <!-- 饼图容器 -->
    <div class="echarts-left-chart">
      <div
        v-if="!hasPieData"
        class="progress-ring no-data-tip"
      >
        暂无数据
      </div>
      <div
        v-else
        ref="chartRef"
        class="progress-ring"
      ></div>
    </div>

    <!-- 根据UI自行调整-信息面板展示形式 -->
    <div class="echarts-right-info">
      <div
        v-for="item in enrichedSeriesData"
        :key="item.name"
        class="info-item"
      >
        <!-- 颜色块 -->
        <span class="color-indicator" :style="{ backgroundColor: item.color }"></span>
          {{ item.name }}:
        <!-- 数值 -->
        <span class="number-value">{{ item.value }}</span>
        <!-- 数字后信息 -->
        <span class="number-text">人</span>
      </div>
    </div>
  </div>
</template>

<script setup lang="ts">
import { onMounted, ref, watch, computed, onBeforeUnmount,nextTick} from 'vue'
import * as echarts from 'echarts'

interface PieDataItem {
  value: number
  name: string
  color?: string
}

interface ChartData {
  legendData: string[]
  seriesData: PieDataItem[]
}

const props = defineProps<{
  data: ChartData
  teamCountCount: number
}>()

const chartRef = ref<HTMLDivElement | null>(null)
let myChart: echarts.ECharts | null = null

// 判断是否有数据
const hasPieData = computed(() => {
  console.log('打印数据',props.data);

  return props.data.seriesData.length > 0
})
// ECharts 进度色块
const defaultColors = ['#1748fc', '#4F75E9', '#FC9E1E']
// 对应匹配进度色块
const processedData = computed(() => {
  return props.data.seriesData.map((item, index) => {
    const color = item.color || defaultColors[index % defaultColors.length]
    return {
      ...item,
      color,
      richKey: `R${index}` // 唯一标识,如 R0, R1
    }
  })
})

// 信息面板展示数据
const enrichedSeriesData = computed(() => {
  return processedData.value
  // return processedData.value.filter(
  //   (item) => item.name !== '其他' && item.name !== '其他职称' // 过滤掉其他职称
  // )
})

// 圆环中心值-总数
const getTotalCount = computed(() => props.teamCountCount ?? 0)

// 圆环
const initChart = () => {
  if (!chartRef.value) {
    console.warn('ECharts container not found')
    return
  }
  if (myChart) myChart.dispose()
  myChart = echarts.init(chartRef.value)

  // 动态构建 rich 配置-连线以及对应label
  const richConfig: Record<string, any> = {}
  processedData.value.forEach((item) => {
    richConfig[item.richKey] = {
      color: item.color,
      fontWeight: 'bold',
      fontSize: '1.4em'
    }
  })
  const option: echarts.EChartsOption = {
    // 圆环中心值
    graphic: {
      elements: [
        {
          type: 'text',
          left: 'center',
          top: 'middle',
          style: {
            text: `${getTotalCount.value}人`,
            align: 'center',
            verticalAlign: 'middle',
            fontSize: '1.2em',
            fontWeight: 'bold',
            fill: '#0de2f1'
          }
        }
      ]
    },
    // 鼠标移动上提示
    tooltip: {
      appendToBody: true,
      confine: true,
      trigger: 'item',
      padding: 5,
      backgroundColor: 'rgb(26 92 152 / 60%)',
      borderColor: '#409eff',
      textStyle: {
        color: '#fff',
        fontSize: '1em',
        fontFamily: 'var(--el-font-family-regular)'
      },
      formatter: function (params: any) {
        const { name, value, percent, color } = params
        return `<div style="display:flex; align-items:center;font-size:0.8rem;">
                <span style="font-weight:bold;">${name}</span></div>`
      }
    },
    // 对应进度色块
    color: defaultColors,
    // 圆环配置
    series: [
      {
        type: 'pie',
        radius: ['60%', '80%'],
        center: ['50%', '50%'],
        label: {
          show: true,
          position: 'outside',
          // position: 'inside', // 将标签放在扇形内部
          formatter: (params: any) => {
            const percent = Math.round(params.percent)
            return `{${params.data.richKey}|${percent}%}` // 应用 rich 样式
          },
          fontSize: '1.2em',
          rich: richConfig
        },
        labelLine: {
          show: true,
          length: 3,
          length2: 3
        },
        itemStyle: { borderRadius: 4 },
        data: processedData.value,
        emphasis: {
          itemStyle: {
            shadowBlur: 10,
            shadowOffsetX: 0,
            shadowColor: 'rgba(0, 0, 0, 0.5)'
          }
        }
      }
    ]
  }
  myChart.setOption(option)
}

// 图表resize适配
const handleResize = () => {
  if (myChart) {
    myChart.resize()
  }
}
onMounted(() => {
  initChart()
  window.addEventListener('resize', handleResize)
})

onBeforeUnmount(() => {
  window.removeEventListener('resize', handleResize)
  if (myChart) {
    myChart.dispose()
    myChart = null
  }
})
//  等待 DOM 更新后 init
watch(
  () => props.data,
  async () => {
    await nextTick()
    initChart()
  },
  { deep: true }
)
</script>

<style scoped lang="scss">

@mixin text-style($size, $family: var(--el-font-family-normal), $color: var(--el-text-color-primary)) {
  font-family: $family;
  font-size: $size;
  color: $color;
}

@function vh($px) {
  @return calc($px / 1080) * 100vh;
}

// 左侧圆环 + 右侧信息栏
.echarts-all {
  display: flex;
  align-items: center;
  width: 100%;
  height: 100%;
}

// 左侧圆环-包裹
.echarts-left-chart {
  height: 100%;
}

// 左侧圆环
.progress-ring {
  width: 190px;
  height: 100%;
  font-size: 10px;
}

// 右侧信息栏
.echarts-right-info {
  display: flex;
  flex-direction: column;
  width: 180px;
  height: vh(80);
}

// 右侧单个信息
.info-item{
  display: flex;
  gap: 2px;
  align-items: center;

  @include text-style(var(--font-14), var(--el-font-family-regular), #fff);
}

// 右侧单个颜色块
.color-indicator {
  display: inline-block;
  width: 12px;
  height: 12px;
  border-radius: 4px;
}

// 右侧单个数值
.number-value {
  @include text-style(var(--font-20), var(--el-font-family-bold), #0de2f1);
}

// 右侧单个数字后信息
.number-text {
  @include text-style(var(--font-16), var(--el-font-family-regular), rgba(255, 255, 255, 0.5));

  line-height: vh(16);
}

// 无数据展示
.no-data-tip {
  display: flex;
  align-items: center;
  justify-content: center;

  @include text-style(var(--font-14), var(--el-font-family-regular), rgba(255, 255, 255, 0.6));
}
</style>