生信基地圣诞树~
MERRY CHRISTMAS
写在前面
祝大家圣诞节快乐!Merry Christmas!愿大家在这冬日里邂逅所有美好与惊喜,科研顺利,文章多多~
圣诞节来临意味着2025年也快进入尾声,Biomamba 生信基地 在这一年里为大家呈现许多丰富的内容,其中包含三个全程班(R语言 scRNA-seq分析、Python scRNA-seq分析和Python 空间转录组分析)和2025年订阅资料。这里我主要展示我们手册和课程中使用到的工具,并绘制了三个圣诞树:2025订阅圣诞树 ,单细胞工具圣诞树、空转工具圣诞树,供大家学习和参考。(圣诞树代码:参考如何用R语言生成词云和Jodie Burchel的教程1)
------Biomamb
圣诞树展示
生信基地圣诞树,文末有大图~
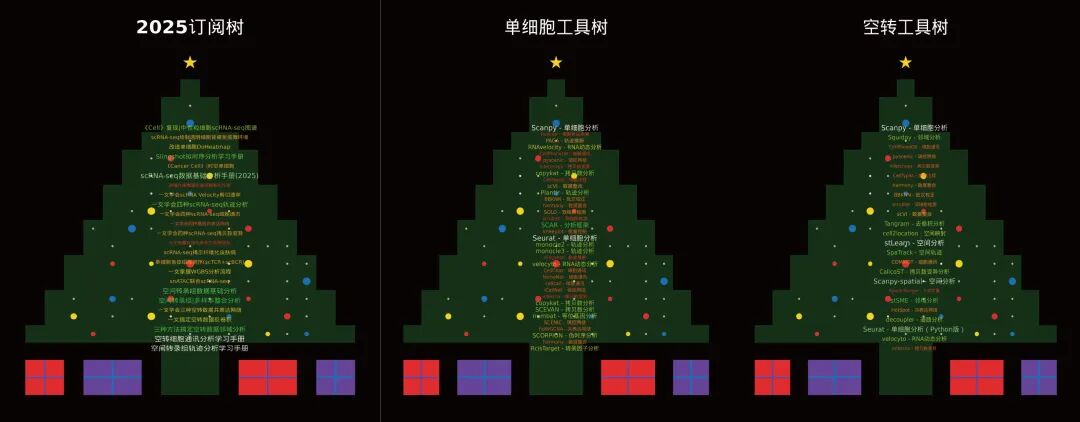

2025订阅圣诞树的词条为:
《Cancer Cell》|时空单细胞揭示CRC的PD-1治疗免疫细胞动态
代码复现|吞噬作用增强肿瘤中巨噬细胞的氧化代谢和免疫抑制特征
肿瘤异质性分析必备| 一文学会四种scRNA-seq拷贝数变异分析
代码复现| scRNA-seq揭示人纤维化皮肤病中的成纤维细胞异质性与增殖
《NC》代码复现|snATAC联合scRNA-seq揭示小鼠肾脏细胞分化程序与疾病靶点
三种方法教你搞定空转数据邻域分析:squidpy+stSME+NMF分解
空转细胞通讯分析学习手册:CellPhoneDB+Commot+stLearn
《Nature Genetics》文献复写 | 结直肠癌免疫细胞的高清空转分析(Visium HD+Xeniu)
向下滑动查看更多内容
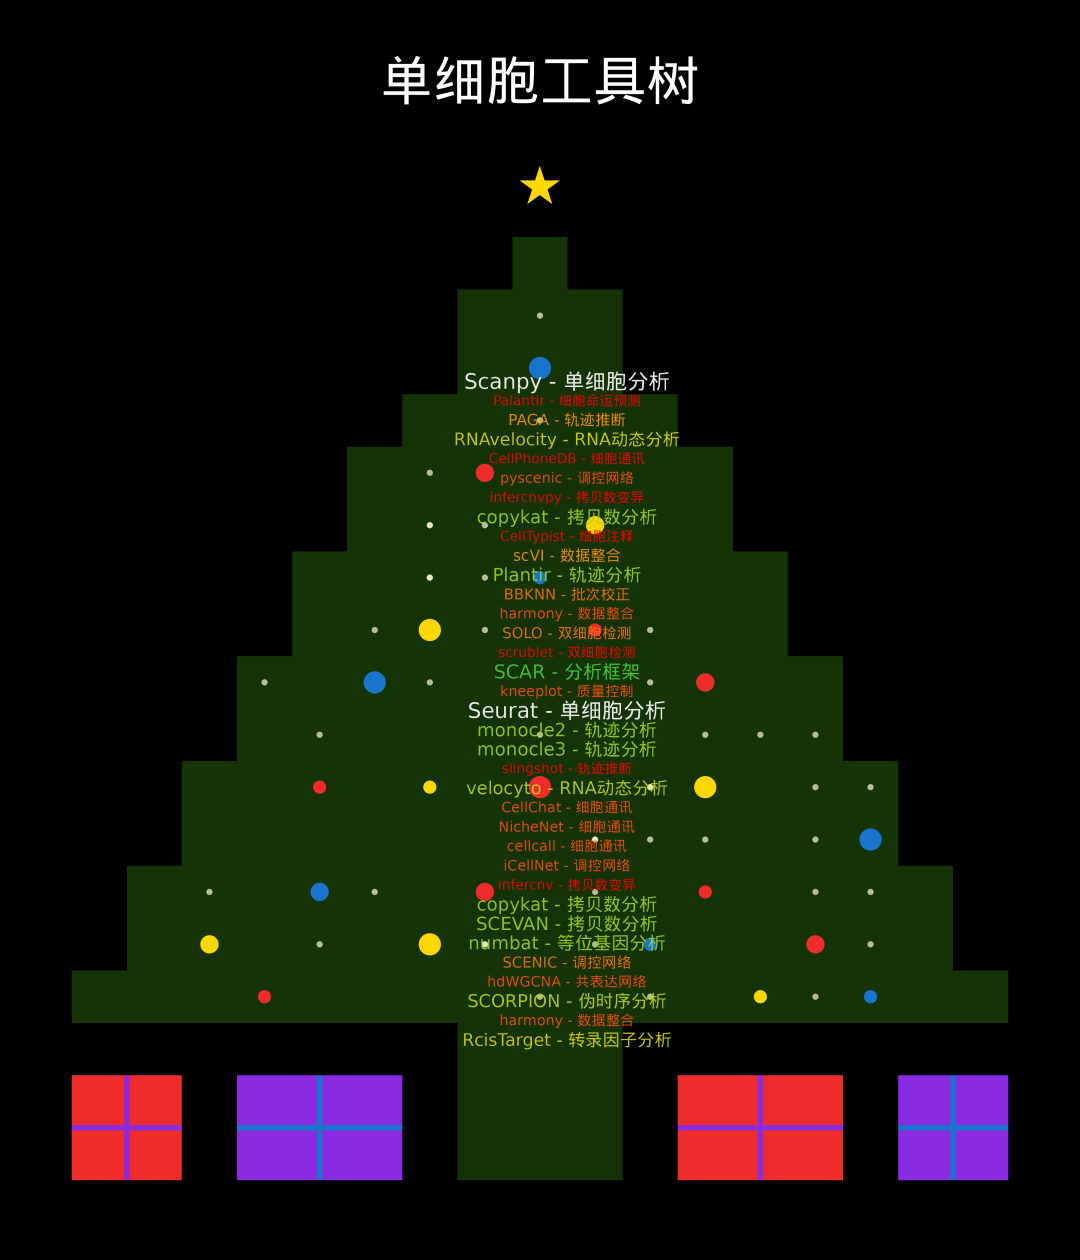
单细胞圣诞树的词条为:
Python版本的是我们2026年的订阅合集,欢迎大家订阅和关注~
向下滑动查看更多内容
空间转录组圣诞树的词条为:
向下滑动查看更多内容
圣诞树绘制代码
# 安装并加载必要的包
if (!require("ggplot2")) install.packages("ggplot2")
if (!require("ggwordcloud")) install.packages("ggwordcloud")
if (!require("dplyr")) install.packages("dplyr")
if (!require("cowplot")) install.packages("cowplot")
if (!require("grid")) install.packages("grid")
library(ggplot2)
library(ggwordcloud)
library(dplyr)
library(cowplot)
library(grid)
# 1. 定义您的词条(完整列表)
terms <- c(
换成上面的词条
)
# 创建词云数据框 - 竖排只需要每个词条一次
create_wordcloud_data <- function(terms) {
  df <- data.frame(
    word = terms,
    freq = sapply(terms, function(x) {
      base_freq <- 50 / sqrt(nchar(x))  # 基础频率
      keywords <- c("scRNA", "空转", "空间", "单细胞", "复现", "分析", "手册")
      keyword_bonus <- sum(sapply(keywords, function(kw) grepl(kw, x, fixed = TRUE))) * 8
      return(round(base_freq + keyword_bonus))
    })
  )
  return(df)
}
wordcloud_data <- create_wordcloud_data(terms)
# 2. 创建竖排词云图形 - 只有一列,缩小行间距,隐藏图例
create_vertical_wordcloud <- function(data) {
  # 计算竖排位置
  n <- nrow(data)
  # 在圣诞树中心创建一列位置
  # x坐标固定在一个位置,y坐标从上到下分布
  # 缩小行间距:将y范围从18-5改为18-7,间距更小
  x_pos <- rep(11, n)  # 固定在中心位置x=11
  y_pos <- seq(17.5, 6, length.out = n)  # 从上到下分布,缩小行间距
  # 创建数据框包含位置信息
  data$x <- x_pos
  data$y <- y_pos
  # 创建竖排词云 - 保留颜色渐变但隐藏图例
  p <- ggplot(data, aes(x = x, y = y, label = word, size = freq, color = freq)) +
    geom_text(
      hjust = 0.5,  # 水平居中
      vjust = 0.5,  # 垂直居中
      angle = 0,    # 不旋转
      alpha = 0.9,  # 透明度
      family = "STHeiti"  # 中文字体,如果没有可以改为"sans"
    ) +
    scale_size_area(max_size = 6, guide = "none") +  # 隐藏字体大小图例
    # 圣诞树配色:红色、金色、绿色、白色 - 保留渐变
    scale_color_gradientn(
      colors = c("#FF0000", "#FFD700", "#32CD32", "#FFFFFF"),
      guide = "none"  # 关键:隐藏颜色图例
    ) +
    theme_void() +
    theme(
      plot.background = element_rect(fill = "transparent", color = NA),
      panel.background = element_rect(fill = "transparent", color = NA),
      plot.margin = margin(0, 0, 0, 0),
      legend.position = "none"  # 确保没有任何图例
    ) +
    # 限制坐标范围到圣诞树绿色区域
    xlim(5, 17) +
    ylim(5, 18)
  return(p)
}
# 3. 创建圣诞树图形(修正版)- 保持原样
create_christmas_tree <- function() {
  # 圣诞树数据
  Tree.X <- c(10, 11, 12, 10, 11, 12, 10, 11, 12, 3, 4, 5, 6, 7, 8, 9, 10, 11, 12, 13, 14, 15, 16, 17, 18, 19, 4, 5, 6, 7, 8, 9, 10, 11, 12, 13, 14, 15, 16, 17, 18, 4, 5, 6, 7, 8, 9, 10, 11, 12, 13, 14, 15, 16, 17, 18, 5, 6, 7, 8, 9, 10, 11, 12, 13, 14, 15, 16, 17, 5, 6, 7, 8, 9, 10, 11, 12, 13, 14, 15, 16, 17, 6, 7, 8, 9, 10, 11, 12, 13, 14, 15, 16, 6, 7, 8, 9, 10, 11, 12, 13, 14, 15, 16, 7, 8, 9, 10, 11, 12, 13, 14, 15, 7, 8, 9, 10, 11, 12, 13, 14, 15, 8, 9, 10, 11, 12, 13, 14, 8, 9, 10, 11, 12, 13, 14, 9, 10, 11, 12, 13, 10, 11, 12, 10, 11, 12, 11, 6, 7, 8, 6, 7, 8, 3, 4, 3, 4, 14, 15, 16, 14, 15, 16, 18, 19, 18, 19)
  Tree.Y <- c(1, 1, 1, 2, 2, 2, 3, 3, 3, 4, 4, 4, 4, 4, 4, 4, 4, 4, 4, 4, 4, 4, 4, 4, 4, 4, 5, 5, 5, 5, 5, 5, 5, 5, 5, 5, 5, 5, 5, 5, 5, 6, 6, 6, 6, 6, 6, 6, 6, 6, 6, 6, 6, 6, 6, 6, 7, 7, 7, 7, 7, 7, 7, 7, 7, 7, 7, 7, 7, 8, 8, 8, 8, 8, 8, 8, 8, 8, 8, 8, 8, 8, 9, 9, 9, 9, 9, 9, 9, 9, 9, 9, 9, 10, 10, 10, 10, 10, 10, 10, 10, 10, 10, 10, 11, 11, 11, 11, 11, 11, 11, 11, 11, 12, 12, 12, 12, 12, 12, 12, 12, 12, 13, 13, 13, 13, 13, 13, 13, 14, 14, 14, 14, 14, 14, 14, 15, 15, 15, 15, 15, 16, 16, 16, 17, 17, 17, 18, 1, 1, 1, 2, 2, 2, 1, 1, 2, 2, 1, 1, 1, 2, 2, 2, 1, 1, 2, 2)
  Tree.Colour <- c(
    rep("#143306", 148),
    rep("blueviolet", 6),
    rep("firebrick2", 10),
    rep("blueviolet", 4)
  )
  ChristmasTree <- data.frame(Tree.X, Tree.Y, Tree.Colour)
  tree <- ggplot() +
    geom_tile(data = ChristmasTree, aes(x = Tree.X, y = Tree.Y, fill = Tree.Colour)) +
    scale_fill_identity() +
    theme_void() +
    labs(x = "", y = "") +
    theme(
      plot.background = element_rect(fill = "black", color = NA),
      plot.margin = margin(20, 20, 20, 20),
      panel.background = element_rect(fill = "black", color = NA)
    )
  # 添加装饰灯光
  set.seed(123)
  Desired.Lights <- 50
  Lights <- data.frame(
    Lights.X = c(round(runif(round(Desired.Lights * 0.35), 4, 18), 0),
                 round(runif(round(Desired.Lights * 0.20), 5, 17), 0),
                 round(runif(round(Desired.Lights * 0.17), 6, 16), 0),
                 round(runif(round(Desired.Lights * 0.13), 7, 15), 0),
                 round(runif(round(Desired.Lights * 0.10), 8, 14), 0),
                 round(runif(round(Desired.Lights * 0.05), 10, 12), 0)),
    Lights.Y = c(round(runif(round(Desired.Lights * 0.35), 4, 6), 0),
                 round(runif(round(Desired.Lights * 0.20), 7, 8), 0),
                 round(runif(round(Desired.Lights * 0.17), 9, 10), 0),
                 round(runif(round(Desired.Lights * 0.13), 11, 12), 0),
                 round(runif(round(Desired.Lights * 0.10), 13, 14), 0),
                 round(runif(round(Desired.Lights * 0.05), 15, 17), 0))
  )
  tree <- tree +
    geom_point(data = Lights, aes(x = Lights.X, y = Lights.Y),
               colour = "lightgoldenrodyellow", shape = 16, size = 2, alpha = 0.7)
  # 添加装饰球
  Baubles <- data.frame(
    Bauble.X = c(6, 9, 15, 17, 5, 13, 16, 7, 10, 14, 7, 9, 11,
                 14, 8, 14, 9, 12, 11, 12, 14, 11, 17, 10),
    Bauble.Y = c(4, 5, 4, 4, 5, 5, 5, 6, 6, 6, 8, 8, 8, 8, 10,
                 10, 11, 11, 12, 13, 10, 16, 7, 14),
    Bauble.Colour = factor(c(1, 2, 2, 3, 2, 3, 1, 3, 1, 1, 1, 2, 1, 2,
                             3, 3, 2, 1, 3, 2, 1, 3, 3, 1)),
    Bauble.Size = c(1, 3, 1, 1, 2, 1, 2, 2, 2, 1, 1, 1, 3, 3, 3,
                    2, 3, 1, 1, 2, 2, 3, 3, 2)
  )
  tree <- tree +
    geom_point(data = Baubles, aes(x = Bauble.X, y = Bauble.Y,
                                   colour = Bauble.Colour, size = Bauble.Size),
               shape = 16) +
    scale_colour_manual(values = c("firebrick2", "gold", "dodgerblue3")) +
    scale_size_area(max_size = 8) +
    theme(legend.position = "none")
  # 添加底座装饰
  tree <- tree +
    geom_segment(aes(x = 2.5, xend = 4.5, y = 1.5, yend = 1.5),
                 colour = "blueviolet", linewidth = 2) +
    geom_segment(aes(x = 5.5, xend = 8.5, y = 1.5, yend = 1.5),
                 colour = "dodgerblue3", linewidth = 2) +
    geom_segment(aes(x = 13.5, xend = 16.5, y = 1.5, yend = 1.5),
                 colour = "blueviolet", linewidth = 2) +
    geom_segment(aes(x = 17.5, xend = 19.5, y = 1.5, yend = 1.5),
                 colour = "dodgerblue3", linewidth = 2) +
    geom_segment(aes(x = 3.5, xend = 3.5, y = 0.5, yend = 2.5),
                 colour = "blueviolet", linewidth = 2) +
    geom_segment(aes(x = 7.0, xend = 7.0, y = 0.5, yend = 2.5),
                 colour = "dodgerblue3", linewidth = 2) +
    geom_segment(aes(x = 15.0, xend = 15.0, y = 0.5, yend = 2.5),
                 colour = "blueviolet", linewidth = 2) +
    geom_segment(aes(x = 18.5, xend = 18.5, y = 0.5, yend = 2.5),
                 colour = "dodgerblue3", linewidth = 2)
  # 添加树顶星星
  tree <- tree +
    annotate("text", x = 11, y = 19.5, label = "★",
             size = 15, color = "gold", family = "serif")
  # 添加标题
  tree <- tree +
    annotate("text", x = 11, y = 21.5,
             label = "生物信息学知识树",
             color = "white", size = 6, fontface = "bold")
  return(tree)
}
# 4. 创建组合图形 - 调整叠加位置
create_combined_plot <- function() {
  # 创建圣诞树
  tree_plot <- create_christmas_tree()
  # 创建竖排词云
  wc_plot <- create_vertical_wordcloud(wordcloud_data)
  # 使用cowplot组合图形
  combined <- ggdraw() +
    # 首先绘制圣诞树背景
    draw_plot(tree_plot, x = 0, y = 0, width = 1, height = 1) +
    # 然后在圣诞树上方叠加竖排词云
    draw_plot(wc_plot,
              x = 0.2,   # 水平位置
              y = 0.1,   # 垂直位置
              width = 0.65,  # 宽度
              height = 0.65) # 高度
  return(combined)
}
# 5. 生成并显示组合图形
combined_plot <- create_combined_plot()
print(combined_plot)
# 6. 保存图片
ggsave("bioinfo_christmas_tree.png",
       combined_plot,
       width = 12,
       height = 14,
       dpi = 300,
       bg = "black")
输入不同的词条,可依次得到图片:


参考:
1https://zhuanlan.zhihu.com/p/449852173
MERRY CHRISTMAS
圣诞节快乐
MERRY CHRISTMAS圣节诞快乐
BEST WISHES美好祝福送给你

圣诞快乐