一、实际调试AEC参考与麦克风延时
上一章节我们使用工具分析了延时,这一次我们继续调试:
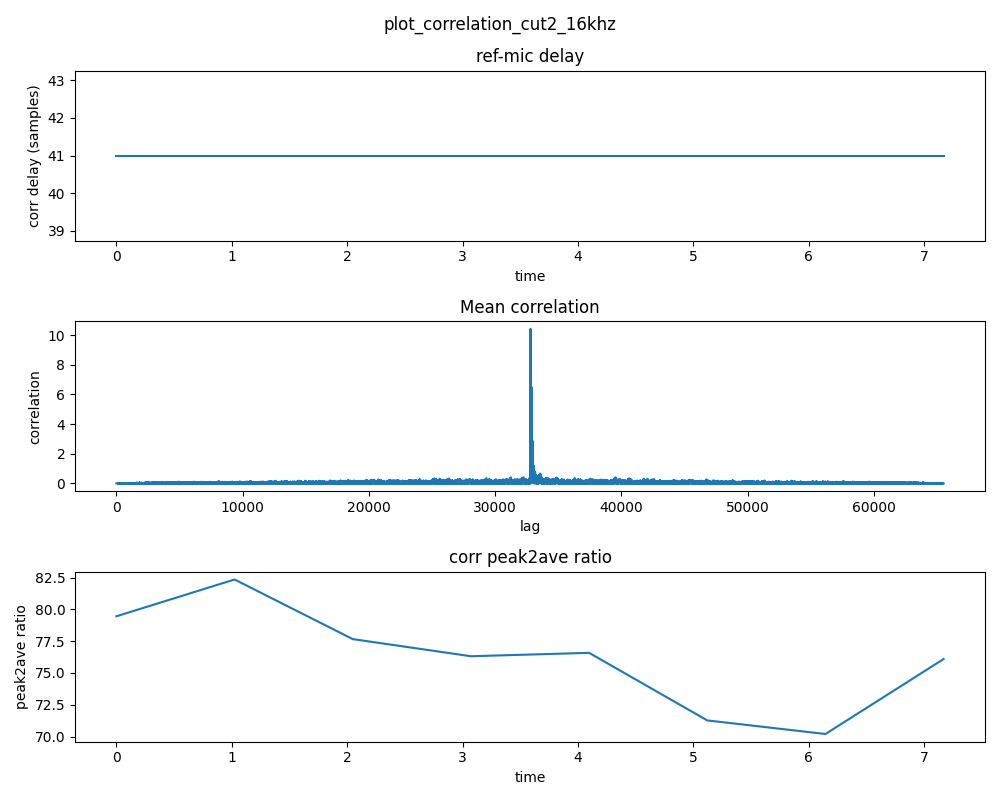
默认 AUDIO_MGR_SYS_DELAY 的值为-32 测量演示如下图为41个样本(未在40以内):
这里我们直接设置AUDIO_MGR_SYS_DELAY 的值为0 (延时参考信号):
xvf_host --use i2c AUDIO_MGR_SYS_DELAY 0测得延时为9个样本:
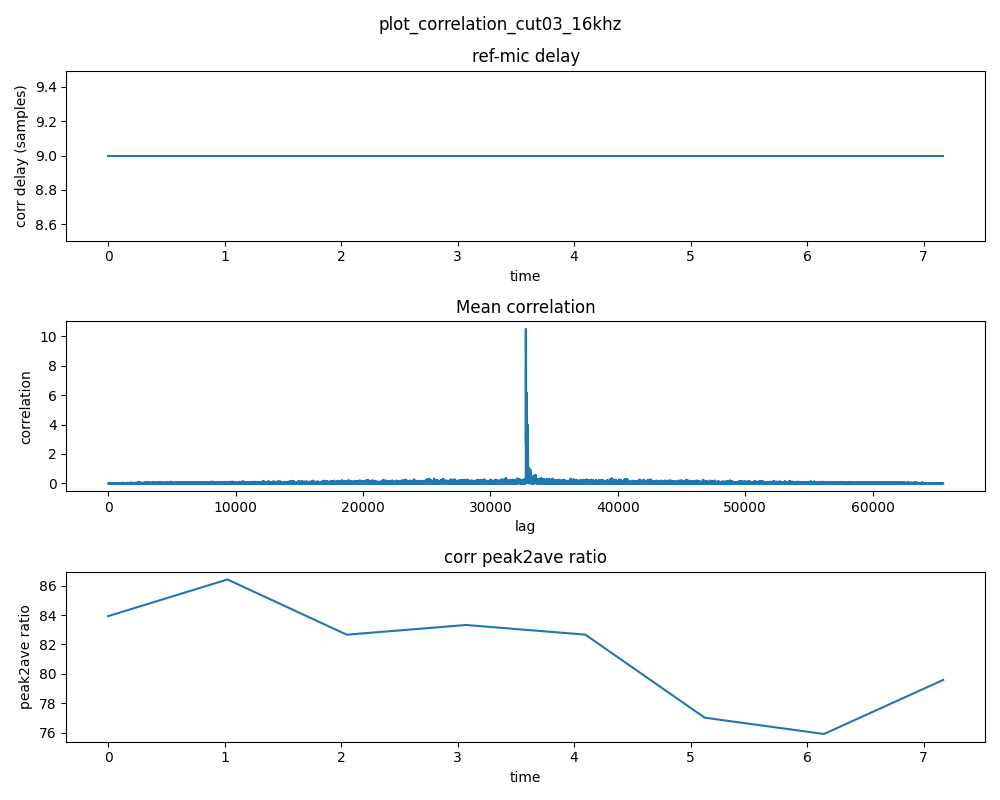
这里 9 = 41 -32 (非常精确的展示了延时参考信号后对齐的样本数量!!!)
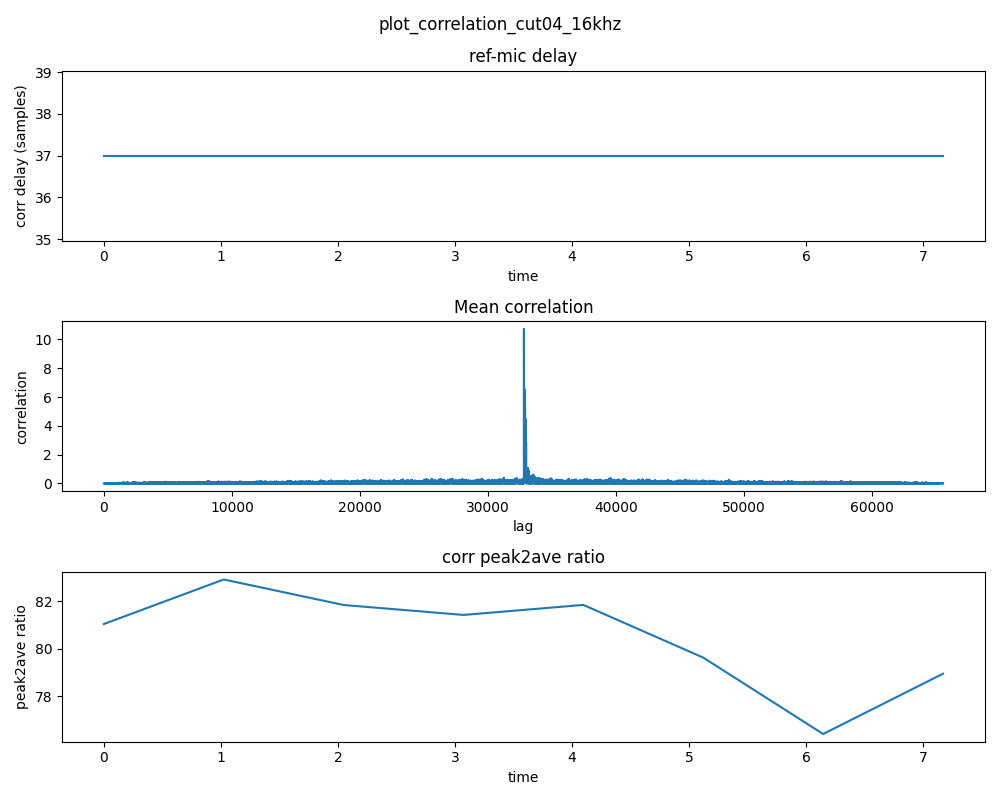
为了使延时小于40个采样点的动态余量,设置AUDIO_MGR_SYS_DELAY为 -28,推测41 - (32-28) = 41 - 4 = 37(延时样本满足动态余量又小于40!!)
如下图所示:非常精准的展示了如何调整AEC的延时!!!(请分别对4个MIC分别进行测量因果关系!并找到平衡值!)
二、确认AEC是否收敛
AEC 收敛(Acoustic Echo Cancellation Convergence) ,指的是回声消除算法中的自适应滤波器,逐步学习并逼近真实"回声路径",直到回声被有效消除、系统进入稳定工作的过程。
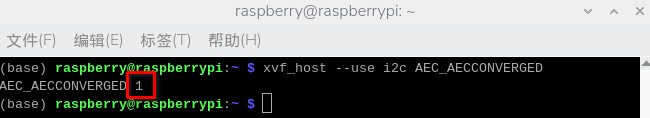
此时我们播放一段测试音频,并读取AEC_AECCONVERGED的值,1 表示自适应滤波器学习完成,即收敛成功。
xvf_host --use i2c AEC_AECCONVERGED收敛成功:
三、读取AEC系数
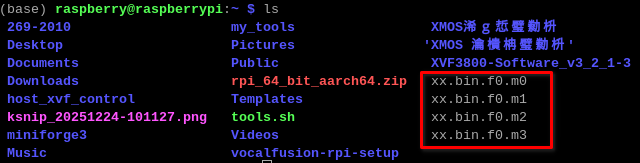
当AEC收敛成功后,输入如下命令采集4个 AEC模块的参数(XVF3800对每一路麦克风都做了AEC回声消除处理!!!)
python
xvf_host --use i2c -gf xx.bin我在home目录下执行的生成了如下四个文件:
进入conda安装所有依赖环境下执行如下命令:
python3 /home/raspberry/XVF3800-Software_v3_2_1-3/sources/xvf_tools.py read_aec_filter xx.bin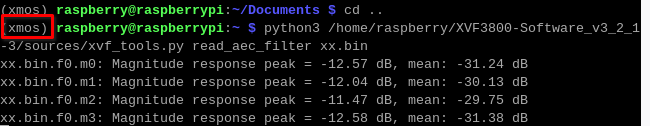
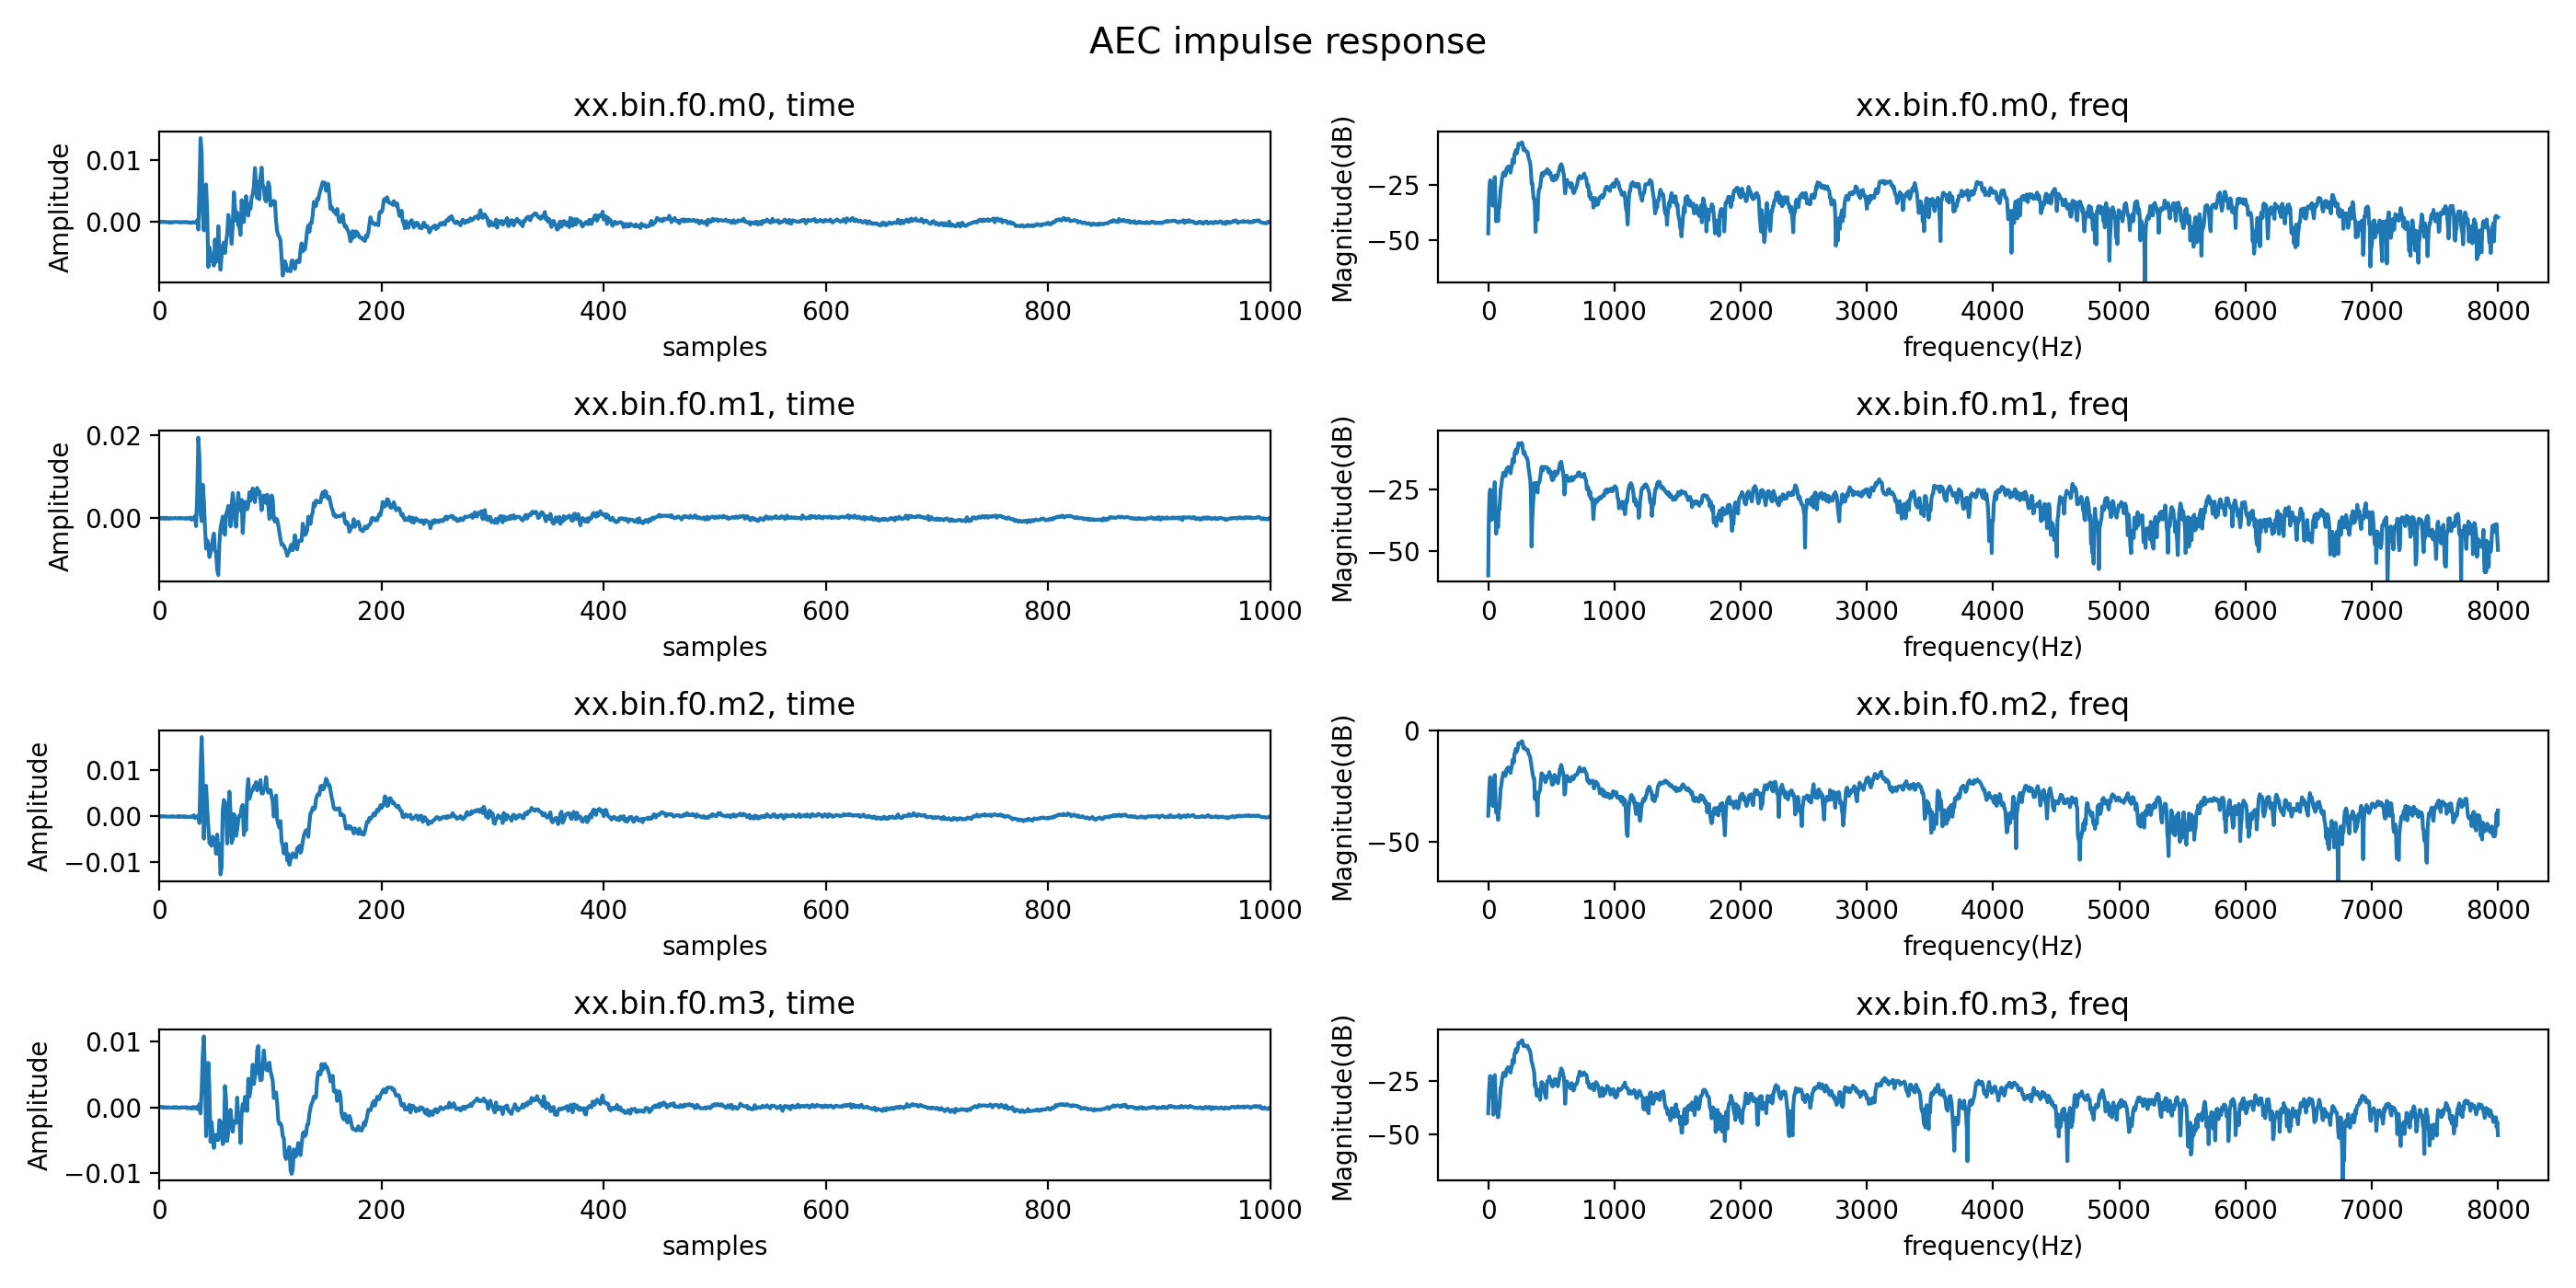
这里我们来详细分析,这个过程是干了什么:
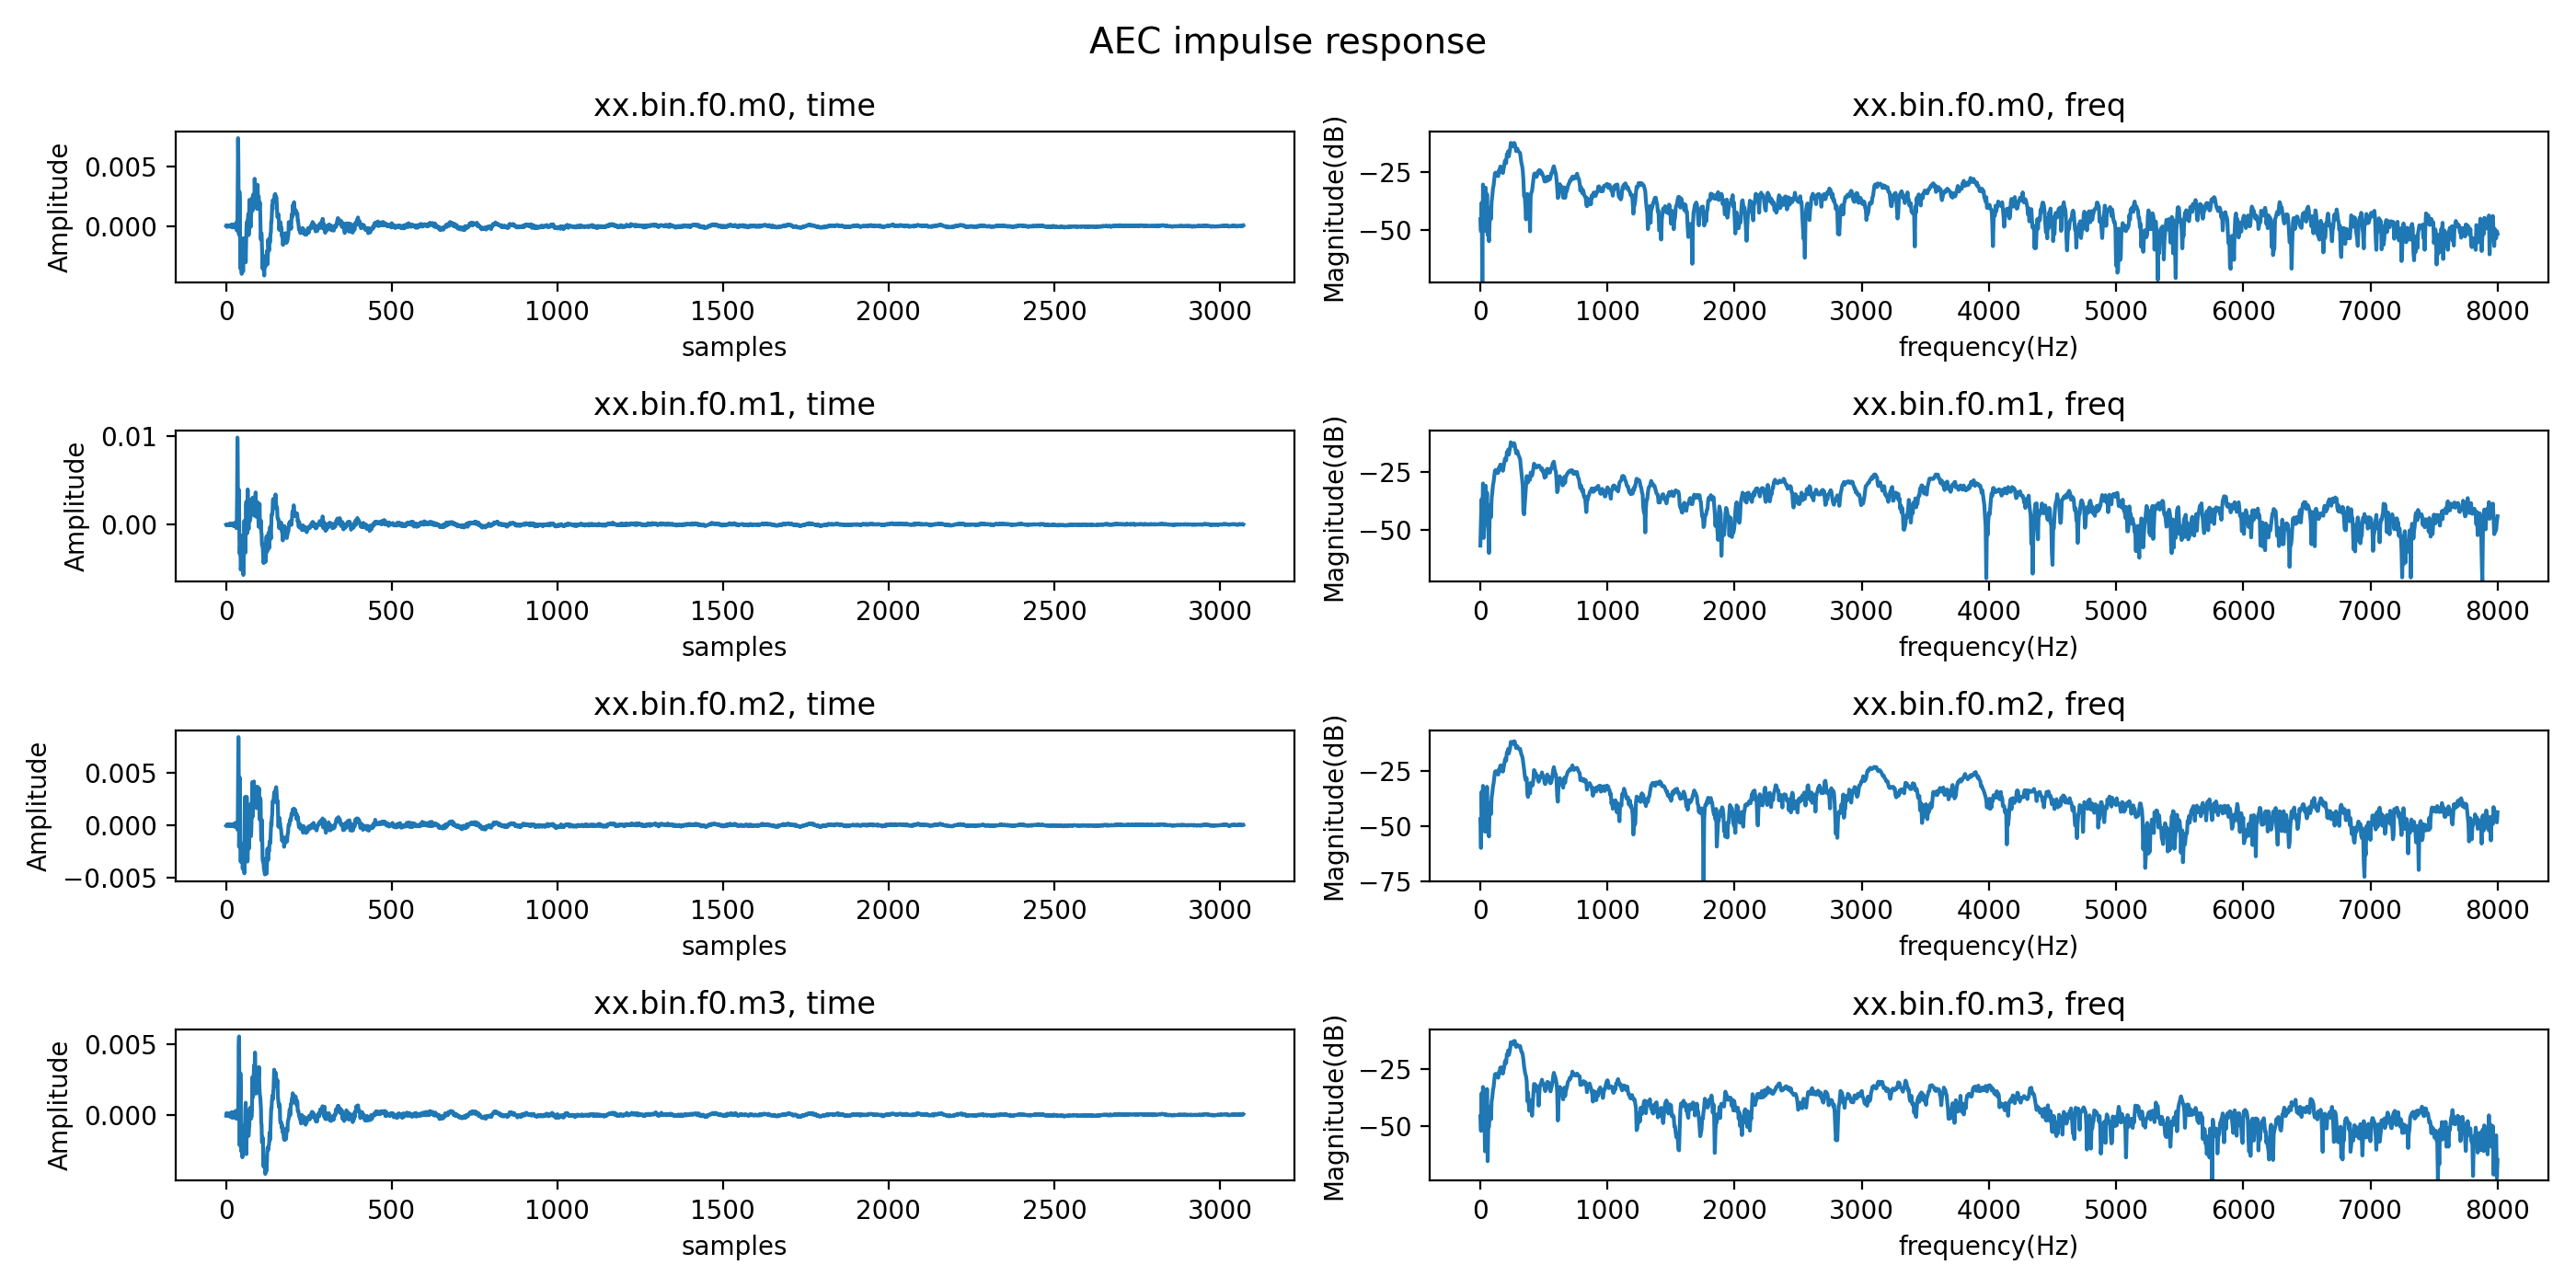
时域分析(左图):
- 冲激响应形状:应类似房间冲激响应
- 能量分布:主要能量应集中在早期样本(我们集中在200个样本以内!后面拖尾很快衰减到接近 0,即收敛了!!)
- 滤波器长度:反映 AEC 可处理的延迟范围
频域分析(右图):
- 频率响应:显示不同频率的增益
- 峰值位置:可能对应主要回声路径的频率特性(低频能量偏高,中频相对平滑,高频衰减明显噪声占主导说明喇叭低频更强,高频在空气 + 壳体中被衰减,AEC 在高频主要靠 RES(残余回声抑制))
- 动态范围:-75dB 以下通常表示噪声或未使用的频率
统计信息:
- 峰值功率:反映滤波器的主要能量
- 平均功率:反映整体滤波器能量水平
上图我们为了观察到左图与延时的对应关系,我们修改 XVF3800-Software_v3_2_1-3/sources/modules/fwk_xvf/modules/tuning/tuning目录下的代码 read_aec_filter.py文件,替换如下代码(限制为200默认 增加-t参数 自定义样本数量):
python
# Copyright 2023 XMOS LIMITED.
# This Software is subject to the terms of the XCORE VocalFusion Licence.
import argparse
import numpy as np
from pathlib import Path
import matplotlib.pyplot as plt

"""
This script is used for plotting the XVF38xx AEC filter coefficients that are read from the device
by using the hostapp -gf <filename.bin> option.
Please note that the input argument to this script is the filename.bin without the .f<x>m<y> extension, so
the same filename that was used in the -gf option when retrieving the filter from the device.

Requirements:
    python3
    numpy
    matplotlib

Usage
    python3 read_aec_filter.py <aecfilter.bin>

Normally, this script is run after retrieving the filter coefficients from the device.
For example, from the <path_to_host_app>/build directory, one would run:
    sudo ./xvf_host -gf aecfilt.bin
    python3 ../python/read_aec_filter.py aecfilt.bin
"""
def read_aec_filter(filelist, show_plot, time_samples=200):
    num_files = len(filelist)
    fig, axs = plt.subplots(num_files, 2, figsize=(14,7))

    fig.suptitle('AEC impulse response', fontsize=14)
    for i in range(len(filelist)):
        axs[i,0].set_title(f'{filelist[i].name}, time')
        axs[i,1].set_title(f'{filelist[i].name}, freq')
        buf = np.fromfile(str(filelist[i]), dtype=np.float32)
        Buf = np.fft.rfft(buf)
        freq = np.linspace(0, 8000, num=int(len(buf)/2)+1) # Map 0-8kHz into 3072/2 bins
        H = 20*np.log10(np.abs(Buf + 1e-39))
        H_mean = 10*np.log10(np.mean(np.abs(Buf)**2) + 1e-39)
        print(f"{filelist[i].name}: Magnitude response peak = {np.max(H):.2f} dB, mean: {H_mean:.2f} dB")

        # Only plot the first time_samples samples for time domain view
        plot_samples = min(time_samples, len(buf))
        axs[i,0].plot(buf[:plot_samples])
        axs[i,0].set(xlabel='samples', ylabel='Amplitude')
        axs[i,0].set_xlim([0, plot_samples])
        axs[i,1].plot(freq, H)
        axs[i,1].set(xlabel='frequency(Hz)', ylabel='Magnitude(dB)')
        axs[i,1].set_ylim([max(-75, np.min(H)), np.max(H)+5])
        if i:
            axs[i,0].sharex(axs[0,0])
            axs[i,1].sharex(axs[0,1])

    figinstance = plt.gcf()
    if show_plot:
        plt.tight_layout()
        plt.show()

    plot_name = filelist[0].name.split('.')[0] + ".png"
    print(f"Filter plot saved in {plot_name}")
    figinstance.savefig(plot_name, dpi=200)


if __name__ == "__main__":
    parser = argparse.ArgumentParser("Plot the AEC filter files that have been read from the device using the host app's -gf option")
    parser.add_argument('aecfilter_file', type=str,
                        help='AEC filter .bin file without the .f<x>m<y> extension',
                        )
    parser.add_argument('--num-mics', '-m', type=int, default=4, help='number of mic inputs. Default=4')
    parser.add_argument('--num-ref', '-r', type=int, default=1, help='number of far end inputs. Default=1')
    parser.add_argument('--time-samples', '-t', type=int, default=200, help='number of time domain samples to display. Default=200')

    args = parser.parse_args()
    filelist = []
    for f in range(args.num_ref):
        for m in range(args.num_mics):
            name = Path(str(args.aecfilter_file) + f'.f{f}.m{m}')
            if not name.is_file():
                print(f"Error: file {name} not found")
                exit(1)
            filelist.append(name)

    show_plot = True
    read_aec_filter(filelist, show_plot, args.time_samples)
重新执行
python
python3 /home/raspberry/XVF3800-Software_v3_2_1-3/sources/xvf_tools.py read_aec_filter xx.bin输出:
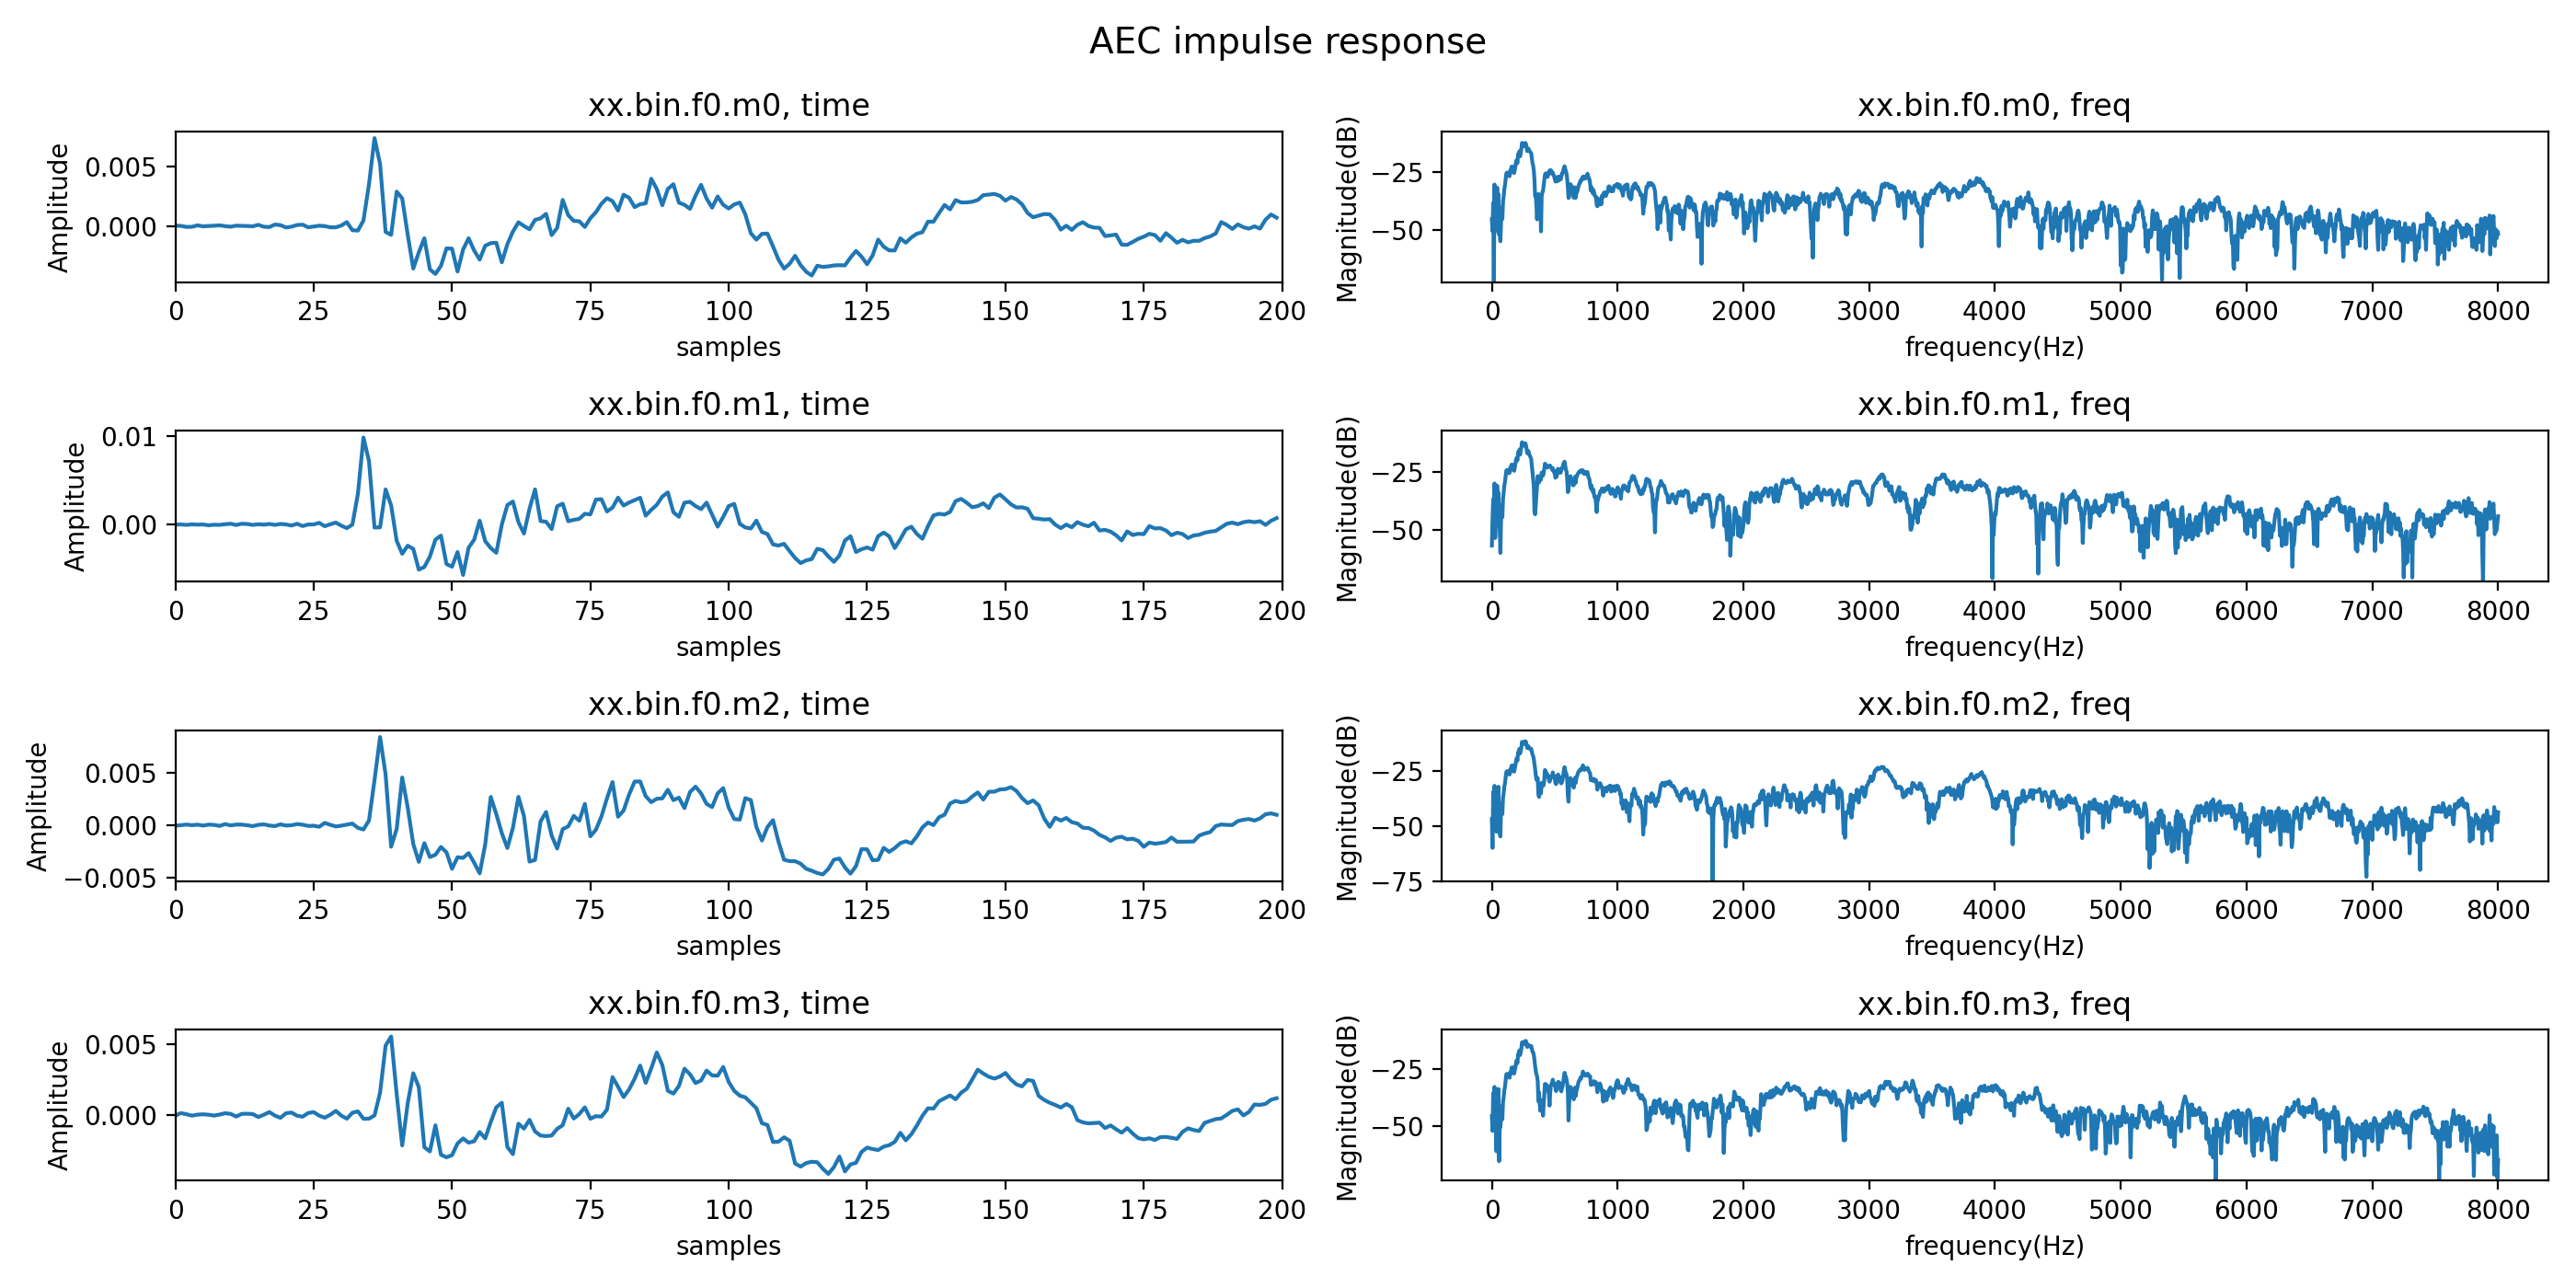
如图所示:第一个麦克风的左图的地一个峰值样本大概在25 + 25 / 2 = 37个与测量值是一致的!只是在收敛的过程中有些缓慢!
在条参数的过程中:
频域的峰值系数和平均系数都应该小于0dB:
AEC 的自适应滤波器 ≈ 一个 FIR 回声路径模型
在频域看,就是:从扬声器 → 麦克风 的传递函数 H(f)
这个 H(f) 是物理系统,它有一个铁律:被动声学系统不可能整体"放大"信号!平均增益 > 0 dB在物理上是不合理的!(声音从扬声器发出,经过空气传播、墙壁反射、家具吸收,最终到达麦克风。 这个过程只能衰减能量,不能增加能量。)
如果平均增益 > 0 dB,意味着AEC滤波器在整体上"放大了"参考信号,这在物理上不可能,只可能是:
- 系统延迟补偿错误(SYS_DELAY 设置不当,导致非因果关系)
- 麦克风增益过高(MIC_GAIN 太大),设置AUDIO_MGR_MIC_GAIN来满足要求!
- 或参考信号(FAR)相对太小
在AEC调试中,频率域系数均值,数值越低(更负)说明整体衰减越多,通常更安全;但也不能太低,就是为了确保滤波器整体不会放大信号,否则回声消除力度不足。
峰值系数(peak coefficient value)建议接近0 dB:
在声学回声路径中,通常存在一条最强的直达声路径(direct path):
- 这是扬声器到麦克风的最短路径,几乎没有反射。
- 它的能量在整个回声路径中占比最高,对应冲激响应的第一个主峰(时间域的strong first peak)。
- 在频率域,这个直达声路径在宽频带上贡献了一个相对平坦的增益(因为传播距离短,吸收少)。
因此:
- peak coefficient value 本质上主要反映了直达声路径的增益。
- 如果 peak ≈ 0 dB(即 ≈1),意味着AEC滤波器对这条最强路径的估计既没有放大,也没有过度衰减,幅度匹配得非常准。
- 这会带来两个关键好处:
- 最大化回声抑制量(ERLE):最强的那部分回声被精准抵消,后续反射尾巴也更容易被覆盖。
- 提高系统稳定性:避免局部频段过补偿(>0 dB)导致啸叫风险,也避免压得太低(<<0 dB)导致滤波器收敛太慢或对直达声抑制不足。
所以核心心思路就是:
- 先调 SYS_DELAY → 让时间域第一个强峰出现在合理位置(10~30样本)
- 再调 MIC_GAIN → 让频率域 peak 尽量靠近 0 dB(但不超过)
- 检查 mean 是否 < 0 dB(如不满足,略降 MIC_GAIN)
- 最后实听验证:单讲清晰无回声,双讲不失真、不啸叫
目前当前 peak coefficient value 已经快接近 0,但没有接近。
查看当前 AUDIO_MGR_MIC_GAIN的值:10
python
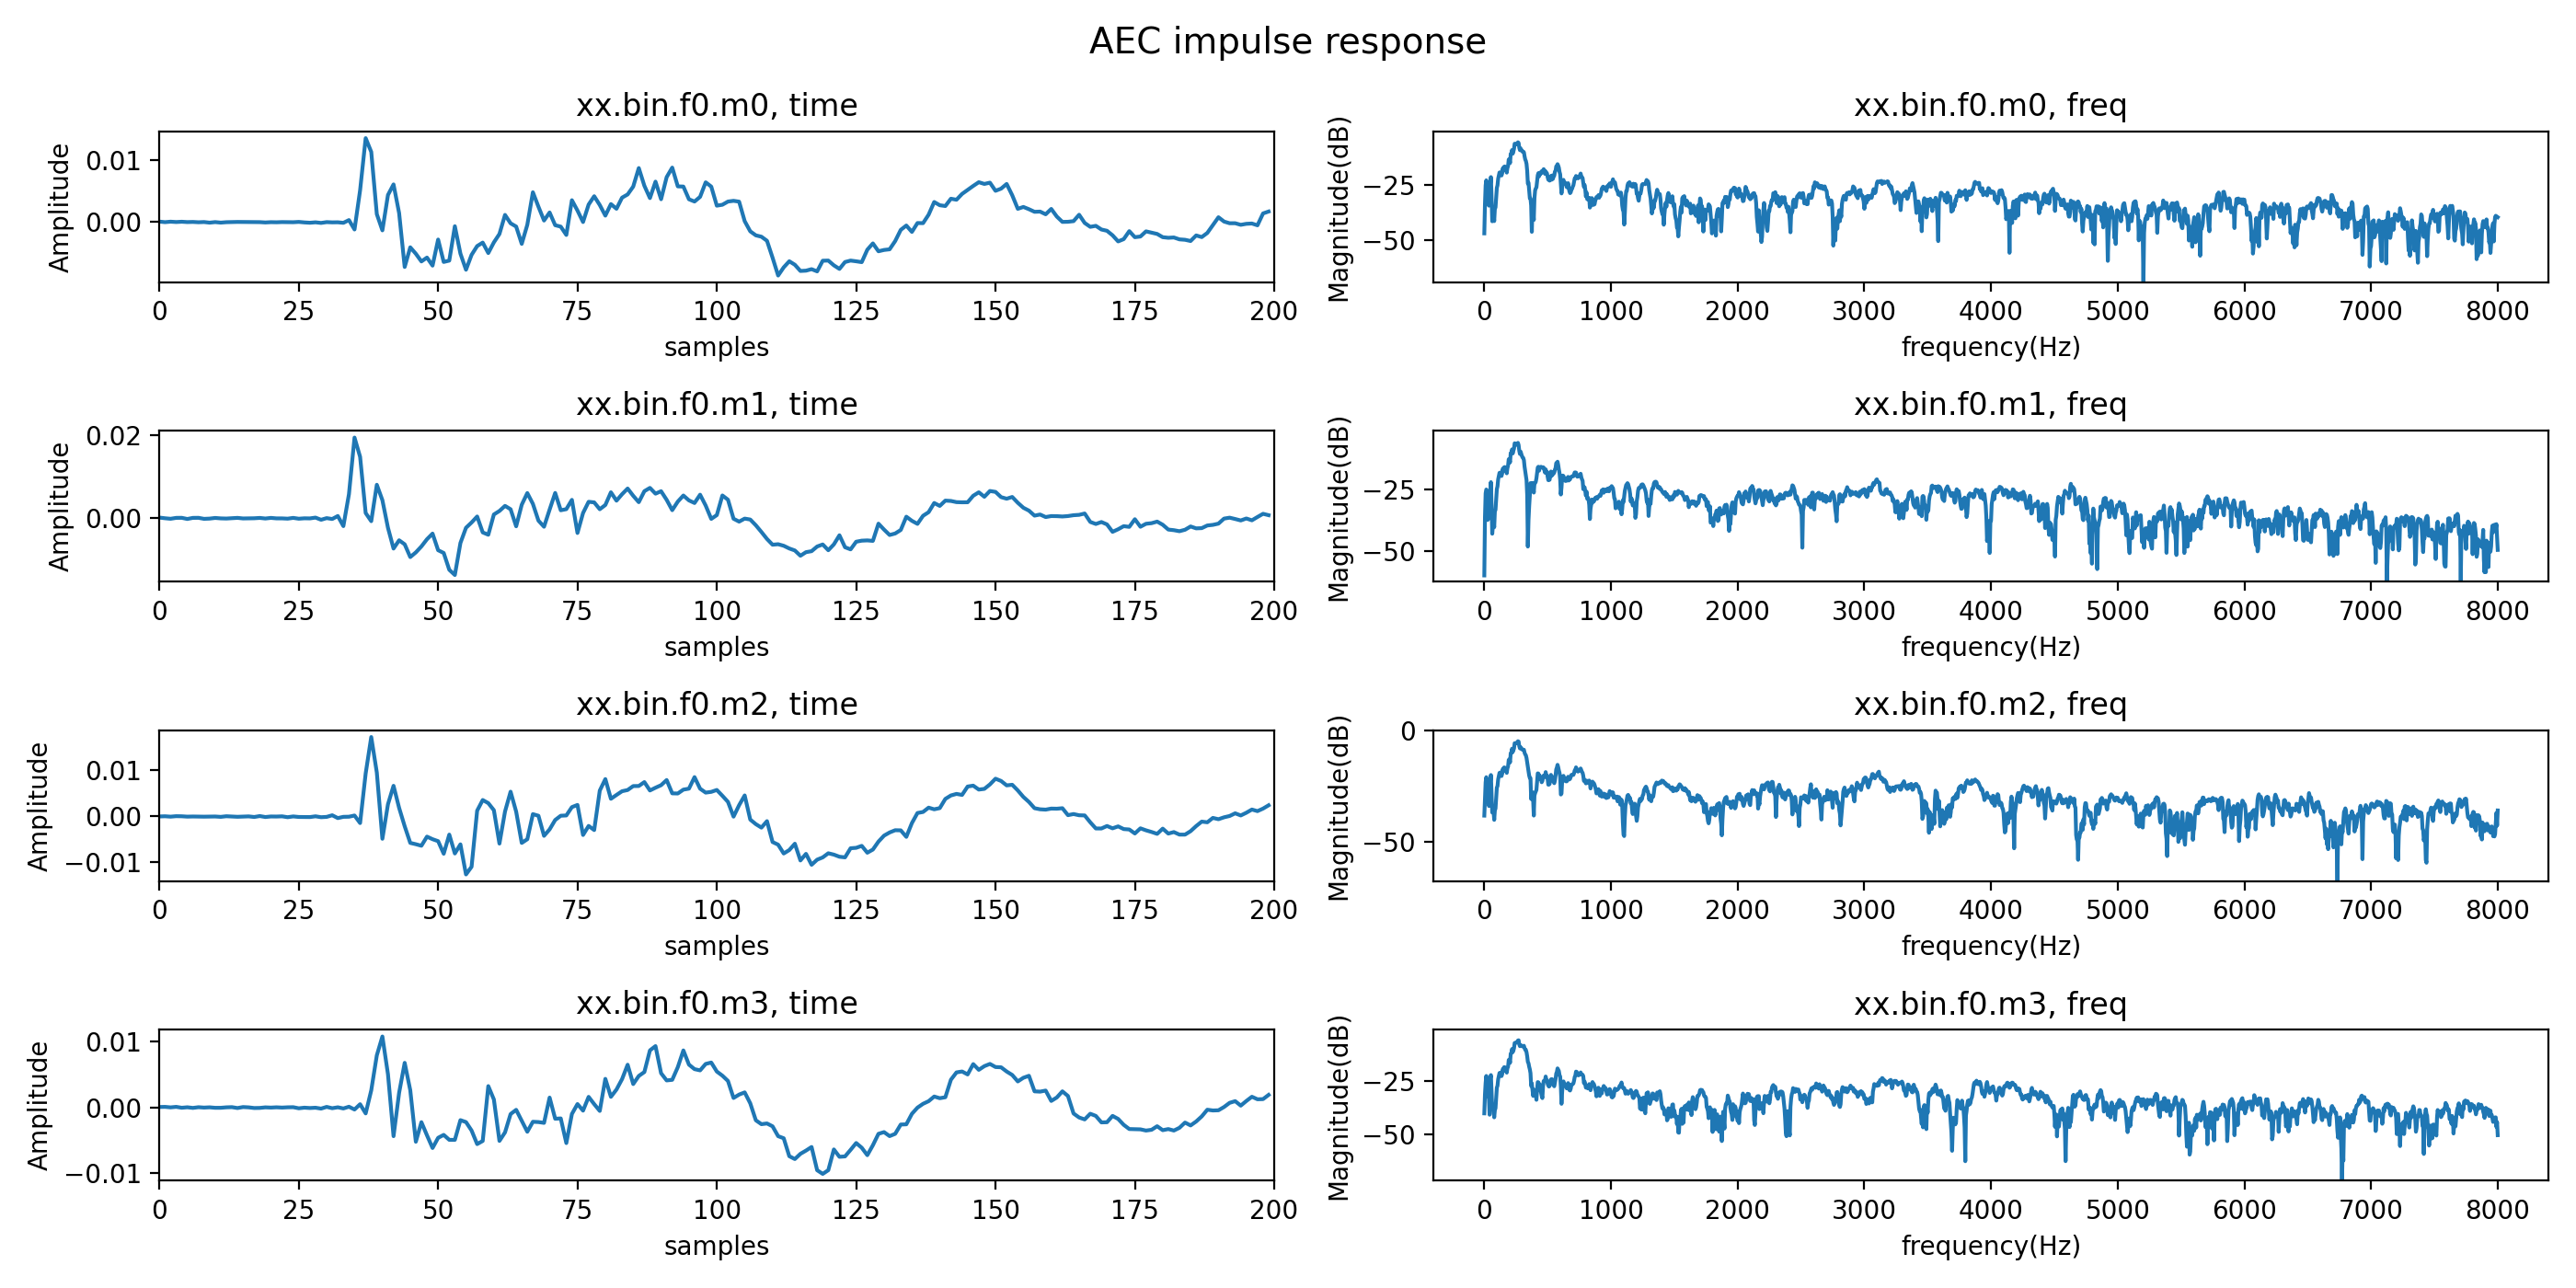
xvf_host --use i2c AUDIO_MGR_MIC_GAIN我们增大到20试试效果
python
xvf_host --use i2c AUDIO_MGR_MIC_GAIN 20测试结果如图所示,mic3明显接近0即增大MIC增益是合适的!
python
python3 /home/raspberry/XVF3800-Software_v3_2_1-3/sources/xvf_tools.py read_aec_filter xx.bin -t 1000查看也在200左右个样本收敛了!