3DGS加速&压缩指标评测方法、高斯数量变化曲线绘制------Training Time、FPS、Gaussian Number、Peak Memory
- 前言
- 一、3DGS加速&压缩指标评测
-
- [1.1 训练时间(Training time)](#1.1 训练时间(Training time))
- [1.2 渲染帧率(FPS)](#1.2 渲染帧率(FPS))
- [1.3 高斯数量(Gaussian Number)](#1.3 高斯数量(Gaussian Number))
- [1.4 GPU峰值显存占用(Peak Memory)](#1.4 GPU峰值显存占用(Peak Memory))
- 二、3DGS加速&压缩指标评测示例
- 三、3DGS训练过程高斯数量变化曲线
-
- [3.1 每轮迭代高斯数量统计](#3.1 每轮迭代高斯数量统计)
- [3.2 高斯数量变化曲线绘制](#3.2 高斯数量变化曲线绘制)
- 写在最后
前言
- 本文旨在为3DGS加速&压缩方向初学者提供一个全面的指标评测方法。这篇文章将以3DGS官方代码为例,说明如何集成各种评测指标。该方法也可应用到各种基于3DGS改进的代码框架中。
- 基于3DGS代码的完整指标评测和可视化代码请参考笔者的Github仓库:gaussian-splatting-metric
- 同时,如果想了解更多关于3DGS的加速压缩新工作,请关注笔者的Github仓库:Awesome-3DGS-Compress-Accelerate
一、3DGS加速&压缩指标评测
这部分涉及到的加速&压缩指标主要包括:
- 训练时间(Training time);
- 渲染帧率(FPS);
- 高斯数量(Gaussian Number);
- GPU峰值显存占用(Peak Memory);
1.1 训练时间(Training time)
训练时间指标最直观的统计方法是使用3DGS代码中tqdm进度条来显示训练时间,但该方法统计的时间不够精确。因此这里提供一种更精确的3DGS训练时间指标评测方法,直观统计训练秒数。
这部分代码修改对应 train.py 文件。
1️⃣ 在循环迭代前,初始化统计变量
其中 iter_start 和 iter_end 为3DGS自带变量,但该变量并未统计致密化等操作的时间,因此新增 optim_start 、 optim_end以及 total_time 变量。
python
iter_start = torch.cuda.Event(enable_timing = True)
iter_end = torch.cuda.Event(enable_timing = True)
## new add
optim_start = torch.cuda.Event(enable_timing=True)
optim_end = torch.cuda.Event(enable_timing=True)
total_time = 0.0

......
for iteration in range(first_iter, opt.iterations + 1):
	......
2️⃣ 统计每次迭代时间iter_time
在每次迭代循环开始和梯度反向传播结束时,调用record()方法记录时间,并通过iter_start.elapsed_time(iter_end)获取本轮迭代时间iter_time。
python
for iteration in range(first_iter, opt.iterations + 1):
	......
	iter_start.record()
	gaussians.update_learning_rate(iteration)
	......
	loss.backward()
	iter_end.record()

	iter_time = iter_start.elapsed_time(iter_end)
3️⃣ 统计致密化等操作时间optim_time并累加总时间total_time
在致密化开始前和相应操作结束时,调用record()方法记录时间,并通过optim_start.elapsed_time(optim_end)获取本轮迭代时间optim_time。最后,累加总时间total_time。
python
for iteration in range(first_iter, opt.iterations + 1):
	......
	optim_start.record()
	# Densification
	if iteration < opt.densify_until_iter:
		......
	# record time
	optim_end.record()
	torch.cuda.synchronize()
	optim_time = optim_start.elapsed_time(optim_end)
	total_time += (iter_time + optim_time) / 1e3
4️⃣ 全部迭代结束,打印训练时间
python
def training(......):
	......
	# location:function end
	print(f"Training time: {total_time}")
1.2 渲染帧率(FPS)
这部分评测对应 render.py 文件,用于测试渲染图像时的平均帧率(FPS)。只需要修改def render_set函数即可。
python
def render_set(model_path, name, iteration, views, gaussians, pipeline, background, train_test_exp, separate_sh):
    render_path = os.path.join(model_path, name, "ours_{}".format(iteration), "renders")
    gts_path = os.path.join(model_path, name, "ours_{}".format(iteration), "gt")

    # new add
    total_time = 0.0

    makedirs(render_path, exist_ok=True)
    makedirs(gts_path, exist_ok=True)

    for idx, view in enumerate(tqdm(views, desc="Rendering progress")):
        rendering = render(view, gaussians, pipeline, background, use_trained_exp=train_test_exp, separate_sh=separate_sh)["render"]
        gt = view.original_image[0:3, :, :]

        if args.train_test_exp:
            rendering = rendering[..., rendering.shape[-1] // 2:]
            gt = gt[..., gt.shape[-1] // 2:]

        torchvision.utils.save_image(rendering, os.path.join(render_path, '{0:05d}'.format(idx) + ".png"))
        torchvision.utils.save_image(gt, os.path.join(gts_path, '{0:05d}'.format(idx) + ".png"))

    # new add
    num_frames = len(views)
    avg_time = total_time / num_frames if num_frames > 0 else 0
    fps = 1.0 / avg_time if avg_time > 0 else 0
    print(f"[{name}] Rendered {num_frames} frames in {total_time:.2f} seconds. Average FPS: {fps:.2f}")
1.3 高斯数量(Gaussian Number)
这部分很简单,只需要在训练迭代循环结束后打印高斯数量即可。
python
def training(......):
	......
	# location:function end
	print(f"Gaussian number after train: {gaussians._xyz.shape[0]}")
1.4 GPU峰值显存占用(Peak Memory)
主要借助Pytorch自带统计工具完成。首先,在train.py文件中各种库导入代码下面插入torch.cuda.reset_peak_memory_stats(),避免之前的内存占用造成影响。
python
import torch
...
# new add
torch.cuda.reset_peak_memory_stats() 其次,在train.py文件中主函数if __name__ == "__main__"下面打印训练时的峰值内存统计。这里torch.cuda.max_memory_allocated()代表理论要分配的峰值内存,而torch.cuda.max_memory_reserved()代表实际使用的峰值内存。因此,选torch.cuda.max_memory_reserved()更能反映实际的峰值内存指标。代码如下:
python
if __name__ == "__main__":
	training(
	        lp.extract(args),
	        op.extract(args),
	        pp.extract(args),
	        args.test_iterations,
	        args.save_iterations,
	        args.checkpoint_iterations,
	        args.start_checkpoint,
	        args.debug_from,
	        args.websockets
	    )
	# new add
    print("Peak memory allocated:", torch.cuda.max_memory_allocated() / 1024**2, "MB")
    print("Peak memory reserved:", torch.cuda.max_memory_reserved() / 1024**2, "MB")
    # All done
    print("\nTraining complete.")
二、3DGS加速&压缩指标评测示例
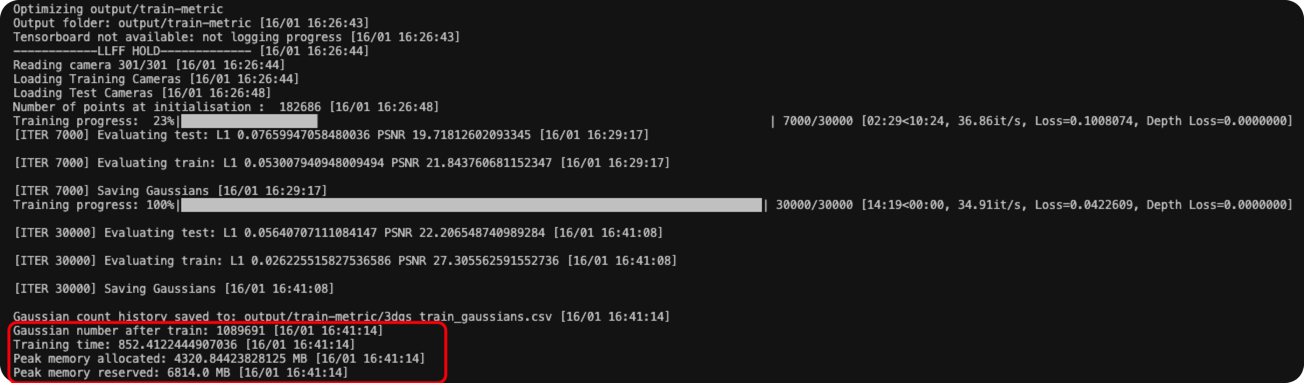
这里就以3DGS训练Train场景为例,展示前述加速&压缩指标评测结果。
python
python train.py -m output/train-metric -s ./dataset/train --eval
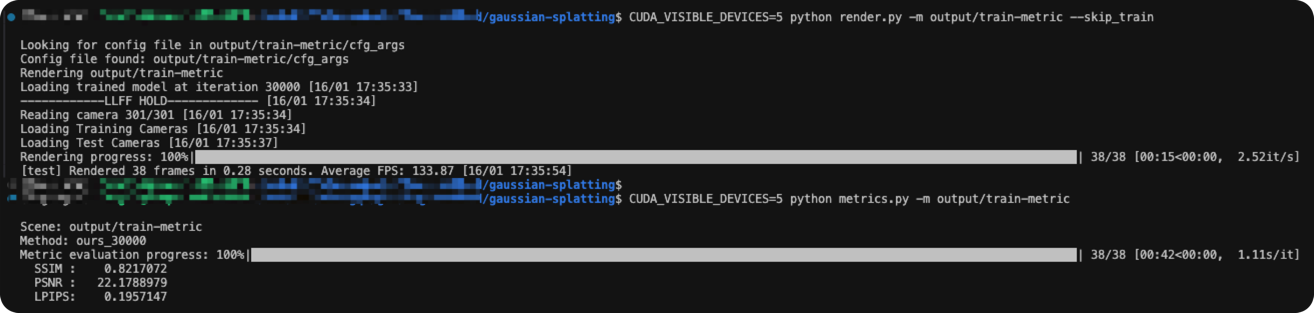
python render.py -m output/train-metric --skip_train
python metrics.py -m output-train_metric运行上述命令,得到如下结果。整理可得各项指标:
| Method | Scene | Training Time | #Gaussians | Peak Memory | FPS | PSNR | SSIM | LPIPS |
|---|---|---|---|---|---|---|---|---|
| 3DGS | Train | 852.4s | 1089691 | 6.814 GB | 133.9 | 22.178 | 0.821 | 0.195 |
三、3DGS训练过程高斯数量变化曲线
3.1 每轮迭代高斯数量统计
1️⃣ 初始化统计变量
python
def training(dataset, opt, pipe, testing_iterations, saving_iterations, checkpoint_iterations, checkpoint, debug_from):
    # csv file setup
    scene_name = os.path.basename(os.path.normpath(dataset.source_path))
    csv_filename = f"3dgs_{scene_name}_gaussians.csv" # {method}_{scene}.csv
    gaussian_count_history = []
2️⃣ 记录每次训练迭代高斯数量
python
for iteration in range(first_iter, opt.iterations + 1):
	......
	# record per-iteration gaussian number
	current_count = gaussians.get_xyz.shape[0]
	gaussian_count_history.append([iteration, current_count])
3️⃣ 保存csv结果
python
# --- save gaussian numbers result to CSV ---
output_path = os.path.join(scene.model_path, csv_filename)
with open(output_path, mode='w', newline='') as f:
    writer = csv.writer(f)
    writer.writerow(["iteration", "gaussian_count"]) # title
    writer.writerows(gaussian_count_history)         # data

print(f"Gaussian count history saved to: {output_path}")
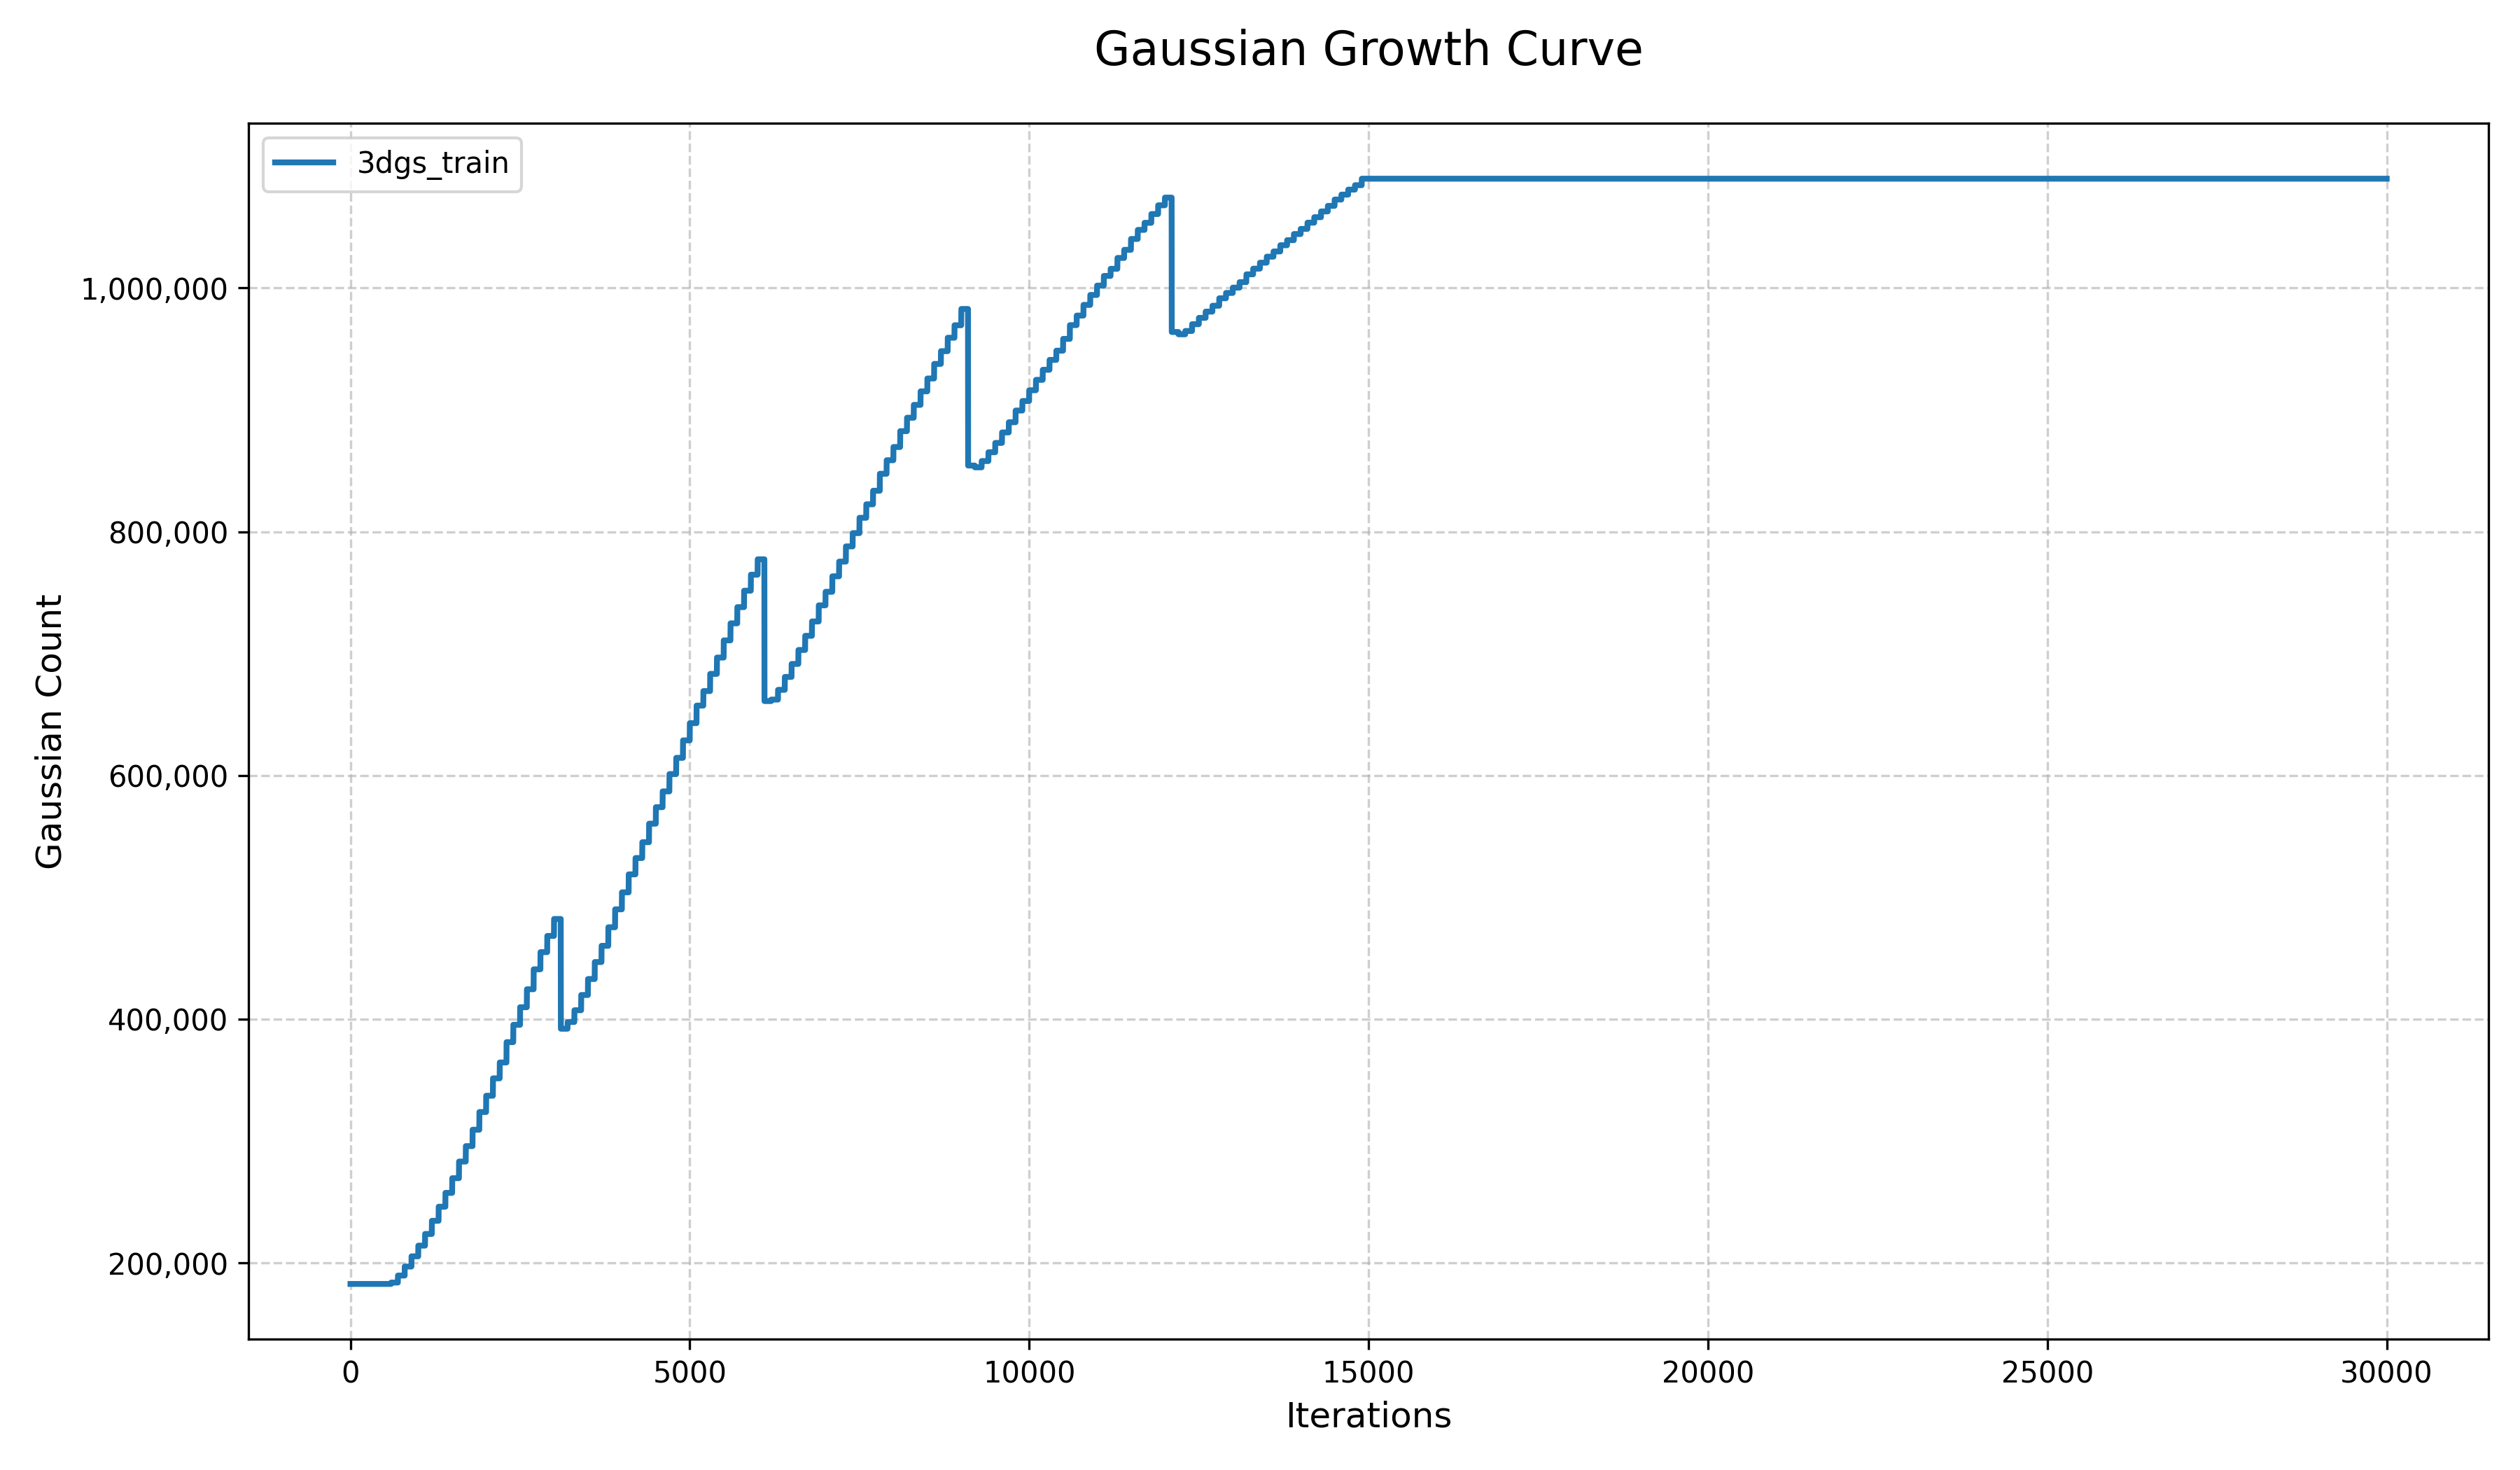
3.2 高斯数量变化曲线绘制
读取csv文件并绘图。相应的绘图函数如下:
python
import pandas as pd
import matplotlib.pyplot as plt
import argparse
import os

def get_label(csv_path):
    filename = os.path.basename(csv_path)
    target_suffix = "_gaussians.csv"

    if filename.endswith(target_suffix):
        label = filename[:-len(target_suffix)]
    else:
        label = "curve1"

    return label
def plot_curve(csv_path):
    # Existence check
    if not os.path.exists(csv_path):
        print(f"Error: File '{csv_path}' not found.")
        return

    # Read data
    print(f"Reading data from {csv_path}...")
    try:
        df = pd.read_csv(csv_path)
    except Exception as e:
        print(f"Error: Could not read CSV. {e}")
        return

    # Validate required columns
    if 'iteration' not in df.columns or 'gaussian_count' not in df.columns:
        print("Error: CSV must contain 'iteration' and 'gaussian_count' columns.")
        return

    plt.style.use('seaborn-v0_8-muted') # or use 'ggplot'
    fig, ax = plt.subplots(figsize=(12, 7))

    # Draw the curve
    scene_name = os.path.basename(csv_path).split('_3dgs')[0]
    curve_label = get_label(csv_path)
    ax.plot(df['iteration'], df['gaussian_count'],
            color='#1f77b4', linewidth=2, label=curve_label)
    ax.set_title(f'Gaussian Growth Curve', fontsize=16, pad=20)
    ax.set_xlabel('Iterations', fontsize=12)
    ax.set_ylabel('Gaussian Count', fontsize=12)

    # Format big numbers on y-axis
    ax.ticklabel_format(style='plain', axis='y')
    ax.get_yaxis().set_major_formatter(
        plt.FuncFormatter(lambda x, loc: "{:,}".format(int(x))))

    ax.grid(True, linestyle='--', alpha=0.6)
    ax.legend(loc='upper left')

    output_png = csv_path.replace('.csv', '_curve.png')

    # Save image
    plt.tight_layout()
    plt.savefig(output_png, dpi=300)
    print(f"Successfully saved plot to: {output_png}")

if __name__ == "__main__":
    parser = argparse.ArgumentParser(description="Plot Gaussian count curve from a 3DGS training CSV.")
    parser.add_argument("--csv_path", type=str, required=True, help="Path to the 3dgs_gaussians.csv file")

    args = parser.parse_args()

    plot_curve(args.csv_path)
读取示例的csv文件并绘图得到以下曲线:
写在最后
- 基于3DGS代码的完整指标评测和可视化代码请参考笔者的Github仓库:gaussian-splatting-metric
- 同时,如果想了解更多关于3DGS的加速压缩新工作,请关注笔者的Github仓库:Awesome-3DGS-Compress-Accelerate
- 转载请注明出处~~