月报告是流量监控应用中帮助用户进行长期流量规划的重要功能。一个月的数据足够反映用户的使用习惯,也能帮助用户判断当前套餐是否合适,是否需要升级或降级。
页面定位与设计思路
月报告和周报告的定位不同。周报告侧重于短期趋势,月报告则更关注长期规划:
- 本月总流量是否接近套餐上限,需不需要控制使用
- 每周的使用量是否均匀,有没有某周特别高
- WiFi和移动数据的比例是否合理,移动数据占比是否过高
- 和套餐对比,利用率如何,是否需要调整套餐
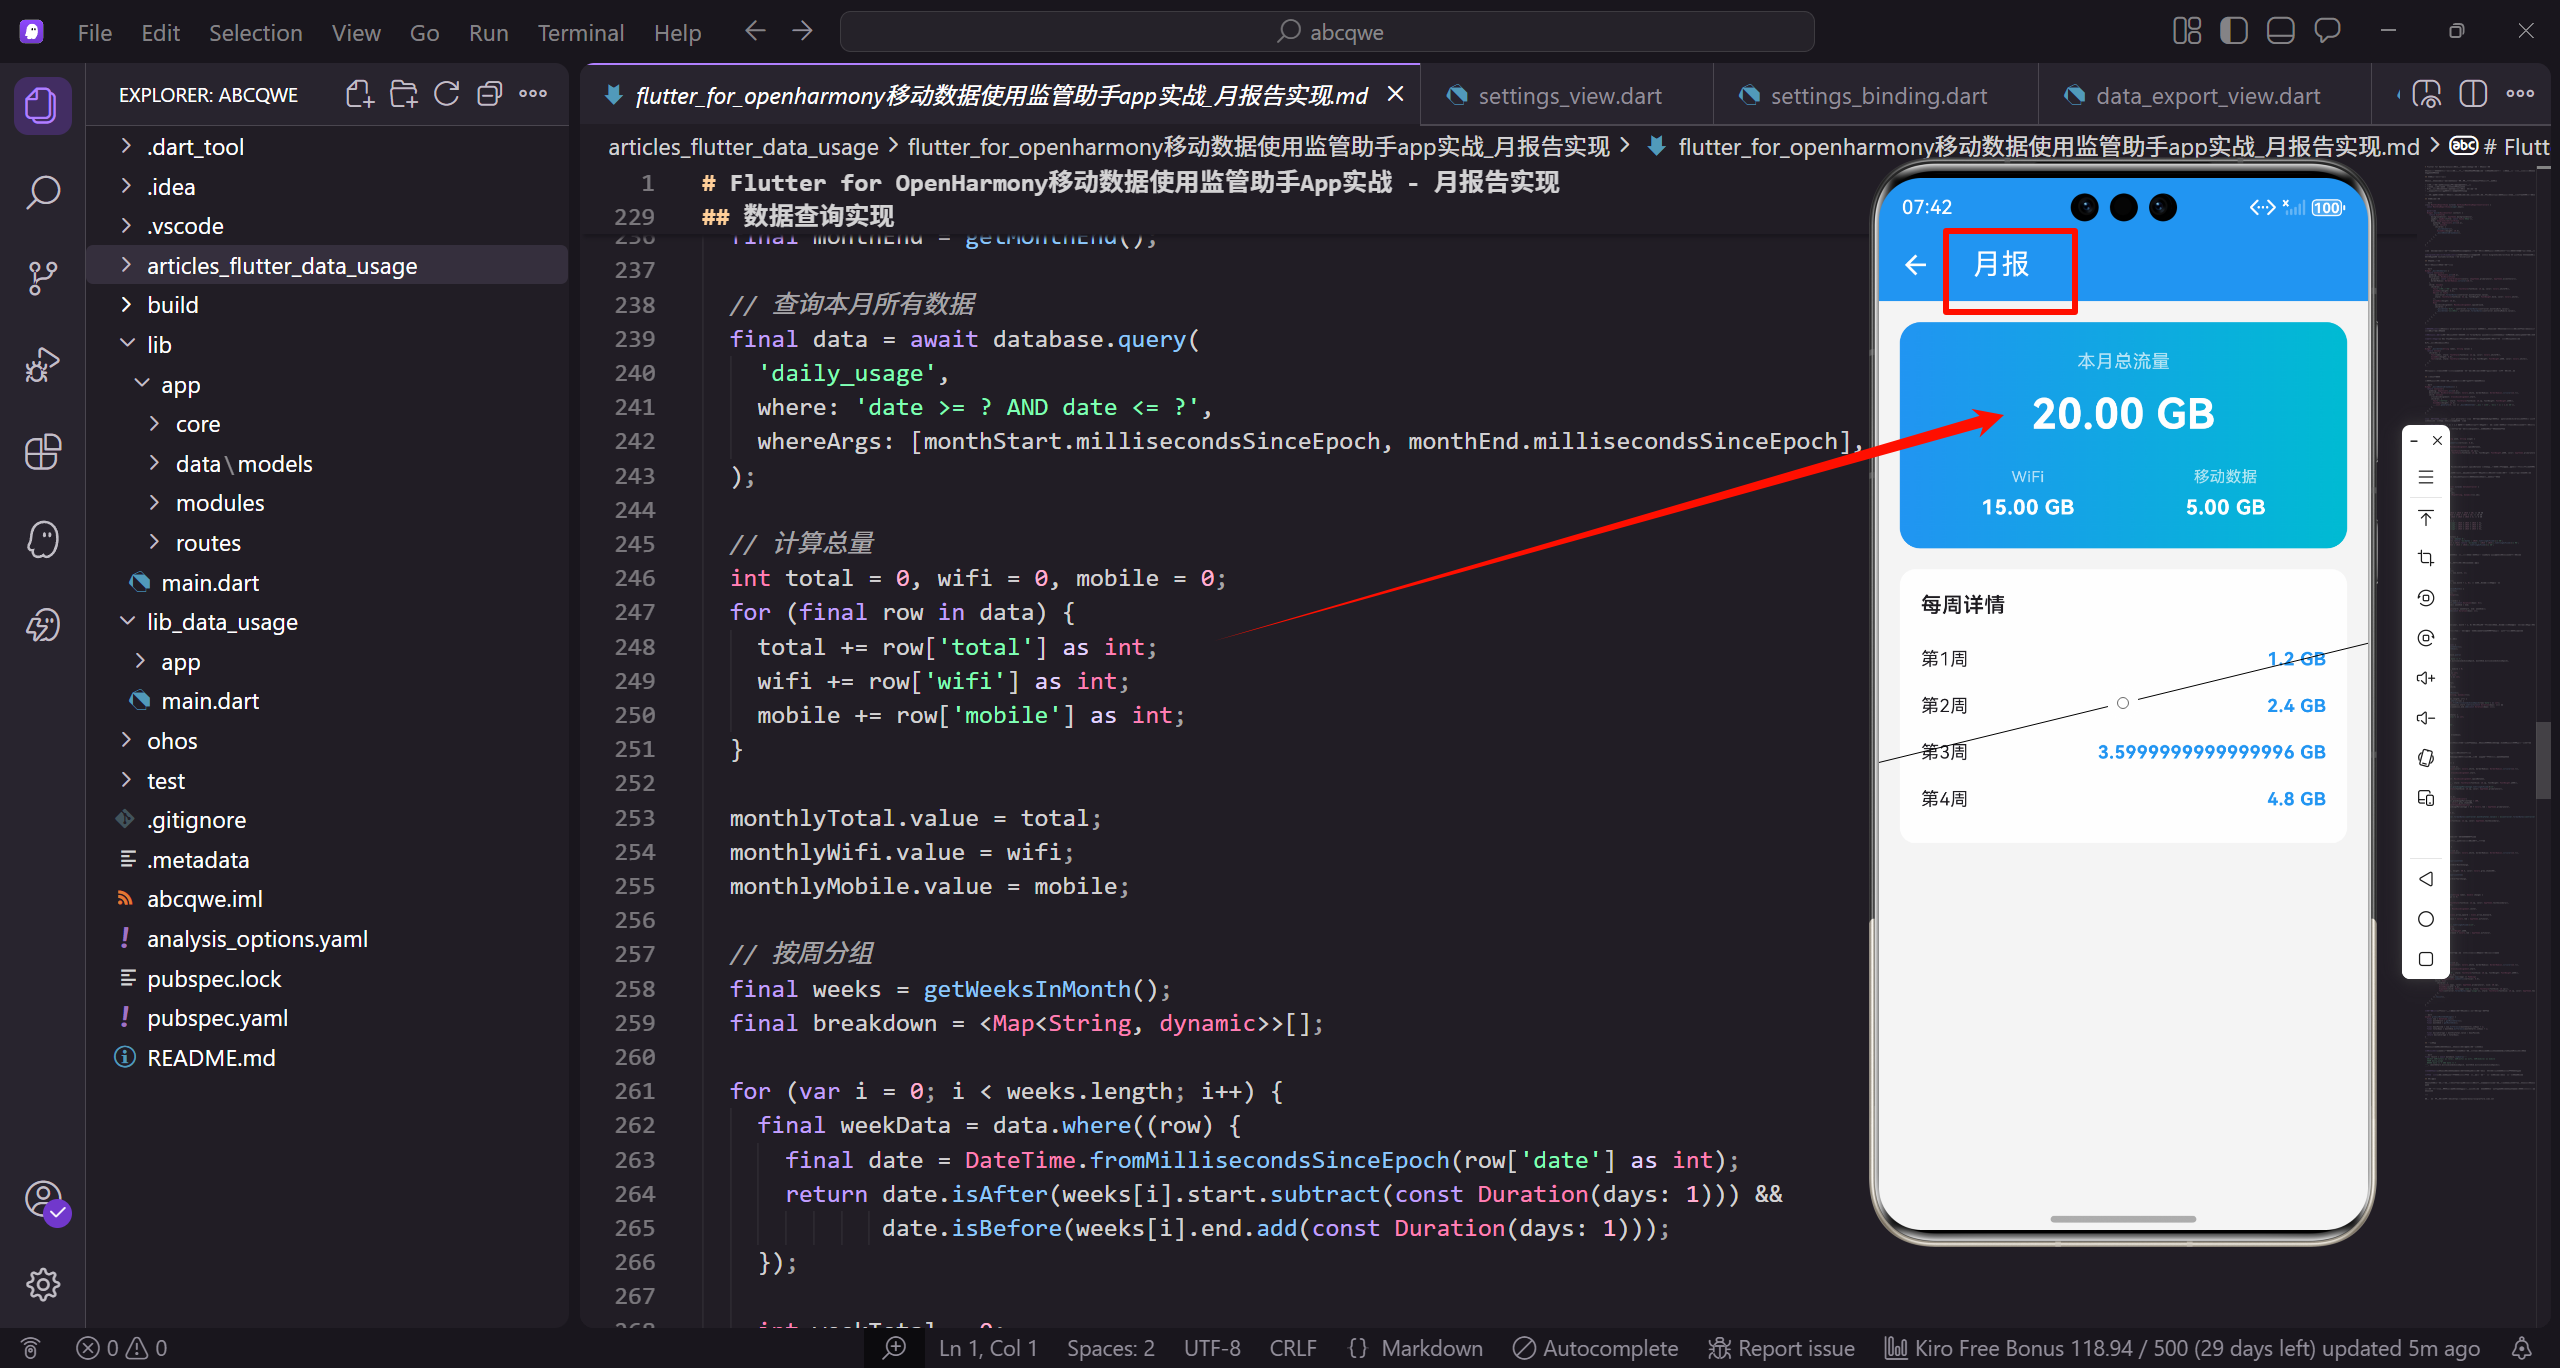
基于这些需求,页面设计成两个主要模块:顶部汇总展示本月总量和分类数据,底部列表展示每周的使用明细。这种设计既有宏观概览,又有细节支撑。
页面结构实现
dart
class MonthlyReportView extends GetView<MonthlyReportController> {
  const MonthlyReportView({super.key});

  @override
  Widget build(BuildContext context) {
    return Scaffold(
      backgroundColor: AppTheme.backgroundColor,
      appBar: AppBar(title: const Text('月报')),
      body: SingleChildScrollView(
        padding: EdgeInsets.all(16.w),
        child: Column(
          children: [
            _buildSummary(),
            SizedBox(height: 16.h),
            _buildWeeklyBreakdown(),
          ],
        ),
      ),
    );
  }
}
结构简洁明了,两个卡片垂直排列。月报告不需要太复杂的图表,用列表展示每周数据更直观,用户可以快速扫描每周的使用情况。
SingleChildScrollView的选择 :页面内容固定,不需要懒加载,用SingleChildScrollView比ListView更合适。如果后续要加更多内容,可以考虑换成CustomScrollView配合SliverList。
月度汇总卡片
顶部卡片展示本月的流量概览:
dart
Widget _buildSummary() {
  return Container(
    padding: EdgeInsets.all(20.w),
    decoration: BoxDecoration(
      gradient: const LinearGradient(colors: [AppTheme.primaryColor, AppTheme.accentColor]),
      borderRadius: BorderRadius.circular(16.r),
    ),
    child: Column(
      children: [
        Text('本月总流量', style: TextStyle(fontSize: 14.sp, color: Colors.white70)),
        SizedBox(height: 8.h),
        Obx(() => Text(
          controller.formatBytes(controller.monthlyTotal.value),
          style: TextStyle(fontSize: 32.sp, fontWeight: FontWeight.bold, color: Colors.white),
        )),
        SizedBox(height: 16.h),
        Row(
          mainAxisAlignment: MainAxisAlignment.spaceAround,
          children: [
            _buildItem('WiFi', controller.formatBytes(controller.monthlyWifi.value)),
            _buildItem('移动数据', controller.formatBytes(controller.monthlyMobile.value)),
          ],
        ),
      ],
    ),
  );
}
渐变色选择 :月报告用primaryColor到accentColor的渐变,和周报告的配色略有不同,让用户能区分不同的报告类型。颜色的微妙差异能帮助用户建立视觉记忆。
数据展示逻辑 :月流量通常比周流量大很多,formatBytes方法会自动选择合适的单位(MB或GB)。32sp的大字号让核心数据一目了然。
响应式更新 :Obx包裹数据展示部分,当数据变化时自动更新UI。这在数据异步加载完成后特别有用。
WiFi和移动数据的展示项:
dart
Widget _buildItem(String label, String value) {
  return Column(
    children: [
      Text(label, style: TextStyle(fontSize: 12.sp, color: Colors.white70)),
      SizedBox(height: 4.h),
      Text(value, style: TextStyle(fontSize: 16.sp, fontWeight: FontWeight.w600, color: Colors.white)),
    ],
  );
}
这个方法在多个报告页面复用,保持了UI的一致性。用户在不同页面看到相同的布局,学习成本更低。
每周明细列表
用列表展示本月每周的流量使用情况,让用户看到更细粒度的数据:
dart
Widget _buildWeeklyBreakdown() {
  return Container(
    padding: EdgeInsets.all(16.w),
    decoration: BoxDecoration(color: Colors.white, borderRadius: BorderRadius.circular(12.r)),
    child: Column(
      crossAxisAlignment: CrossAxisAlignment.start,
      children: [
        Text('每周详情', style: TextStyle(fontSize: 16.sp, fontWeight: FontWeight.w600)),
        SizedBox(height: 12.h),
        ...List.generate(4, (i) => _buildWeekItem('第${i + 1}周', '${(i + 1) * 1.2} GB')),
      ],
    ),
  );
}
展开运算符的使用 :...List.generate()用展开运算符把生成的Widget列表展开到Column的children里。这比用ListView更简洁,因为数据量固定(一个月最多5周),不需要懒加载。
模拟数据生成 :(i + 1) * 1.2生成递增的数据,模拟流量逐周增加的场景。实际项目中应该从数据库查询真实数据,按周分组统计。
标题设计:卡片顶部有"每周详情"的标题,用16sp粗体,和下面的数据形成层次区分。
每周数据项的实现:
dart
Widget _buildWeekItem(String week, String usage) {
  return Padding(
    padding: EdgeInsets.symmetric(vertical: 8.h),
    child: Row(
      mainAxisAlignment: MainAxisAlignment.spaceBetween,
      children: [
        Text(week, style: TextStyle(fontSize: 14.sp)),
        Text(usage, style: TextStyle(fontSize: 14.sp, fontWeight: FontWeight.w600, color: AppTheme.primaryColor)),
      ],
    ),
  );
}
布局选择 :用Row配合MainAxisAlignment.spaceBetween让周名称和流量数值分别靠左和靠右,中间自动留白。这种布局在列表项中很常见,信息对齐清晰。
颜色强调:流量数值用主题色显示,和左边的普通文字形成对比,让数据更醒目。用户扫一眼就能看到每周的数值。
垂直间距:每个列表项有8.h的上下内边距,让列表不会太拥挤,也不会太松散。
Controller实现
dart
class MonthlyReportController extends GetxController {
  final monthlyTotal = 0.obs;
  final monthlyWifi = 0.obs;
  final monthlyMobile = 0.obs;
  final weeklyBreakdown = <Map<String, dynamic>>[].obs;

  @override
  void onInit() {
    super.onInit();
    loadData();
  }

  void loadData() {
    monthlyTotal.value = 1024 * 1024 * 1024 * 20; // 20 GB
    monthlyWifi.value = 1024 * 1024 * 1024 * 15; // 15 GB
    monthlyMobile.value = 1024 * 1024 * 1024 * 5; // 5 GB

    weeklyBreakdown.value = [
      {'week': '第1周', 'usage': 1024 * 1024 * 1024 * 4},
      {'week': '第2周', 'usage': 1024 * 1024 * 1024 * 5},
      {'week': '第3周', 'usage': 1024 * 1024 * 1024 * 6},
      {'week': '第4周', 'usage': 1024 * 1024 * 1024 * 5},
    ];
  }

  String formatBytes(int bytes) {
    if (bytes < 1024) return '$bytes B';
    if (bytes < 1024 * 1024) return '${(bytes / 1024).toStringAsFixed(1)} KB';
    if (bytes < 1024 * 1024 * 1024) return '${(bytes / (1024 * 1024)).toStringAsFixed(2)} MB';
    return '${(bytes / (1024 * 1024 * 1024)).toStringAsFixed(2)} GB';
  }
}Controller比较简单,主要负责数据加载和格式化。实际项目中loadData方法需要从数据库查询真实数据。
日期计算逻辑
获取本月数据需要正确计算日期范围,这是数据查询的基础:
dart
DateTime getMonthStart() {
  final now = DateTime.now();
  return DateTime(now.year, now.month, 1);
}

DateTime getMonthEnd() {
  final now = DateTime.now();
  return DateTime(now.year, now.month + 1, 0); // 下月第0天就是本月最后一天
}

List<DateTimeRange> getWeeksInMonth() {
  final start = getMonthStart();
  final end = getMonthEnd();
  final weeks = <DateTimeRange>[];

  var weekStart = start;
  while (weekStart.isBefore(end)) {
    var weekEnd = weekStart.add(const Duration(days: 6));
    if (weekEnd.isAfter(end)) weekEnd = end;

    weeks.add(DateTimeRange(start: weekStart, end: weekEnd));
    weekStart = weekEnd.add(const Duration(days: 1));
  }

  return weeks;
}
月末计算技巧 :DateTime(year, month + 1, 0)这个写法很巧妙,下个月的第0天就是本月的最后一天,不用考虑每月天数不同的问题(28、29、30、31天)。
周分组逻辑:从月初开始,每7天为一周,最后一周可能不满7天。这种分组方式简单直观,用户容易理解。
数据查询实现
实际项目中,按周查询数据的逻辑:
dart
Future<void> loadData() async {
  final monthStart = getMonthStart();
  final monthEnd = getMonthEnd();

  // 查询本月所有数据
  final data = await database.query(
    'daily_usage',
    where: 'date >= ? AND date <= ?',
    whereArgs: [monthStart.millisecondsSinceEpoch, monthEnd.millisecondsSinceEpoch],
  );

  // 计算总量
  int total = 0, wifi = 0, mobile = 0;
  for (final row in data) {
    total += row['total'] as int;
    wifi += row['wifi'] as int;
    mobile += row['mobile'] as int;
  }

  monthlyTotal.value = total;
  monthlyWifi.value = wifi;
  monthlyMobile.value = mobile;

  // 按周分组
  final weeks = getWeeksInMonth();
  final breakdown = <Map<String, dynamic>>[];

  for (var i = 0; i < weeks.length; i++) {
    final weekData = data.where((row) {
      final date = DateTime.fromMillisecondsSinceEpoch(row['date'] as int);
      return date.isAfter(weeks[i].start.subtract(const Duration(days: 1))) &&
             date.isBefore(weeks[i].end.add(const Duration(days: 1)));
    });

    int weekTotal = 0;
    for (final row in weekData) {
      weekTotal += row['total'] as int;
    }

    breakdown.add({
      'week': '第${i + 1}周',
      'usage': weekTotal,
    });
  }

  weeklyBreakdown.value = breakdown;
}
这段代码先查询本月所有数据,然后在内存中按周分组。对于月报告这种数据量(最多31条记录),这种方式性能足够。
功能扩展思路
月报告可以增加更多维度的分析,让数据更有价值:
套餐对比:如果用户设置了套餐,可以显示本月使用量占套餐的百分比,用进度条可视化。
dart
Widget _buildPlanProgress() {
  return Container(
    padding: EdgeInsets.all(16.w),
    decoration: BoxDecoration(color: Colors.white, borderRadius: BorderRadius.circular(12.r)),
    child: Column(
      crossAxisAlignment: CrossAxisAlignment.start,
      children: [
        Row(
          mainAxisAlignment: MainAxisAlignment.spaceBetween,
          children: [
            Text('套餐使用', style: TextStyle(fontSize: 16.sp, fontWeight: FontWeight.w600)),
            Obx(() => Text(
              '${controller.planUsagePercentage.toStringAsFixed(0)}%',
              style: TextStyle(fontSize: 14.sp, color: AppTheme.primaryColor),
            )),
          ],
        ),
        SizedBox(height: 12.h),
        Obx(() => LinearProgressIndicator(
          value: controller.planUsagePercentage / 100,
          backgroundColor: Colors.grey.shade200,
          valueColor: AlwaysStoppedAnimation(
            controller.planUsagePercentage > 80 ? Colors.red : AppTheme.primaryColor,
          ),
        )),
        SizedBox(height: 8.h),
        Obx(() => Text(
          '已用 ${controller.formatBytes(controller.monthlyTotal.value)} / ${controller.formatBytes(controller.planTotal.value)}',
          style: TextStyle(fontSize: 12.sp, color: AppTheme.textSecondary),
        )),
      ],
    ),
  );
}
进度条颜色会根据使用比例变化,超过80%变成红色警告。
同比环比:和上个月、去年同期对比,帮助用户发现长期趋势。
dart
Widget _buildComparison() {
  return Container(
    padding: EdgeInsets.all(16.w),
    decoration: BoxDecoration(color: Colors.white, borderRadius: BorderRadius.circular(12.r)),
    child: Row(
      children: [
        Expanded(
          child: _buildComparisonItem(
            '环比上月',
            controller.monthOverMonthChange,
          ),
        ),
        Container(width: 1, height: 50.h, color: Colors.grey.shade200),
        Expanded(
          child: _buildComparisonItem(
            '同比去年',
            controller.yearOverYearChange,
          ),
        ),
      ],
    ),
  );
}

Widget _buildComparisonItem(String label, double change) {
  final isIncrease = change >= 0;
  return Column(
    children: [
      Text(label, style: TextStyle(fontSize: 12.sp, color: AppTheme.textSecondary)),
      SizedBox(height: 4.h),
      Row(
        mainAxisAlignment: MainAxisAlignment.center,
        children: [
          Icon(
            isIncrease ? Icons.arrow_upward : Icons.arrow_downward,
            size: 16.sp,
            color: isIncrease ? Colors.red : AppTheme.wifiColor,
          ),
          Text(
            '${change.abs().toStringAsFixed(1)}%',
            style: TextStyle(
              fontSize: 16.sp,
              fontWeight: FontWeight.w600,
              color: isIncrease ? Colors.red : AppTheme.wifiColor,
            ),
          ),
        ],
      ),
    ],
  );
}应用排行:展示本月流量消耗最多的几个应用,帮助用户了解流量都花在哪了。
dart
Widget _buildTopApps() {
  return Container(
    padding: EdgeInsets.all(16.w),
    decoration: BoxDecoration(color: Colors.white, borderRadius: BorderRadius.circular(12.r)),
    child: Column(
      crossAxisAlignment: CrossAxisAlignment.start,
      children: [
        Text('流量消耗Top 5', style: TextStyle(fontSize: 16.sp, fontWeight: FontWeight.w600)),
        SizedBox(height: 12.h),
        ...controller.topApps.map((app) => Padding(
          padding: EdgeInsets.symmetric(vertical: 6.h),
          child: Row(
            children: [
              Icon(Icons.apps, color: AppTheme.primaryColor, size: 20.sp),
              SizedBox(width: 8.w),
              Expanded(child: Text(app['name'], style: TextStyle(fontSize: 14.sp))),
              Text(controller.formatBytes(app['usage']), style: TextStyle(fontSize: 14.sp, color: AppTheme.textSecondary)),
            ],
          ),
        )).toList(),
      ],
    ),
  );
}预测功能:根据当前使用速度,预测月底会用多少流量,提前预警。
dart
double predictMonthEndUsage() {
  final now = DateTime.now();
  final monthStart = getMonthStart();
  final monthEnd = getMonthEnd();

  final daysPassed = now.difference(monthStart).inDays + 1;
  final totalDays = monthEnd.difference(monthStart).inDays + 1;

  final dailyAverage = monthlyTotal.value / daysPassed;
  return dailyAverage * totalDays;
}
性能考虑
月报告涉及的数据量比日报告和周报告都大,需要注意性能优化:
数据聚合:不要在客户端遍历每天的数据再求和,应该在数据库层面做聚合查询。SQLite支持SUM等聚合函数。
dart
final result = await database.rawQuery('''
  SELECT SUM(total) as total, SUM(wifi) as wifi, SUM(mobile) as mobile
  FROM daily_usage
  WHERE date >= ? AND date <= ?
''', [monthStart.millisecondsSinceEpoch, monthEnd.millisecondsSinceEpoch]);缓存策略:月报告数据变化不频繁,可以缓存起来,用户再次打开时直接显示缓存数据,后台静默更新。
分页加载:如果要支持查看历史月份,用分页加载而不是一次性加载所有数据。每次只加载一个月的数据。
写在最后
月报告页面通过汇总卡片和每周明细两个模块,帮助用户从长期角度了解自己的流量使用情况。相比日详情和周报告,月报告更适合做流量规划和套餐评估。
在实现过程中,我们重点关注了数据的组织方式和展示效果。简洁的列表布局、清晰的数据层次、合理的颜色运用,都是为了让用户能够快速获取有价值的信息。
欢迎加入开源鸿蒙跨平台社区:https://openharmonycrossplatform.csdn.net