精彩专栏推荐订阅:在下方主页👇🏻👇🏻👇🏻👇🏻
💖🔥作者主页 :计算机毕设木哥🔥 💖
文章目录
- 一、项目介绍
- 二、选题背景
- 三、开发环境
- 四、系统展示
- 五、代码展示
- 六、项目文档展示
- 七、项目总结
- [<font color=#fe2c24 >大家可以帮忙点赞、收藏、关注、评论啦 👇🏻](#fe2c24 >大家可以帮忙点赞、收藏、关注、评论啦 👇🏻)
一、项目介绍
这套《基于大数据的城市交通数据可视化分析系统》主要是想帮大家解决毕业设计选题难、技术栈不会选的问题,整个系统完全围绕Hadoop生态和Spark计算框架来搭建,用的是PySpark做数据分析,数据来源于一个包含城市、日期、客流量、天气、交通状况指数等10个字段的CSV数据集。系统能做的东西还挺实在的,比如分析不同城市哪条路线最繁忙、下雨天是不是更容易堵车、节假日对交通影响有多大这些具体问题。技术上会涉及到数据清洗转换、聚合统计、K-Means聚类这些操作,最后输出成CSV文件方便做可视化展示。整套流程走下来,既能体现大数据处理的核心能力,又不会搞得太复杂让你答辩时讲不清楚,挺适合想稳妥过毕设又希望有点技术含量的同学。
二、选题背景
选题背景:现在城市里的车越来越多,上下班高峰堵得水泄不通已经是家常便饭,传统的交通管理方式主要靠人工统计或者简单的电子表格记录,面对海量出行数据时根本玩不转,处理速度慢不说还容易出错。这几年大数据技术慢慢普及开来,Hadoop和Spark这些工具在处理大规模数据上确实有两把刷子,能把以前几天才能算完的数据压缩到几分钟搞定。而且现在的毕设要求也越来越高,老师希望看到你能用上主流技术解决实际问题,而不是写个简单的信息管理系统交差。所以就想结合这个背景,做一个能处理真实交通数据、分析拥堵规律、还能把结果直观展示出来的系统,既符合技术趋势又能解决点实际痛点。
选题意义:做这个系统的意义吧,说大不大说小不小,主要是几个方面。对学生自己来说,这是个挺好的练手机会,能真正把Hadoop和Spark这些课堂上听过的技术用起来,走完数据清洗、分析、建模的全流程,比光看书强多了。对实际应用层面而言,这套分析方法能给城市交通管理提供点参考思路,比如通过数据看出哪条路线常年拥堵、什么天气下需要提前调度车辆,虽然只是个毕业设计做不到实时监控那么高级,但至少能展示数据分析在交通领域的价值。另外这种基于聚类的城市分类方法,也能为同类城市的交通规划提供横向对比的视角,算是用技术思维看待城市问题的一种尝试吧,当然啦,系统还有不少粗糙的地方,主要是抛砖引玉。
三、开发环境
- 大数据技术:Hadoop、Spark、Hive
- 开发技术:Python、Django框架、Vue、Echarts
- 软件工具:Pycharm、DataGrip、Anaconda
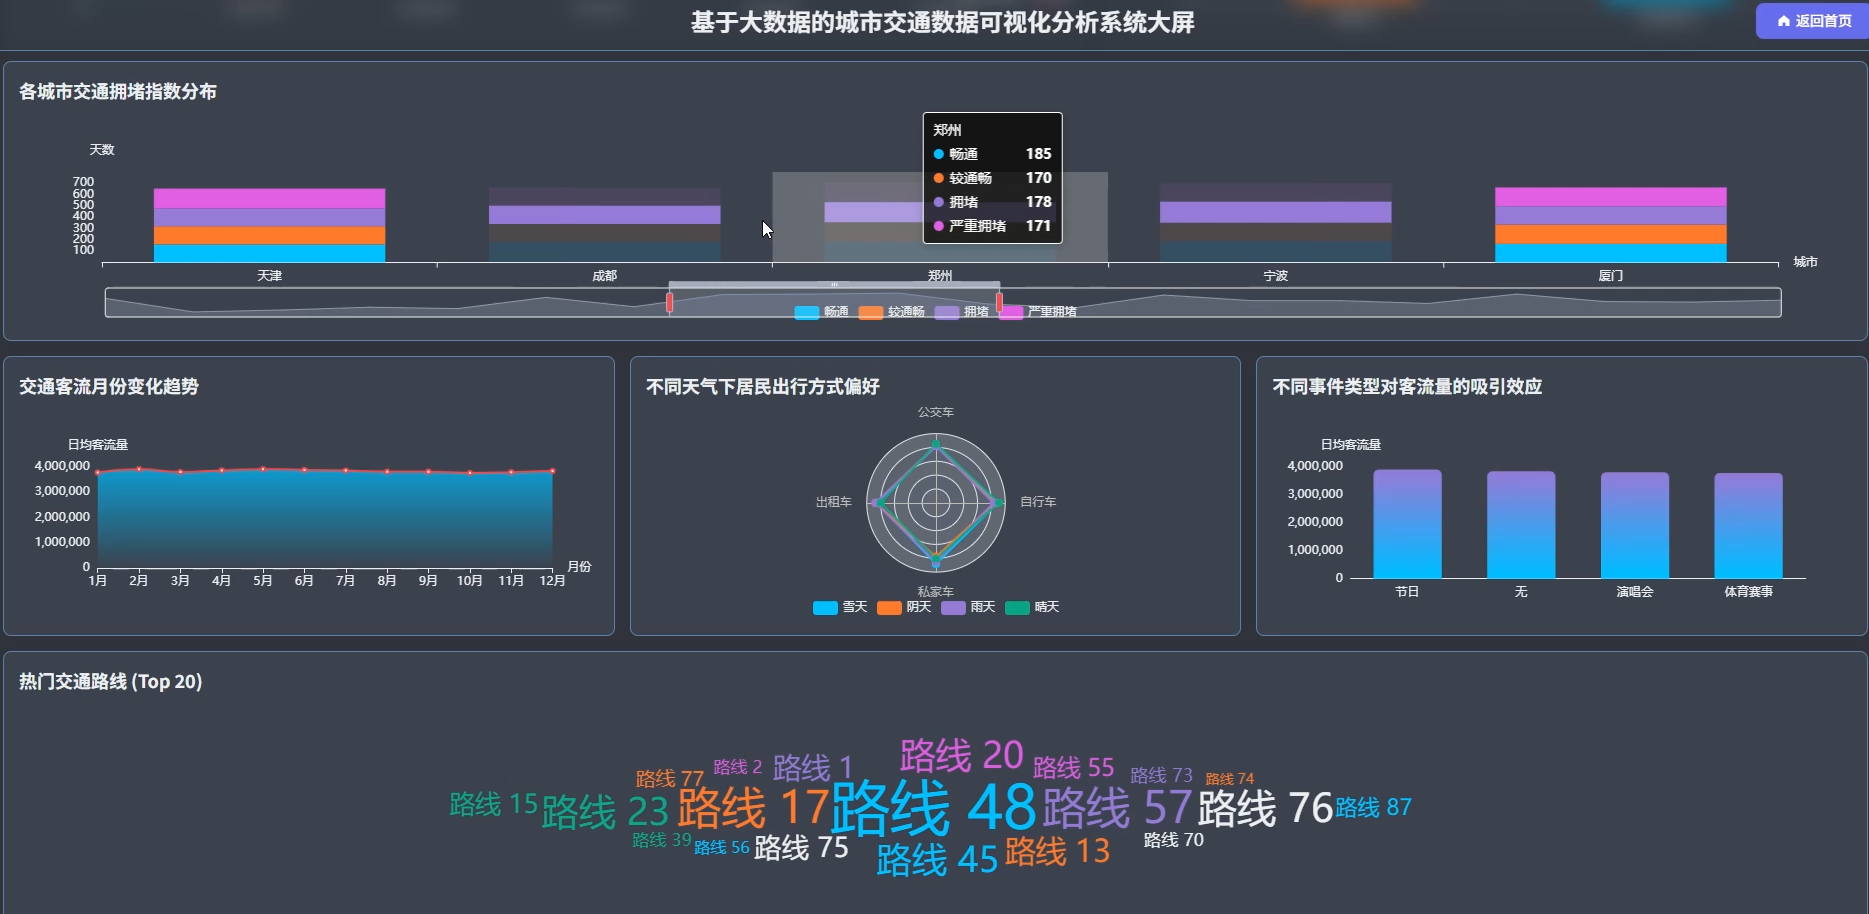
- 可视化 工具 Echarts
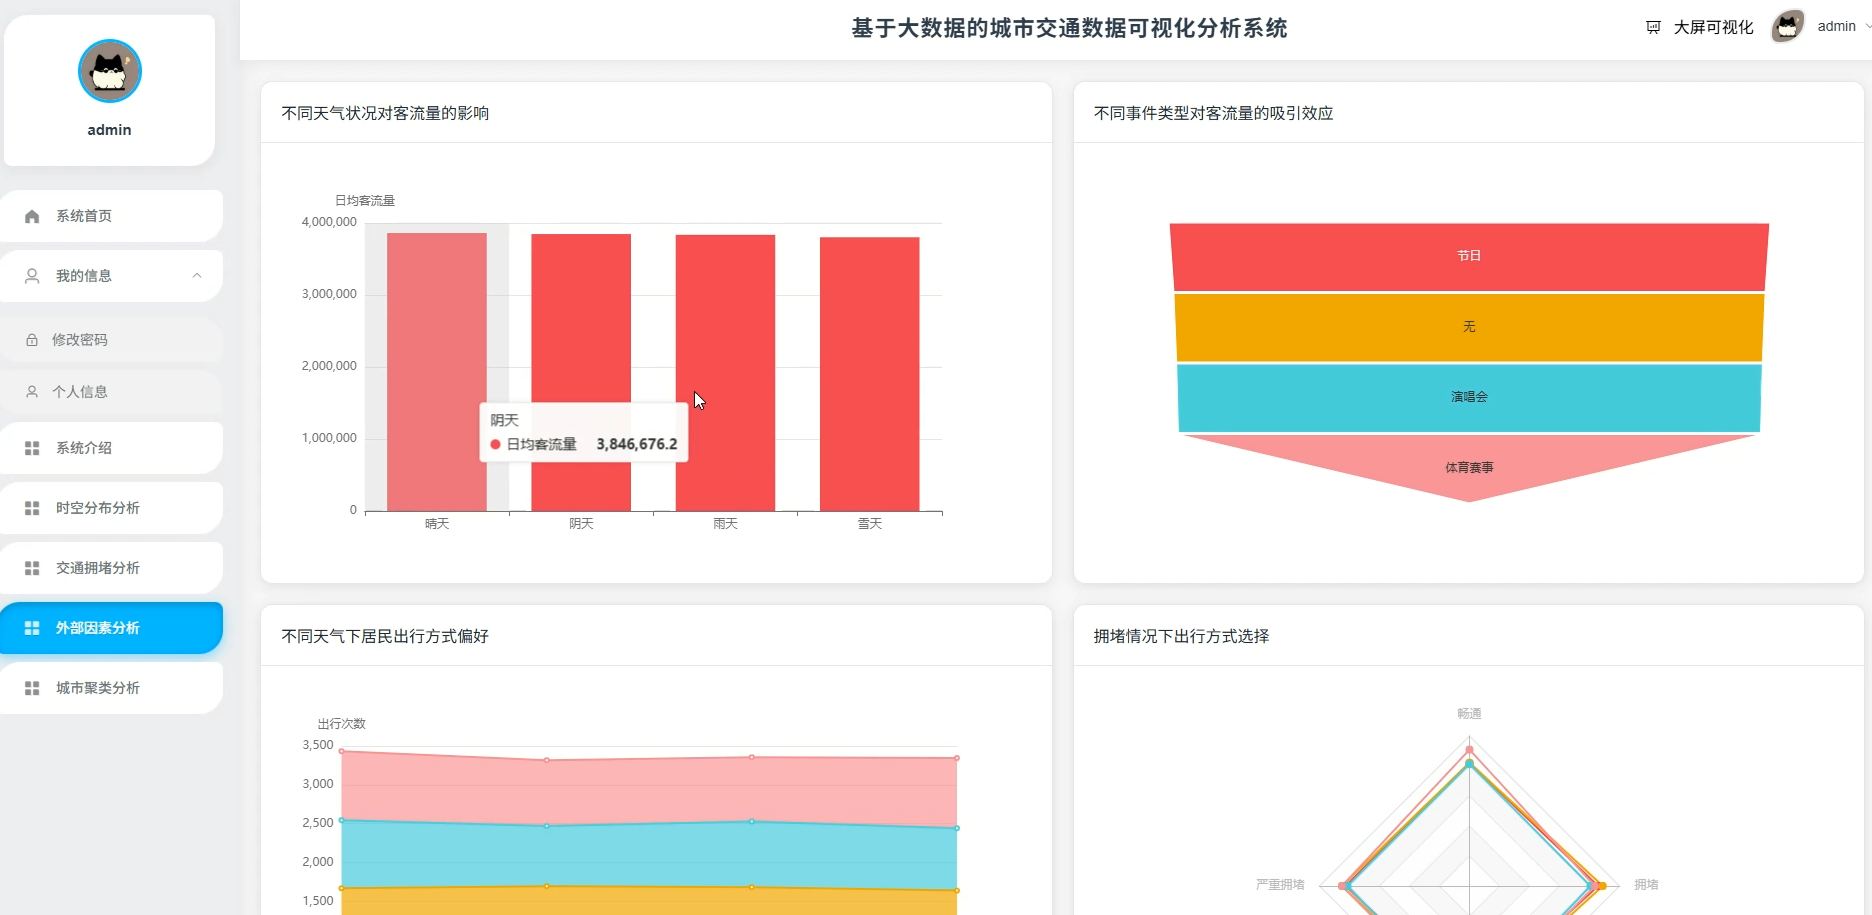
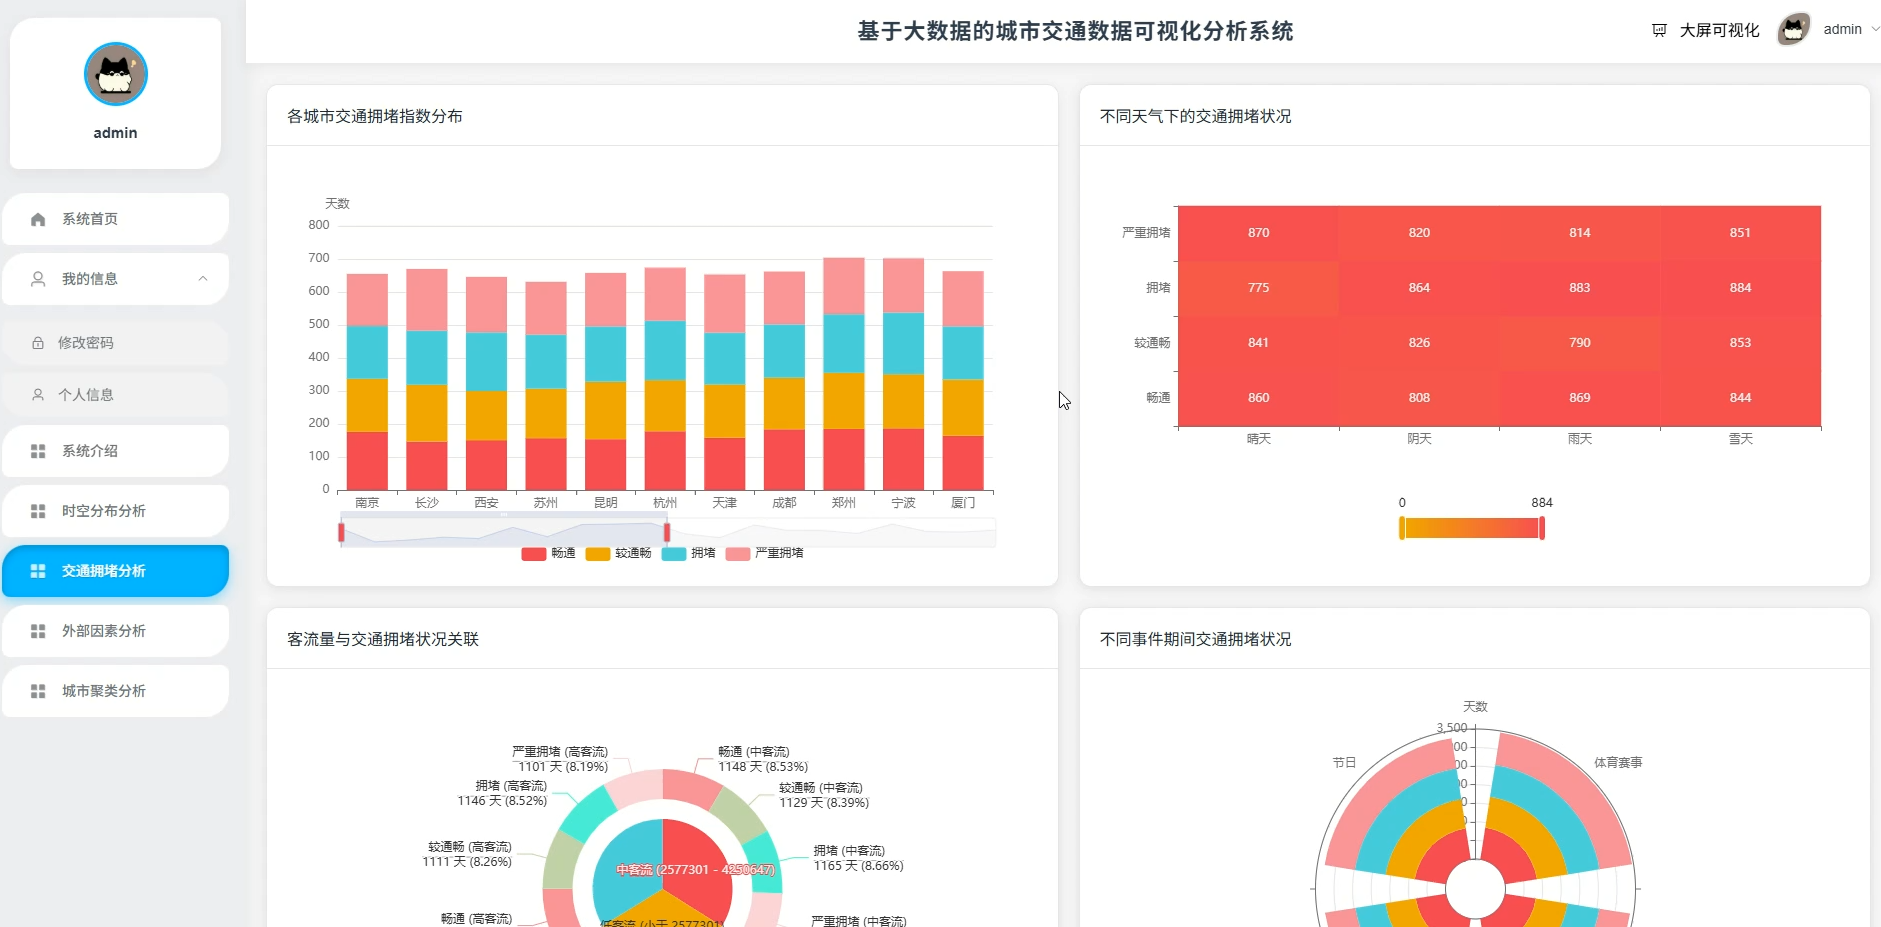
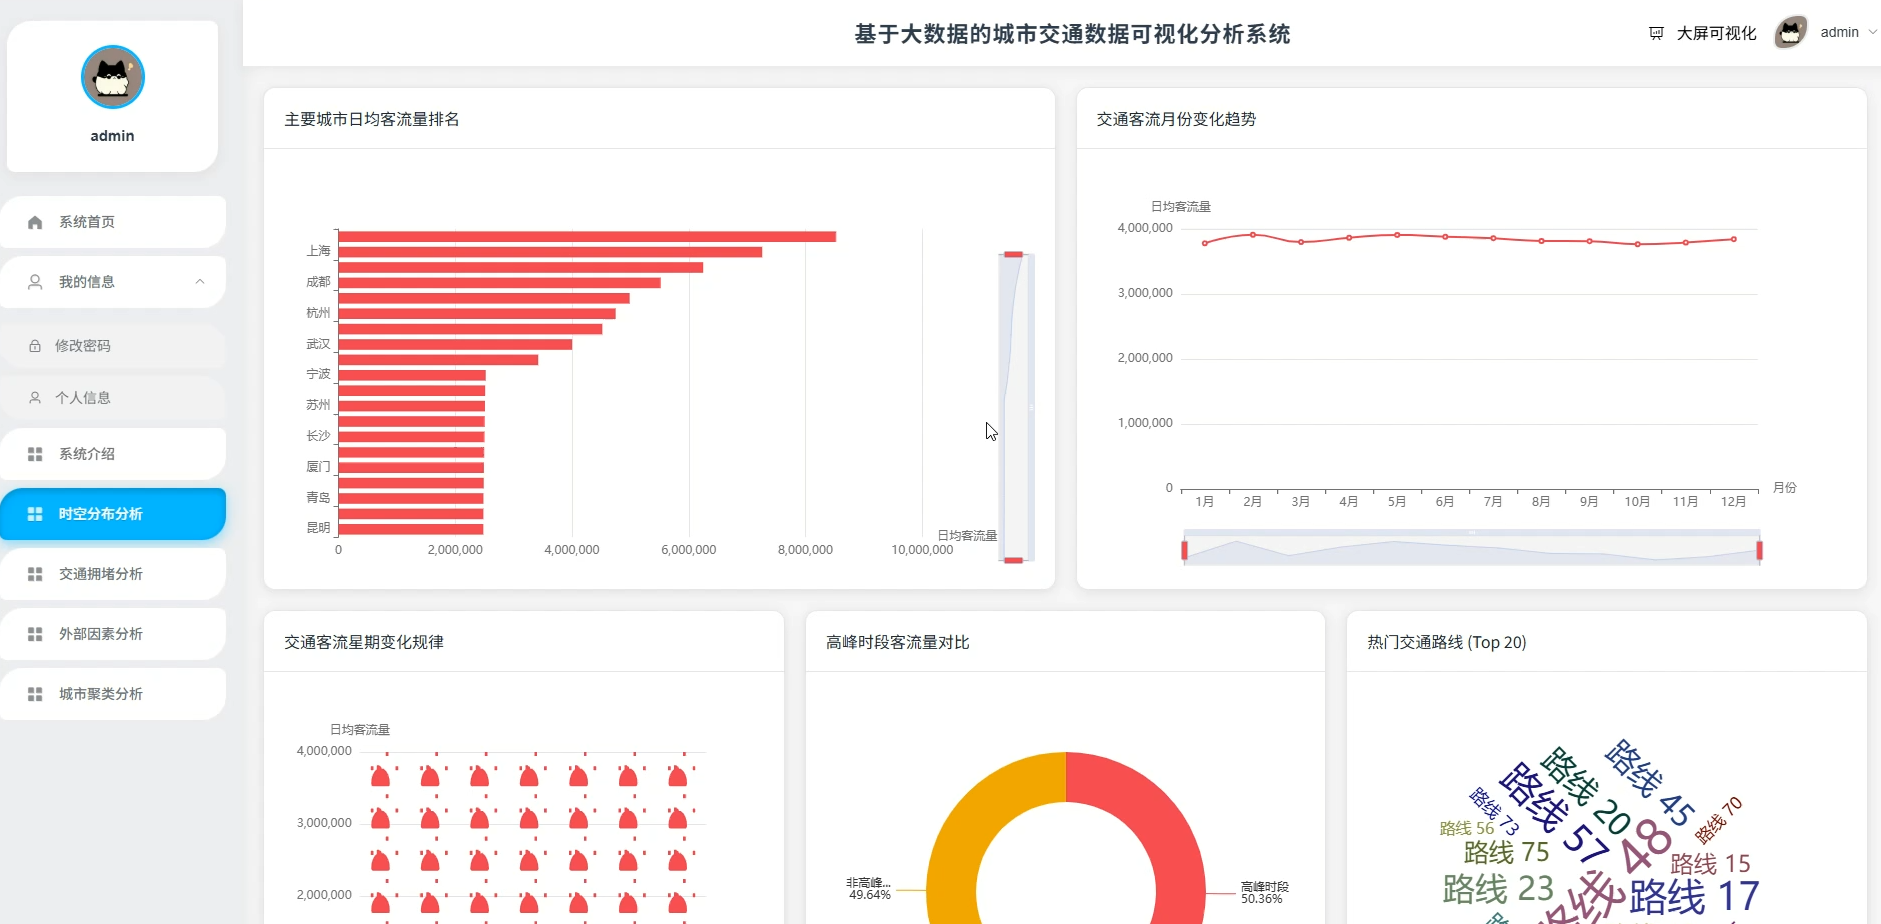
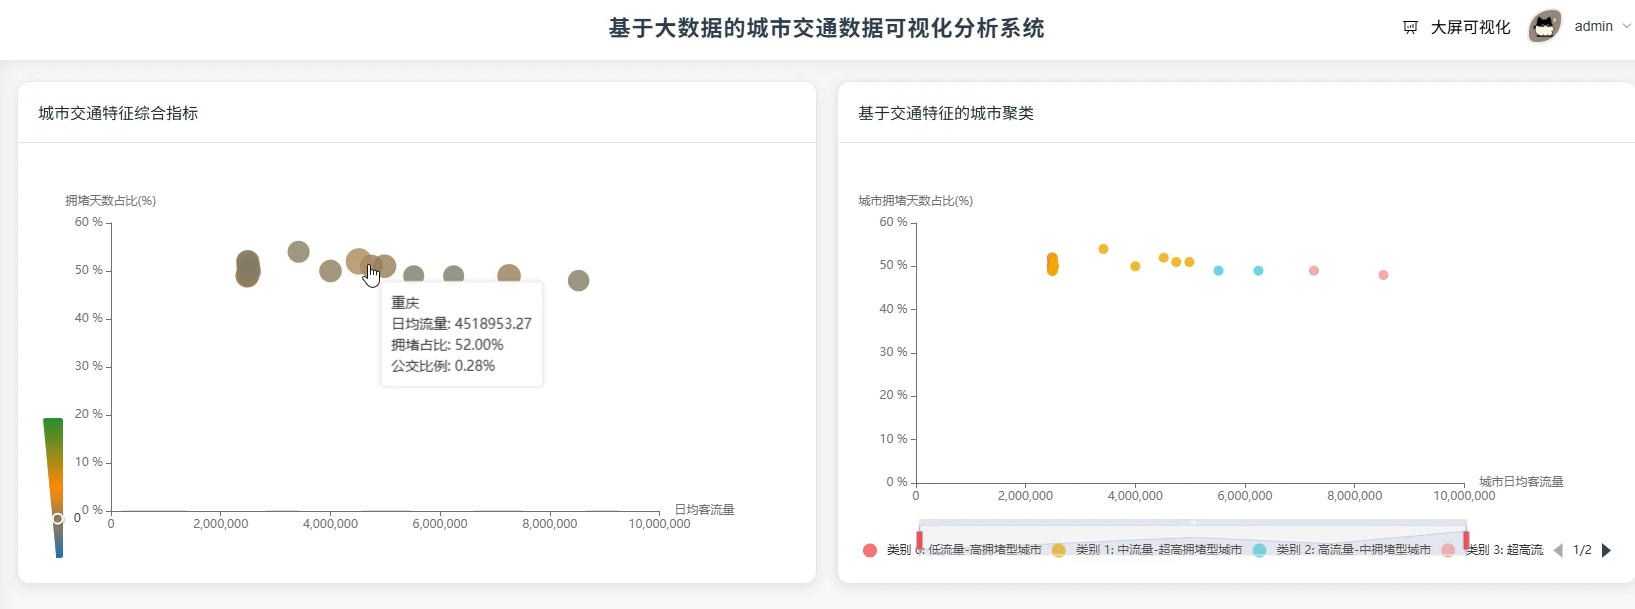
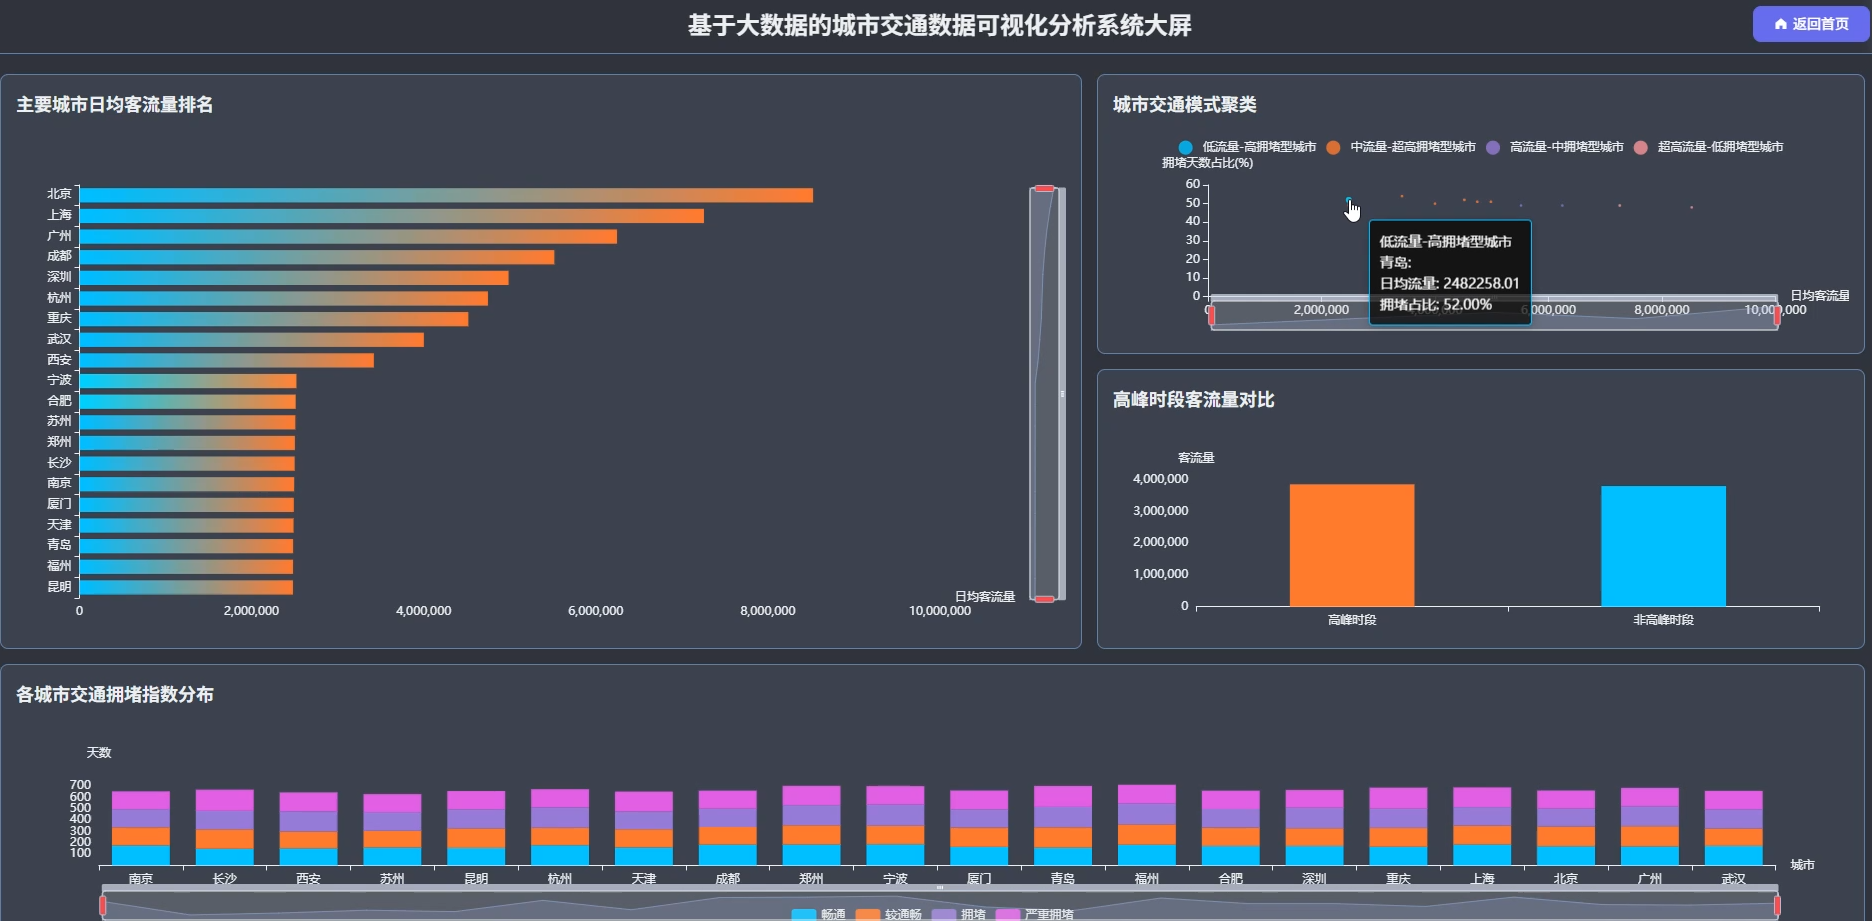
四、系统展示
系统页面模块展示:

五、代码展示
bash
spark = SparkSession.builder.appName("UrbanTrafficBigDataAnalysis").master("local[*]").getOrCreate()
df = spark.read.csv("城市交通数据集.csv", header=True, inferSchema=True)
df = df.withColumnRenamed("城市", "city")
df = df.withColumnRenamed("客流量", "traffic_flow")
df = df.withColumnRenamed("高峰时段", "peak_hour")
df = df.withColumnRenamed("日期", "date")
df = df.withColumnRenamed("交通状况指数", "congestion_index")
df = df.withColumnRenamed("天气", "weather")
df = df.withColumnRenamed("交通工具", "transport_mode")
df = df.withColumn("traffic_flow", col("traffic_flow").cast("double"))
df = df.filter(col("traffic_flow").isNotNull())
df = df.filter(col("traffic_flow") > 0)
df = df.filter(col("city").isNotNull())
df = df.withColumn("peak_type", when(col("peak_hour").contains("高峰"), "高峰时段").otherwise("非高峰时段"))
df = df.withColumn("congestion_type", when(col("congestion_index").contains("暢"), "较通畅").otherwise(col("congestion_index")))
peak_group = df.groupBy("peak_type")
peak_result = peak_group.agg(avg("traffic_flow").alias("avg_flow"))
peak_result = peak_result.withColumn("max_flow", max("traffic_flow"))
peak_result = peak_result.withColumn("min_flow", min("traffic_flow"))
peak_result = peak_result.withColumn("std_flow", stddev("traffic_flow"))
peak_result = peak_result.withColumn("var_flow", variance("traffic_flow"))
peak_result = peak_result.withColumn("count_records", count("*"))
peak_result = peak_result.withColumn("sum_flow", sum("traffic_flow"))
global_stat = df.agg(avg("traffic_flow").alias("global_avg"))
global_val = global_stat.collect()[0][0]
peak_result = peak_result.withColumn("benchmark", lit(global_val))
peak_result = peak_result.withColumn("abs_diff", col("avg_flow") - col("benchmark"))
peak_result = peak_result.withColumn("rel_diff", (col("abs_diff") / col("benchmark")) * 100)
peak_result = peak_result.withColumn("congestion_grade", when(col("avg_flow") > 12000, "S级").when(col("avg_flow") > 8000, "A级").when(col("avg_flow") > 5000, "B级").otherwise("C级"))
peak_result = peak_result.withColumn("dispatch_level", when(col("congestion_grade").isin(["S级", "A级"]), "一级响应").when(col("congestion_grade") == "B级", "二级响应").otherwise("三级响应"))
peak_result = peak_result.withColumn("resource_plan", when(col("dispatch_level") == "一级响应", "全员上岗").when(col("dispatch_level") == "二级响应", "增加班次").otherwise("常规排班"))
peak_result = peak_result.orderBy(col("avg_flow").desc())
peak_result.write.mode("overwrite").csv("peak_analysis.csv")
weather_group = df.groupBy("weather", "congestion_type")
weather_stat = weather_group.agg(count("*").alias("case_num"))
weather_stat = weather_stat.withColumn("case_avg", avg("traffic_flow"))
weather_stat = weather_stat.withColumn("case_max", max("traffic_flow"))
weather_base = df.groupBy("weather").agg(count("*").alias("weather_total"))
weather_base = weather_base.withColumn("weather_avg", avg("traffic_flow"))
weather_join = weather_stat.join(weather_base, "weather")
weather_join = weather_join.withColumn("case_ratio", (col("case_num") / col("weather_total")) * 100)
severe_filter = weather_join.filter(col("congestion_type").isin(["拥堵", "严重拥堵"]))
severe_group = severe_filter.groupBy("weather")
severe_result = severe_group.agg(sum("case_num").alias("severe_num"))
severe_result = severe_result.withColumn("severe_avg_ratio", avg("case_ratio"))
weather_final = severe_result.join(weather_base, "weather")
weather_final = weather_final.withColumn("severe_pct", (col("severe_num") / col("weather_total")) * 100)
weather_final = weather_final.withColumn("impact_level", when(col("severe_pct") > 70, "严重影响").when(col("severe_pct") > 50, "较大影响").otherwise("一般影响"))
weather_final = weather_final.withColumn("alert_flag", when(col("severe_pct") > 70, "红色").when(col("severe_pct") > 50, "橙色").otherwise("黄色"))
weather_final = weather_final.withColumn("control_action", when(col("alert_flag") == "红色", "封闭管制").when(col("alert_flag") == "橙色", "限行措施").otherwise("监控加强"))
weather_final = weather_final.withColumn("prep_status", when(col("alert_flag").isin(["红色", "橙色"]), "紧急准备").otherwise("常规准备"))
weather_final = weather_final.orderBy(col("severe_pct").desc())
weather_final.write.mode("overwrite").csv("weather_analysis.csv")
city_group = df.groupBy("city")
city_stat = city_group.agg(avg("traffic_flow").alias("city_avg"))
city_stat = city_stat.withColumn("congestion_days", count(when(col("congestion_type").isin(["拥堵", "严重拥堵"]), True)))
city_stat = city_stat.withColumn("total_days", count("*"))
city_stat = city_stat.withColumn("bus_days", count(when(col("transport_mode") == "公交", True)))
city_stat = city_stat.withColumn("total_trans", count("transport_mode"))
city_stat = city_stat.withColumn("congestion_rate", (col("congestion_days") / col("total_days")) * 100)
city_stat = city_stat.withColumn("bus_rate", (col("bus_days") / col("total_trans")) * 100)
city_stat = city_stat.fillna(0)
city_stat = city_stat.filter(col("total_days") >= 5)
city_stat = city_stat.withColumn("intensity_score", col("city_avg") / 10000 + col("congestion_rate") / 100)
vec_ass = VectorAssembler(inputCols=["city_avg", "congestion_rate", "bus_rate"], outputCol="features")
city_vec = vec_ass.transform(city_stat)
kmeans = KMeans(k=3, featuresCol="features", predictionCol="cluster_id")
km_model = kmeans.fit(city_vec)
city_cluster = km_model.transform(city_vec)
city_cluster = city_cluster.withColumn("cluster_name", when(col("cluster_id") == 0, "特大城市群").when(col("cluster_id") == 1, "大城市群").otherwise("中小城市群"))
city_cluster = city_cluster.withColumn("dev_strategy", when(col("cluster_name") == "特大城市群", "轨道优先").when(col("cluster_name") == "大城市群", "公交优先").otherwise("道路优先"))
city_cluster = city_cluster.withColumn("invest_class", when(col("congestion_rate") > 60, "高投入").when(col("congestion_rate") > 40, "中投入").otherwise("低投入"))
city_cluster = city_cluster.withColumn("urgency_level", when(col("congestion_rate") > 60, "紧急").when(col("congestion_rate") > 40, "重要").otherwise("一般"))
city_cluster = city_cluster.orderBy(col("city_avg").desc())
city_cluster.write.mode("overwrite").csv("city_cluster.csv")
六、项目文档展示

七、项目总结
整套系统做下来,基本上把大数据处理的主流流程都过了一遍,从最开始用Spark读取数据、做清洗转换,到后来做各种维度的分析和聚类建模,每一步都踩了不少坑也学到了不少东西。通过这个《基于大数据的城市交通数据可视化分析系统》,算是把课堂上学的Hadoop理论和Spark实践结合起来了,特别是做城市聚类分析的时候,发现不同城市的交通特征差异比想象中要大很多。当然啦,系统还有很多不够完善的地方,比如数据源只是静态的CSV文件,没有接入实时流数据,分析的维度也可以再丰富一些,像路网结构、信号配时这些更深入的因素还没涉及。不过作为本科阶段的毕业设计,能达到现在这个程度也算是对大学四年学习的一个交代,至少证明了能用技术手段去分析和解决一些实际问题,以后要是继续深造或者工作,这套方法论还是可以继续深化和扩展的。
大家可以帮忙点赞、收藏、关注、评论啦 👇🏻
💖🔥作者主页 :计算机毕设木哥🔥 💖