# -*- coding: UTF-8 -*-
import matplotlib.pyplot as plt
from termcolor import colored
import pandas as pd
import numpy as np
import datetime
import openpyxl
import shutil
import re
import os
plt.rcParams['font.sans-serif']=['SimHei'] #用来正常显示中文标签
plt.rcParams['axes.unicode_minus']=False #用来正常显示符号
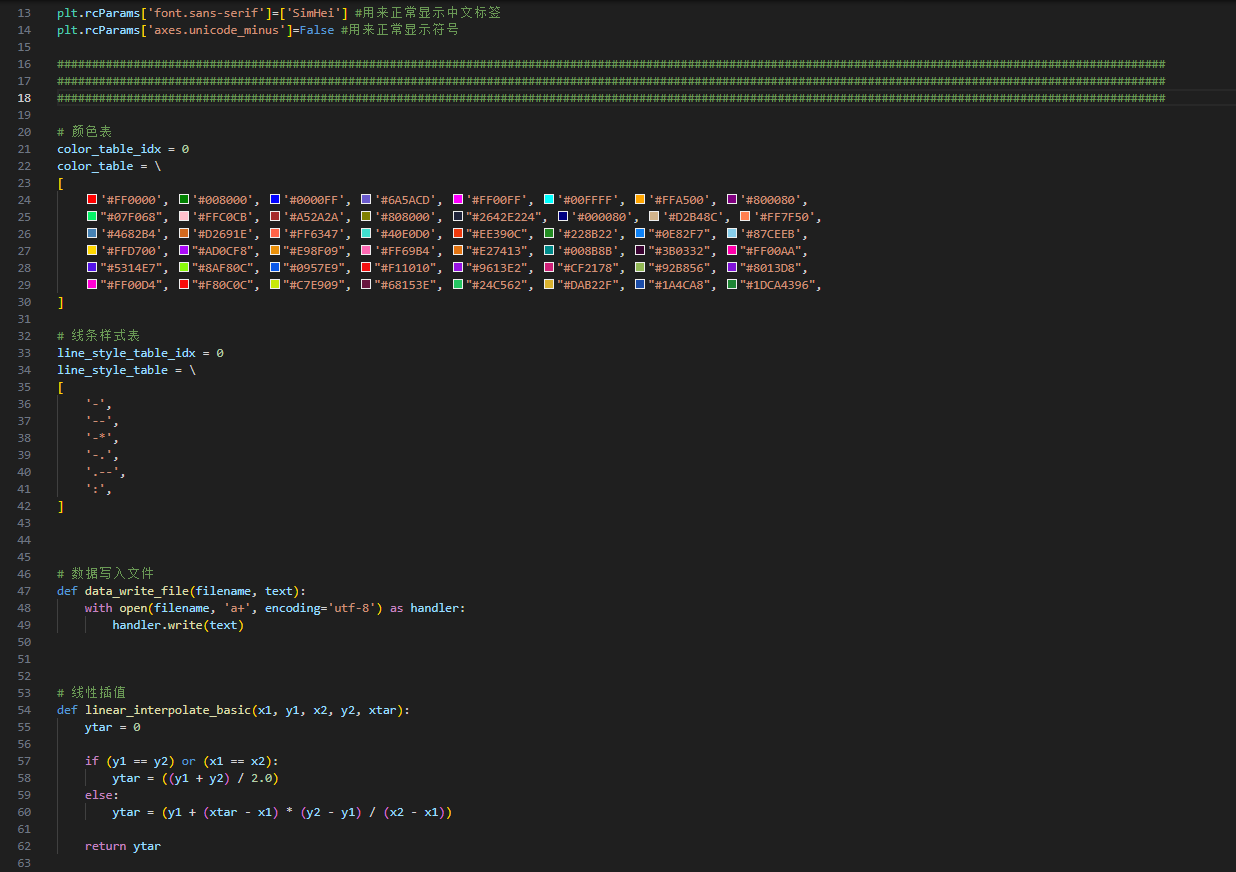
# 颜色表
color_table_idx = 0
color_table = \
[
'#FF0000', '#008000', '#0000FF', '#6A5ACD', '#FF00FF', '#00FFFF', '#FFA500', '#800080',
"#07F068", '#FFC0CB', '#A52A2A', '#808000', "#2642E224", '#000080', '#D2B48C', '#FF7F50',
'#4682B4', '#D2691E', '#FF6347', '#40E0D0', "#EE390C", '#228B22', "#0E82F7", '#87CEEB',
'#FFD700', "#AD0CF8", "#E98F09", '#FF69B4', "#E27413", '#008B8B', "#3B0332", "#FF00AA",
"#5314E7", "#8AF80C", "#0957E9", "#F11010", "#9613E2", "#CF2178", "#92B856", "#8013D8",
"#FF00D4", "#F80C0C", "#C7E909", "#68153E", "#24C562", "#DAB22F", "#1A4CA8", "#1DCA4396",
]
# 线条样式表
line_style_table_idx = 0
line_style_table = \
[
'-',
'--',
'-*',
'-.',
'.--',
':',
]
# 数据写入文件
def data_write_file(filename, text):
with open(filename, 'a+', encoding='utf-8') as handler:
handler.write(text)
# 线性插值
def linear_interpolate_basic(x1, y1, x2, y2, xtar):
ytar = 0
if (y1 == y2) or (x1 == x2):
ytar = ((y1 + y2) / 2.0)
else:
ytar = (y1 + (xtar - x1) * (y2 - y1) / (x2 - x1))
return ytar
#LSKL电池放电测试
def lskl_battery_discharge_handler():
global color_table, color_table_idx, line_style_table, line_style_table_idx
src_file_dir_group = \
[
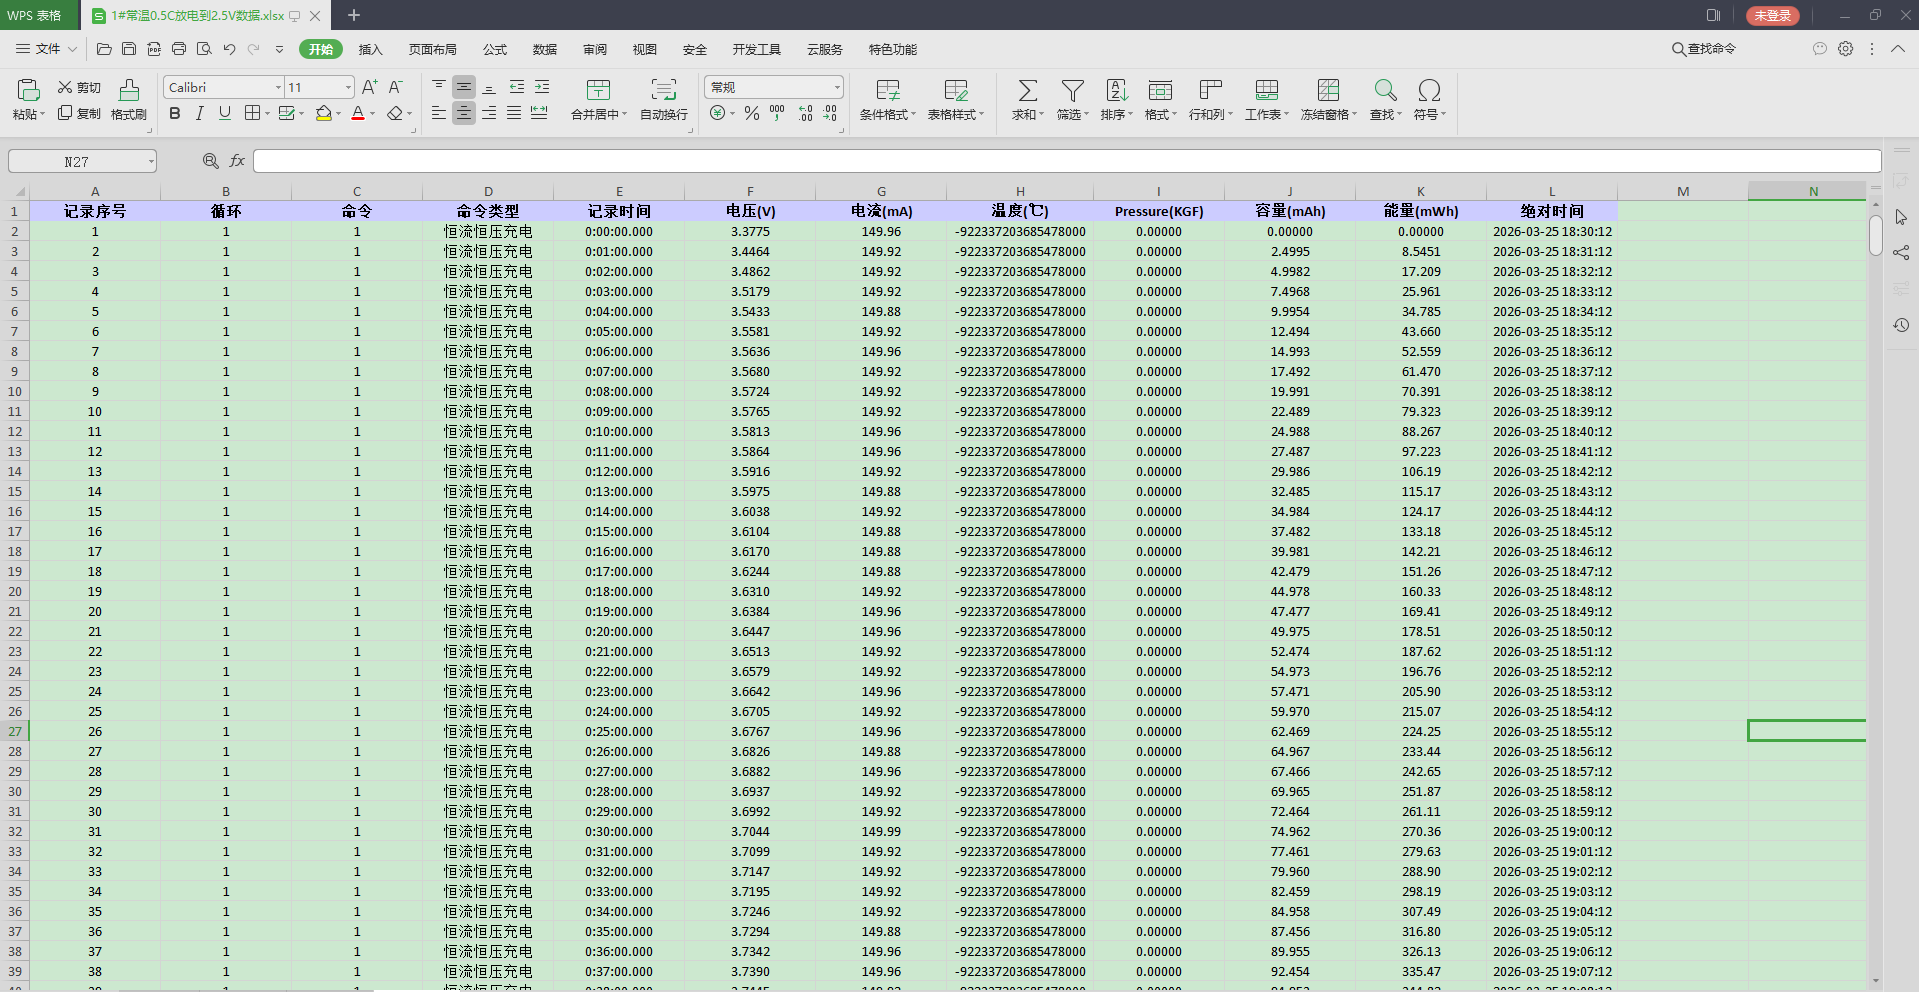
r"G:\xxx\充电\1#常温0.5C放电到2.5V数据.xlsx",
r"G:\xxx\充电\2#常温0.5C放电到2.5V数据.xlsx",
r"G:\xxx\充电\3#常温0.5C放电到2.5V数据.xlsx",
r"G:\xxx\充电\4#常温0.5C放电到2.5V数据.xlsx",
]
src_file_tag_group = \
[
{ '编号': '1#' , '温度' : '25℃' },
{ '编号': '2#' , '温度' : '25℃' },
{ '编号': '3#' , '温度' : '25℃' },
{ '编号': '4#' , '温度' : '25℃' },
]
time = [] # 时间s
votg = [] # 电压V
curg = [] # 电流mA
capa = [] # 容量mAh
eneg = [] # 能量mWh
start_time = 0 # 开始时间
fig = plt.figure(figsize=(12,8)) #创建图形窗口
for dir, tag in zip(src_file_dir_group, src_file_tag_group):
if os.path.exists(dir) == False: continue # 文件不存在
if os.path.getsize(dir) < 1000: continue # 文件太小
fullName = os.path.basename(dir) # 获取文件名+拓展名
fileName = os.path.splitext(fullName)[0]# 文件名
time.clear()
votg.clear()
curg.clear()
capa.clear()
eneg.clear()
start_time = 0
df = pd.read_excel(src_file_dir_group[0], sheet_name='记录列表1', engine='openpyxl', header=None) # 读取excel文件
for row_idx, row_dat in df.iterrows(): # 逐行遍历
line_dat = row_dat.tolist() # 转换为列表
actv_dat = [x for x in line_dat if not pd.isna(x)] # 过滤掉空值
# print(actv_dat)
################################################################################################################################################################
if len(actv_dat) == 0:
if len(votg) > 20:
num = tag.get('编号','异常')
tmp = tag.get('温度','异常')
hour = time[-1] / 60 / 60 #充电时长
cap = capa[-1] #已充容量
svol = int(np.round(votg[0] * 1000, 0)) # 起始电压
evol = int(np.round(votg[-1] * 1000, 0)) # 结束电压
extLab = '%s 温度:%-4s 充电时长:%.2fh 容量:%.2fmAh 起止电压:%4d → %4dmV' % (num, tmp, hour, cap, svol, evol)
plt.plot(time, votg, line_style_table[line_style_table_idx], color=color_table[color_table_idx], label=extLab)
line_style_table_idx = (line_style_table_idx + 1) % len(line_style_table)
color_table_idx = (color_table_idx + 1) % len(color_table)
true_votg = [] # 真实电压
rema_time = [] # 剩余时间
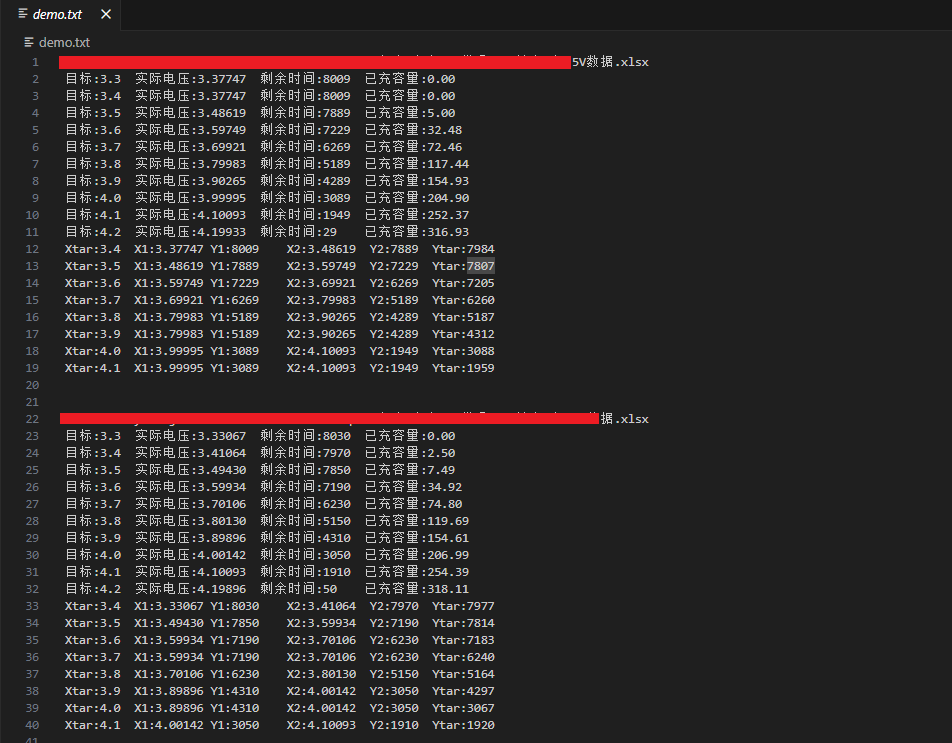
data_write_file('demo.txt', dir + '\n')
# 剩余充电时间和实际电压关系
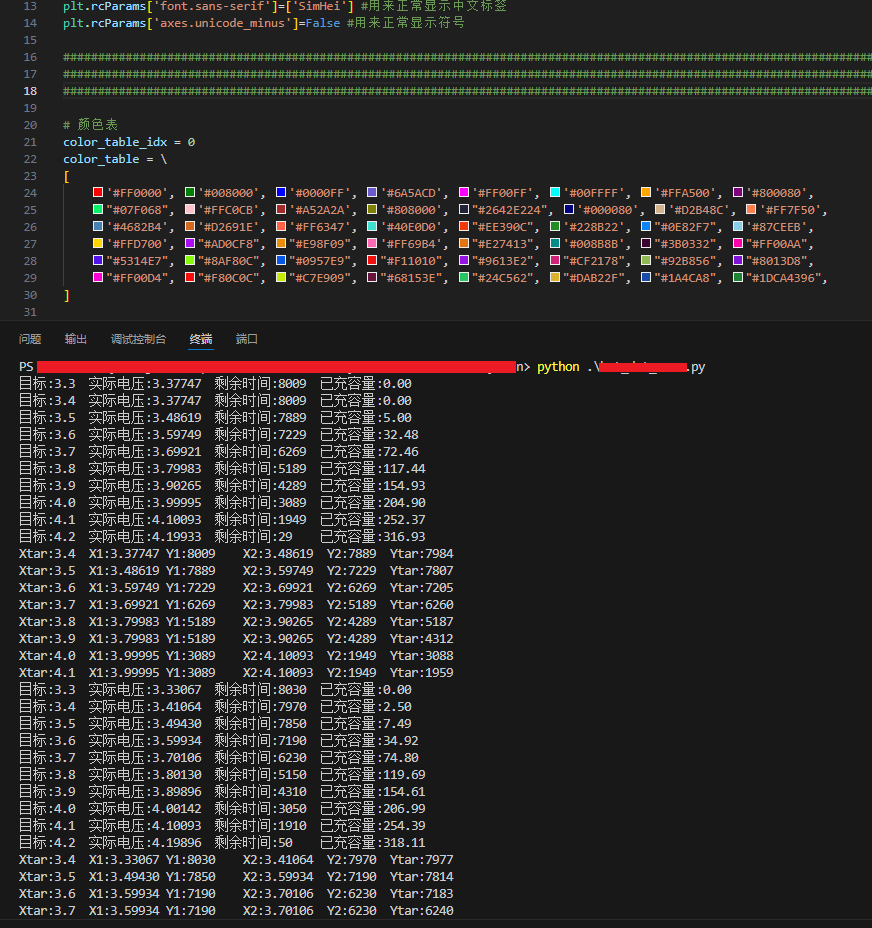
for tar in np.arange(3.3, 4.3, 0.1):
arr = np.array(votg) # 转为NumPy数组
idx = np.abs(arr - tar).argmin() # 找最小差值索引
rtime = time[-1] - time[idx] # 剩余时间
rcapa = capa[idx] # 已充容量
rtrue = votg[idx] # 实际电压
true_votg.append(rtrue)
rema_time.append(rtime)
txt1 = '目标:%.1f 实际电压:%.5f 剩余时间:%-4d 已充容量:%.2f' % (tar, rtrue, rtime, rcapa)
data_write_file('demo.txt', txt1 + '\n')
print(txt1)
for tar in np.arange(3.4, 4.3, 0.1):
for i in range(len(true_votg) - 1): # 目标电压范围
if tar >= true_votg[i] and tar <= true_votg[i + 1]:
x1 = true_votg[i]
y1 = rema_time[i]
x2 = true_votg[i + 1]
y2 = rema_time[i + 1]
xtar = tar
ytar = linear_interpolate_basic(x1, y1, x2, y2, xtar) # 线性插值
txt1 = 'Xtar:%.1f X1:%.5f Y1:%-4d X2:%.5f Y2:%-4d Ytar:%d' % (xtar, x1, y1, x2, y2, int(ytar))
data_write_file('demo.txt', txt1 + '\n') # 写入文件
print(txt1)
data_write_file('demo.txt', '\r\n')
# 清空数据
time.clear()
votg.clear()
curg.clear()
capa.clear()
eneg.clear()
start_time = 0
################################################################################################################################################################
################################################################################################################################################################
# 恒流恒压充电
if len(actv_dat) < 12: continue
if actv_dat[3] != '恒流恒压充电': continue
votg.append(float(actv_dat[5])) # 电压
curg.append(float(actv_dat[6])) # 电流
capa.append(float(actv_dat[9])) # 电容
eneg.append(float(actv_dat[10])) # 能量
dt = datetime.datetime.strptime(actv_dat[11], "%Y-%m-%d %H:%M:%S") # 2026-03-25 18:33:12
tamp = int(dt.timestamp()) # 时间戳
if len(votg) == 1: start_time = tamp # 开始时间
time.append(tamp - start_time) # 时间
################################################################################################################################################################
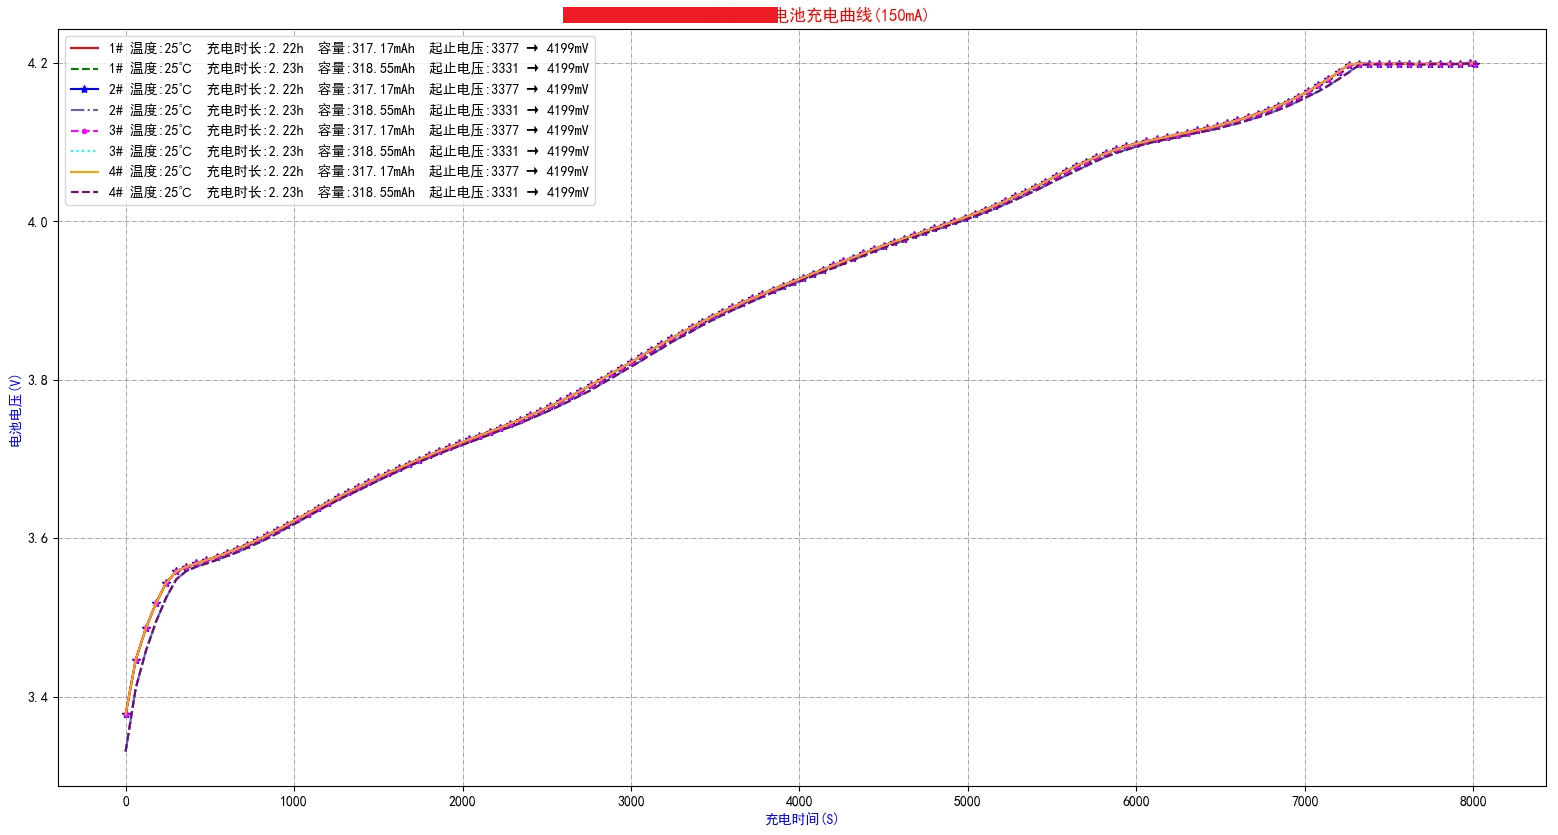
plt.title('XXX设备常温下电池充电曲线(150mA)', fontsize=12, fontweight='bold', color='red') # 标题加粗
plt.xlabel('充电时长(S)', fontsize=10, color='blue') # 可指定字体大小、颜色
plt.ylabel('电池电压(V)', fontsize=10, color='blue')
plt.grid(True, color='gray', linestyle='dashdot', linewidth=0.5)
plt.legend()#plot(label)显示出来
plt.show(block=True) #显示图片True阻塞模式