一。基本原理:
Prometheus的基本原理是通过HTTP协议周期性抓取被监控组件的状态,任意组件只要提供对应的HTTP接口就可以接入监控。不需要任何SDK或者其他的集成过程。这样做非常适合做虚拟化环境监控系统,比如VM、Docker、Kubernetes等。输出被监控组件信息的HTTP接口被叫做exporter。目前互联网公司常用的组件大部分都有exporter可以直接使用,比如Varnish、Haproxy、Nginx、MySQL、Linux系统信息(包括磁盘、内存、CPU 、网络等等)。
实验环境准备
服务器IP分配
Prometheus服务器:192.168.1.30
被监控Linux主机:10.1.187.231和10.1.187.233
被监控windows主机:10.1.187.232和10.1.187.234
二。Prometheus的安装:
前提:打开一台虚拟机,关闭防火墙和SELinux
cpp
# 关闭防火墙
systemctl stop firewalld
systemctl disable firewalld

# 关闭SELinux
setenforce 0- wget -c https://github.com/prometheus/prometheus/releases/download/v2.21.0/ prometheus-3.3.0.linux-amd64.tar.gz
2.tar xf prometheus-3.3.0.linux-amd64.tar.gz -C /usr/local/:压缩文件
cpp
[root@genkins ~]# echo "创建软链接"
创建软链接
[root@genkins ~]# cd /usr/local
[root@genkins local]# ln -sv prometheus-3.3.0.linux-amd64/ prometheus
'prometheus' -> 'prometheus-3.3.0.linux-amd64/'
[root@genkins local]# mkdir -p /usr/local/prometheus/data创建数据存储文件
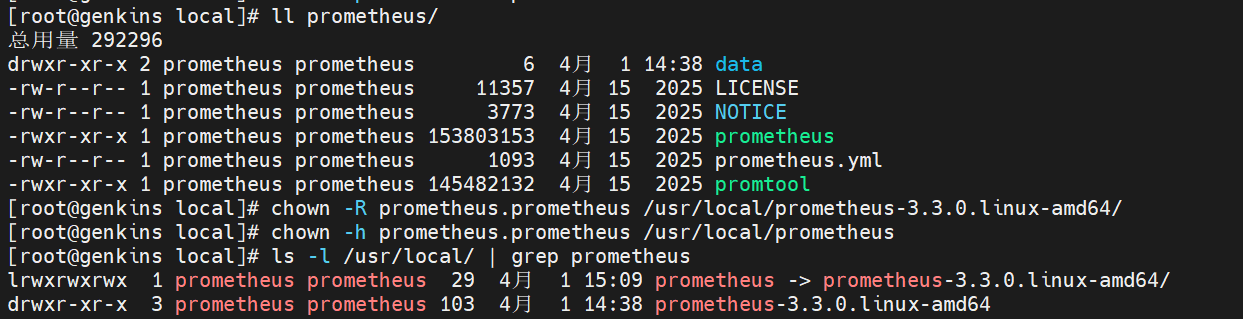
[root@genkins local]# ll prometheus/3.useradd prometheus -M -s /sbin/nologin:添加服务运行用户
4.chown -R prometheus.prometheus /usr/local/prometheus/*:添加权限
chown -h prometheus.prometheus /usr/local/prometheus
7.vim /usr/lib/systemd/system /prometheus.service:创建服务运行启动脚本
bash
[Unit]
Description=prometheus
After=network.target

[Service]
Type=simple
User=prometheus
ExecStart=/usr/local/prometheus/prometheus --config.file=/usr/local/prometheus/prometheus.yml --storage.tsdb.path=/usr/local/prometheus/data
Restart=on-failure
ExecReload=/bin/kill -HUP $MAINPID
[Install]
WantedBy=multi-user.target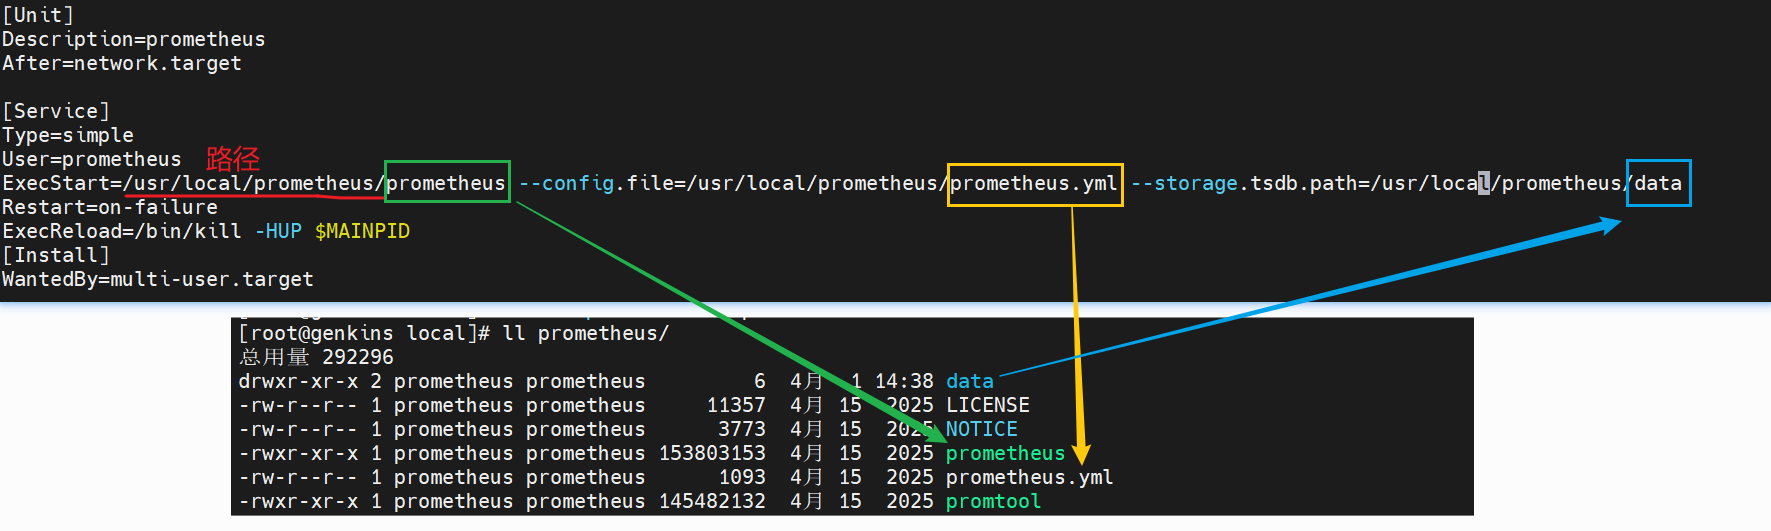
8.systemctl daemon-reload:加载内容
9.启动服务
cpp
[root@genkins local]# systemctl daemon-reload
[root@genkins local]# systemctl start prometheus暂时启动/或者systemctl enable --now prometheus.service开机自启服务(永久)
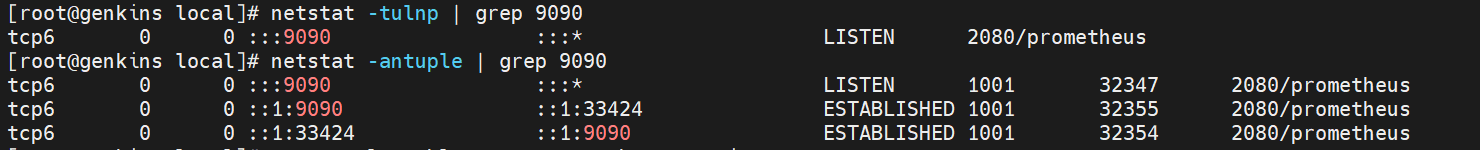
[root@genkins local]# systemctl status prometheus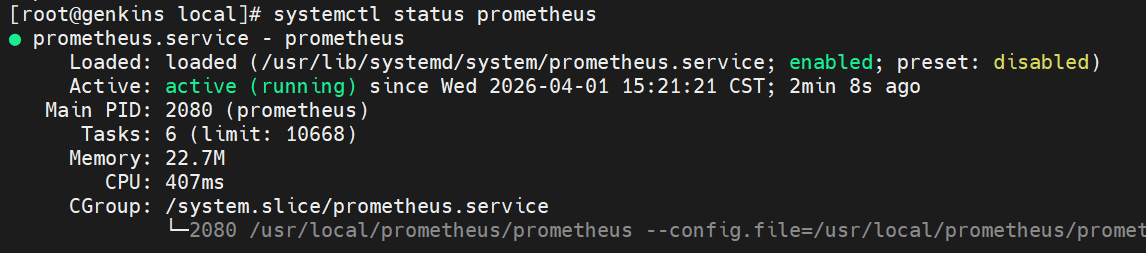
这样Prometheus就部署完成了
三、Prometheus监控案例
3.1 监控远程Linux主机
使用Node Exporter采集主机运行数据
在Prometheus的架构设计中, Prometheus Server并不直接服务监控特定的目标, 其主要任务负责数据的收集,存储并且对外提供数据查询支持。 因此为了能够能够监控到某些东西, 如主机的CPU使用率, 我们需要使用到Exporter。 Prometheus周期性的从Exporter暴露的HTTP服务地址( 通常是/metrics) 拉取监控样本数据。
从上面的描述中可以看出Exporter可以是一个相对开放的概念, 其可以是一个独立运行的程序独立于监控目标以外,也可以是直接内置在监控目标中。 只要能够向Prometheus提供标准格式的监控样本数据即可。
这里为了能够采集到主机的运行指标如CPU, 内存, 磁盘等信息。 我们可以使用Node Exporter。
配置过程:
前提:在另外一台主机上配置,不要在配置了prometheus的主机上配置
10.1.187.231和10.1.187.233(因为都是linux系统所以操作相同)
1.wget -c https://github.com/prometheus/node_exporter /releases/download/v1.0.1/node_exporter-1.0.1.linux-amd64.tar.gz
2.tar xf node_exporter-1.9.1.linux-amd64.tar.gz -C /usr/local/:进行解压
- ln -sv /usr/local/node_exporter-1.9.1.linux-amd64/ /usr/local/node_exporter:创建软连接
4.useradd prometheus -M -s /sbin/nologin:创建用户
-M:不给用户创建主目录,适合仅运行服务的系统用户;
-s /sbin/nologin:禁止用户登录系统,提升安全性
5.chown -R prometheus.prometheus /usr/local/node_exporter/*:授予权限
6.vim /usr/lib/systemd/system/node_exporter.service:添加node_exporter的服务脚本
cpp
[Unit]

Description=node_exporter

After=network.target

[Service]

Type=simple

User=prometheus

ExecStart=/usr/local/node_exporter/node_exporter

Restart=on-failure

[Install]

WantedBy=multi-user.target
7.systemctl daemon-reload:加载脚本
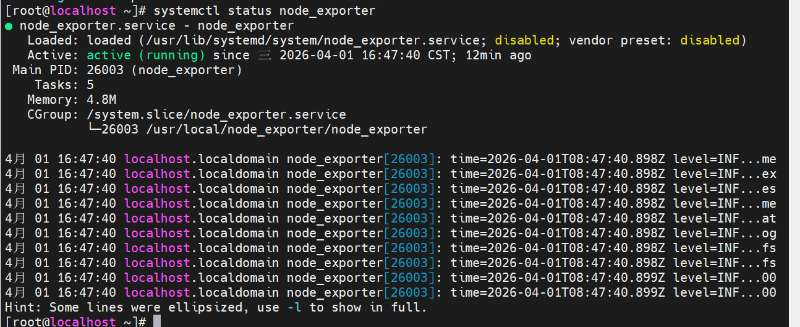
8.systemctl start node_exporter.service:开启服务

9.curl http://IP/metrics:测试主机是否被监控
在 prometheus 主机(192.168.1.30) 上执行:
cpp
# 测试 node_exporter 是否正常工作(访问被监控端)
curl http://10.1.187.231:9100/metrics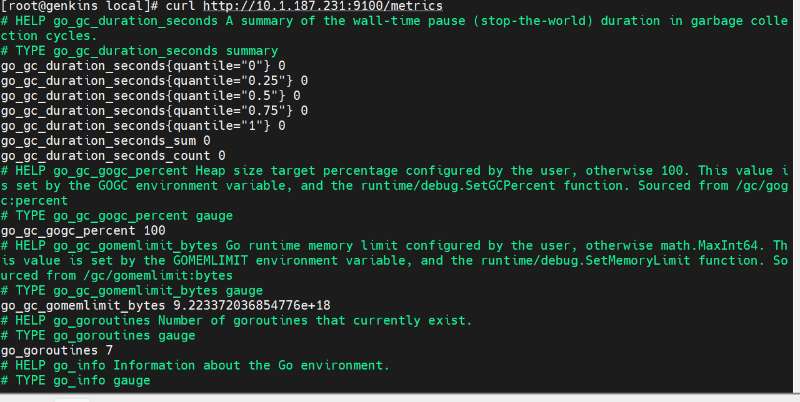
或者你也可以在 node_exporter 主机(10.1.187.231) 本机执行:
bash
# 在本机测试
curl http://localhost:9100/metrics
# 或
curl http://127.0.0.1:9100/metrics
测试:在prometheus的主机上内添加node
1.vi /usr/local/prometheus/prometheus.yml:进行配置内容
2.systemctl restart prometheus.service:重启
查看结果:是否存在两个监控内容:去浏览器页面刷新
3.2。监控windows的过程
先通过这个登上windows服务器主机(两台windows都一样)
登录 Windows 后:
-
点击左下角"开始"菜单
-
输入
powershell -
右键点击"Windows PowerShell" → 选择"以管理员身份运行"
1.首先在需要监控的Windows机器上安装wmi_exporter。wmi_exporter下载地址:https://github.com/martinlindhe/wmi_exporter/releases1
(https://kd-1258460726.cos.ap-nanjing.myqcloud.com//typora-pic/image-20200923142822716.png)
安装完毕之后,会自动创建一个开机自启的服务。
确认服务状态:
-
按
Win + R,输入services.msc,回车 -
在服务列表中找到
windows_exporter -
查看"状态"列:
-
✅ "正在运行" → 已经自动启动了,无需任何操作
-
❌ 空白 → 手动启动(右键点击 → 启动)
-
-
PowerShell 中执行:
Get-Service windows_exporter
如果状态是 Running,说明服务已经在运行,不需要任何操作。
如果状态是 Stopped,可以手动启动:Start-Service windows_exporter
2、验证服务是否正常工作,默认wmi-exporter端口为9182
在 PowerShell 中执行: curl http://localhost:9182/metrics
或者打开浏览器,访问http://localhost:9182/metrics
正常情况 :会返回大量以 # HELP 和 # TYPE 开头的 Prometheus 格式指标数据,最后有类似 windows_cpu_time_total{...} 123456 这样的内容
如
cpp
PS C:\Users\Administrator> curl http://localhost:9182/metrics


StatusCode        : 200
StatusDescription : OK
Content           : # HELP go_build_info Build information about the main Go module.
                    # TYPE go_build_info gauge
                    go_build_info{checksum="",path="github.com/prometheus-community/windows_exporter",version="(devel)"
                    } 1
                    # HEL...
RawContent        : HTTP/1.1 200 OK
                    Process-Start-Time-Unix: 1775114254
                    Transfer-Encoding: chunked
                    Content-Type: text/plain; version=0.0.4; charset=utf-8; escaping=underscores
                    Date: Thu, 02 Apr 2026 07:25:54 GMT

                    #...
Forms             : {}
Headers           : {[Process-Start-Time-Unix, 1775114254], [Transfer-Encoding, chunked], [Content-Type, text/plain; ve
                    rsion=0.0.4; charset=utf-8; escaping=underscores], [Date, Thu, 02 Apr 2026 07:25:54 GMT]}
Images            : {}
InputFields       : {}
Links             : {}
ParsedHtml        : System.__ComObject
RawContentLength  : 263002
3.3。监控mysql进程
1.CREATE USER 'mysql_monitor'@'localhost' IDENTIFIED BY '1';在mysql中创建用户
2.GRANT SELECT, REPLICATION CLIENT, PROCESS ON *.* TO 'mysql_monitor'@'localhost';
-
tar xf mysqld_exporter-0.17.2.linux-amd64.tar.gz -C /usr/local/:进行压缩
-
ln -sv mysqld_exporter-0.17.2.linux-amd64/ /usr/local/mysqld_exporter:创建软连接
6.vi /usr/local/mysqld_exporter/.my.cnf:创建隐藏文件的用户内容脚本
7.vi /usr/lib/systemd/system/mysql_exporter.service:创建服务启动脚本
Unit
Description=mysqld_exporter
After=network.target
Service
Type=simple
User=prometheus
ExecStart=/usr/local/mysqld_exporter/mysqld_exporter --config.my-cnf=/usr/local/mysqld_exporter/.my.cnf
Restart=on-failure
Install
WantedBy=multi-user.target:添加用户
8.useradd prometheus -M -s /sbin/nologin
9.chown -R prometheus.prometheus /usr/local/mysqld_exporter/*:添加权限
10.systemctl daemon-reload:加载脚本
11.systemctl start mysql_exporter.service:启动服务
Prometheus配置:
1.vi /usr/local/prometheus/prometheus.yml
- systemctl restart prometheus.service
测试效果:查看是否被监控
3.4在 Prometheus 服务器上添加 Windows 监控目标
编辑 Prometheus 配置文件vim /usr/local/prometheus/prometheus.yml
cpp
global:
  scrape_interval: 15s
  evaluation_interval: 15s

scrape_configs:
  # Prometheus 自身监控
  - job_name: 'prometheus'
    static_configs:
      - targets: ['localhost:9090']

  # ===== 公司 Windows 服务器 =====
  - job_name: 'windows_10.1.187.232'
    static_configs:
      - targets: ['10.1.187.232:9182']
        labels:
          os: 'windows'
          env: 'production'
          instance: 'win-server-01'

  - job_name: 'windows_10.1.187.234'
    static_configs:
      - targets: ['10.1.187.234:9182']
        labels:
          os: 'windows'
          env: 'production'
          instance: 'win-server-02'

  # ===== 公司 Linux 服务器(node_exporter) =====
  - job_name: 'linux_10.1.187.231'
    static_configs:
      - targets: ['10.1.187.231:9100']
        labels:
          os: 'linux'
          env: 'production'
          instance: 'linux-server-01'

  - job_name: 'linux_10.1.187.233'
    static_configs:
      - targets: ['10.1.187.233:9100']
        labels:
          os: 'linux'
          env: 'production'
          instance: 'linux-server-02'

  # ===== 阿里云服务器(可选,需要网络互通) =====
  # - job_name: 'aliyun_linux_139.196.235.214'
  #   static_configs:
  #     - targets: ['139.196.235.214:9100']
  #       labels:
  #         os: 'linux'
  #         env: 'aliyun'
检查配置语法
/usr/local/prometheus/promtool check config /usr/local/prometheus/prometheus.yml
输出 SUCCESS,说明配置正确。注意缩进
systemctl restart prometheus重启 Prometheus 服务
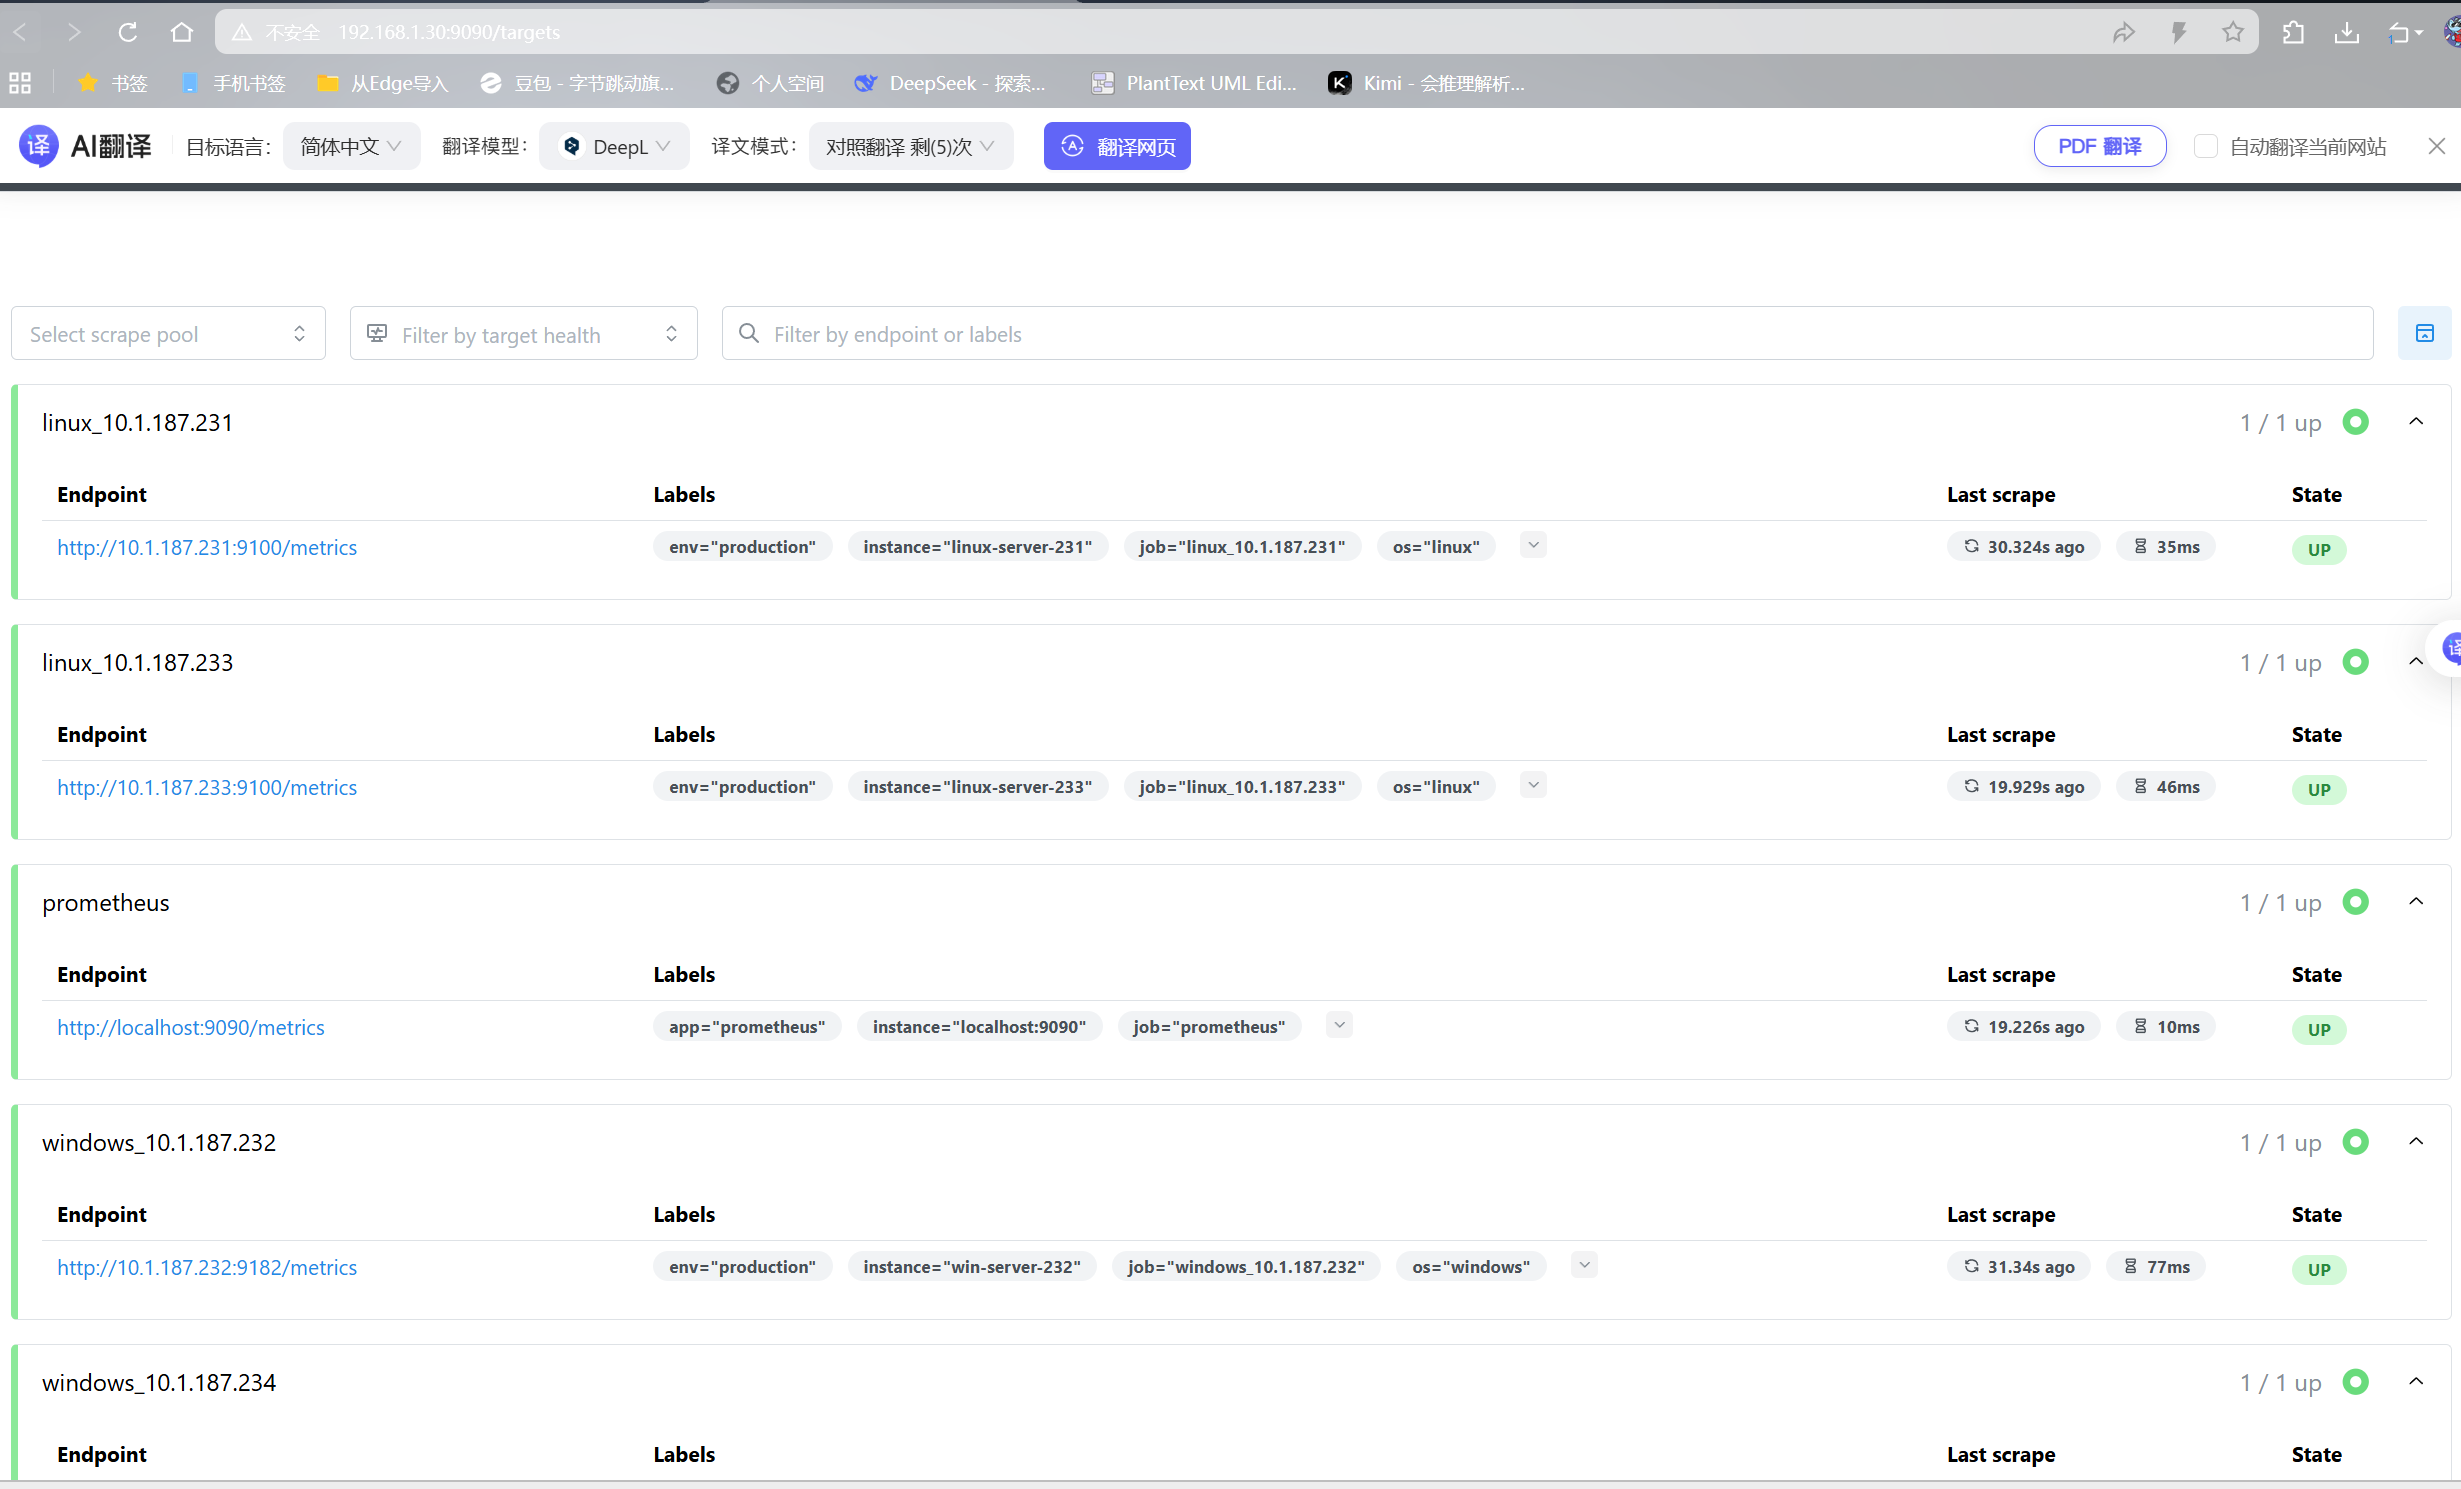
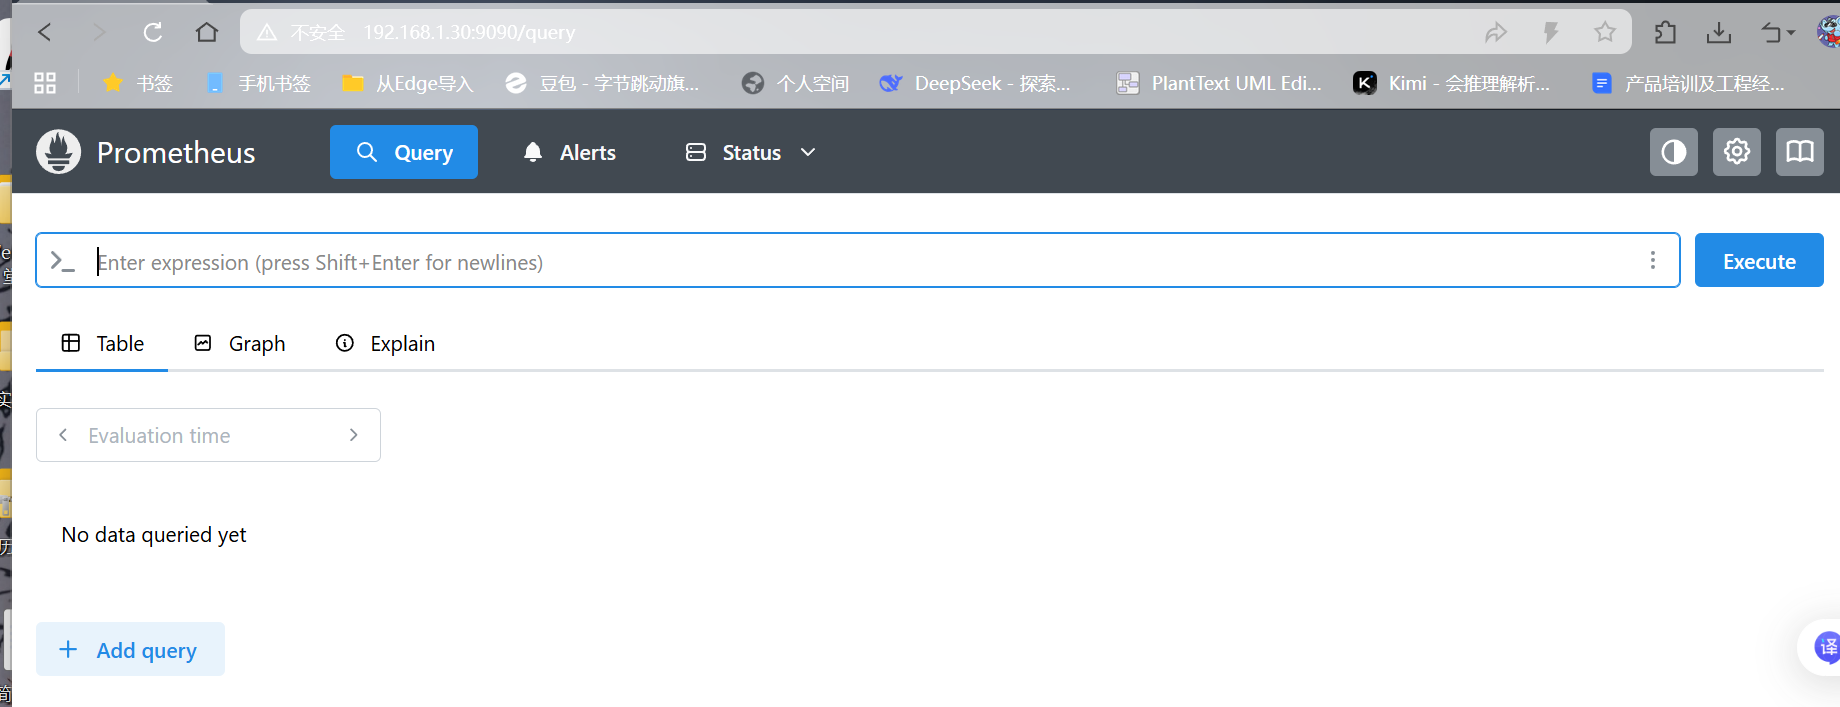
访问 Prometheus Web 界面:刷新:http://192.168.1.30:9090/targets
后面是绿色的up