案例:汽车款式聚类
案例背景
本案例的数据基于R语言 ISLR 包中的Auto数据集,数据集中共有392个样本, 8个特征,根据每种汽车的参数,利用聚类算法来进行聚类,识别出相似的汽车。
数据读取与划分
python
# 忽略警告信息
import warnings
warnings.filterwarnings("ignore")
python
import numpy as np
import pandas as pd
from plotnine import *
from sklearn import metrics
python
# 读入数据
auto = pd.read_csv('./input/Auto.csv')
auto.head()
| | mpg | cylinders | displacement | horsepower | weight | acceleration | year | origin |
| 0 | 18.0 | 8 | 307.0 | 130 | 3504 | 12.0 | 70 | 1 |
| 1 | 15.0 | 8 | 350.0 | 165 | 3693 | 11.5 | 70 | 1 |
| 2 | 18.0 | 8 | 318.0 | 150 | 3436 | 11.0 | 70 | 1 |
| 3 | 16.0 | 8 | 304.0 | 150 | 3433 | 12.0 | 70 | 1 |
| 4 | 17.0 | 8 | 302.0 | 140 | 3449 | 10.5 | 70 | 1 |
|---|
python
#对连续变量用Z-score标准化
from sklearn.preprocessing import StandardScaler
scaler = StandardScaler()
auto[['mpg','displacement','horsepower','weight','acceleration']] = scaler.fit_transform(auto[['mpg','displacement','horsepower','weight','acceleration']])

#对类别变量进行哑变量编码
auto_scaled = pd.get_dummies(data=auto,columns=['cylinders','year','origin'])
python
## 再次查看数据前5行
auto_scaled.head()
| | mpg | displacement | horsepower | weight | acceleration | cylinders_3 | cylinders_4 | cylinders_5 | cylinders_6 | cylinders_8 | ... | year_76 | year_77 | year_78 | year_79 | year_80 | year_81 | year_82 | origin_1 | origin_2 | origin_3 |
| 0 | -0.698638 | 1.077290 | 0.664133 | 0.620540 | -1.285258 | 0 | 0 | 0 | 0 | 1 | ... | 0 | 0 | 0 | 0 | 0 | 0 | 0 | 1 | 0 | 0 |
| 1 | -1.083498 | 1.488732 | 1.574594 | 0.843334 | -1.466724 | 0 | 0 | 0 | 0 | 1 | ... | 0 | 0 | 0 | 0 | 0 | 0 | 0 | 1 | 0 | 0 |
| 2 | -0.698638 | 1.182542 | 1.184397 | 0.540382 | -1.648189 | 0 | 0 | 0 | 0 | 1 | ... | 0 | 0 | 0 | 0 | 0 | 0 | 0 | 1 | 0 | 0 |
| 3 | -0.955212 | 1.048584 | 1.184397 | 0.536845 | -1.285258 | 0 | 0 | 0 | 0 | 1 | ... | 0 | 0 | 0 | 0 | 0 | 0 | 0 | 1 | 0 | 0 |
| 4 | -0.826925 | 1.029447 | 0.924265 | 0.555706 | -1.829655 | 0 | 0 | 0 | 0 | 1 | ... | 0 | 0 | 0 | 0 | 0 | 0 | 0 | 1 | 0 | 0 |
|---|
5 rows × 26 columns
K-Means模型搭建与评估
python
#K-means聚类
from sklearn.cluster import KMeans
model = KMeans(n_clusters=3,random_state=42).fit(auto_scaled)    #设置随机种子为42
#样本标签和簇质心
auto_label = model.labels_
auto_cluster = model.cluster_centers_
auto_labelarray([0, 0, 0, 0, 0, 0, 0, 0, 0, 0, 0, 0, 0, 0, 2, 1, 1, 1, 2, 2, 2, 2,
2, 2, 1, 0, 0, 0, 0, 2, 2, 2, 1, 1, 1, 1, 1, 0, 0, 0, 0, 0, 0, 0,
1, 2, 1, 1, 2, 2, 2, 2, 2, 2, 2, 2, 2, 2, 2, 2, 2, 0, 0, 0, 0, 0,
0, 0, 0, 0, 2, 0, 0, 0, 0, 2, 2, 2, 2, 2, 2, 2, 2, 2, 0, 0, 0, 0,
0, 0, 0, 0, 0, 0, 0, 0, 1, 1, 1, 1, 1, 2, 0, 0, 0, 0, 1, 2, 2, 2,
2, 2, 1, 2, 0, 0, 2, 2, 2, 2, 0, 2, 1, 0, 1, 1, 1, 2, 2, 2, 2, 1,
1, 1, 0, 0, 0, 0, 0, 2, 2, 2, 2, 2, 2, 2, 2, 2, 2, 2, 1, 1, 1, 1,
0, 0, 0, 0, 1, 1, 1, 1, 1, 1, 0, 2, 2, 1, 2, 2, 2, 2, 1, 2, 1, 2,
2, 2, 2, 2, 2, 2, 2, 2, 2, 0, 0, 0, 0, 1, 1, 1, 1, 2, 2, 2, 2, 1,
1, 1, 1, 2, 2, 2, 2, 2, 0, 2, 1, 1, 0, 0, 0, 0, 2, 2, 2, 2, 2, 0,
1, 0, 0, 1, 1, 1, 1, 0, 0, 0, 0, 2, 2, 2, 2, 2, 2, 2, 2, 1, 2, 2,
2, 2, 2, 2, 2, 1, 0, 0, 1, 1, 1, 2, 1, 1, 1, 1, 1, 1, 0, 1, 0, 0,
2, 2, 2, 2, 2, 2, 2, 2, 1, 1, 2, 1, 2, 2, 1, 1, 2, 1, 1, 0, 0, 0,
0, 0, 0, 1, 0, 2, 2, 2, 2, 1, 1, 2, 1, 2, 2, 2, 2, 2, 1, 1, 2, 2,
2, 2, 2, 2, 2, 2, 1, 2, 2, 2, 2, 2, 2, 2, 2, 2, 2, 2, 2, 2, 2, 2,
1, 2, 2, 2, 2, 2, 2, 1, 2, 2, 2, 2, 2, 2, 2, 2, 2, 2, 2, 2, 2, 2,
2, 2, 2, 2, 1, 1, 1, 1, 1, 1, 2, 2, 2, 2, 2, 2, 2, 2, 2, 2, 2, 2,
2, 2, 2, 2, 2, 2, 1, 1, 2, 1, 2, 2, 2, 2, 2, 2, 2, 2])
python
#画每个簇样本数的柱状图
auto_label_dataframe = pd.DataFrame({'clusters':auto_label})
auto_label_dataframe['clusters'] = auto_label_dataframe['clusters'].astype('category')
ggplot(auto_label_dataframe,aes('clusters',fill='clusters')) + geom_bar()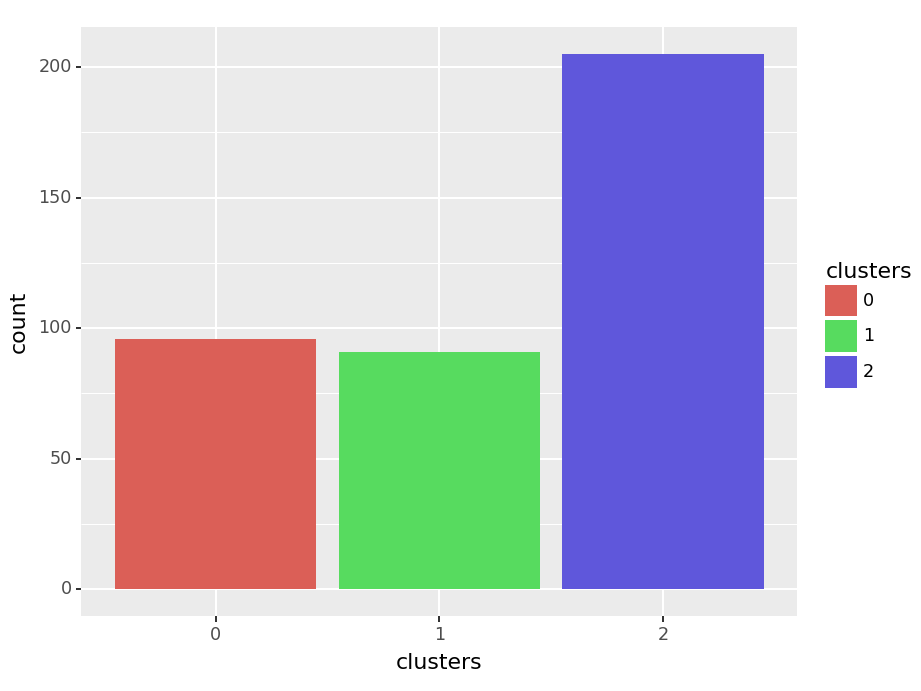
<Figure Size: (460 x 345)>
python
# 轮廓系数评估聚类效果
labels = model.labels_
print("轮廓系数(Silhouette Coefficient): %0.4f"
% metrics.silhouette_score(auto_scaled, labels))轮廓系数(Silhouette Coefficient): 0.3183
python
# 选择不同k值比较聚类效果
for i in [2,4,6]:
    model = KMeans(n_clusters=i,random_state=42).fit(auto_scaled)   #设置随机种子为111
    labels = model.labels_
print("k=%d 轮廓系数(Silhouette Coefficient): %0.4f"% (i,metrics.silhouette_score(auto_scaled, labels)))k=2 轮廓系数(Silhouette Coefficient): 0.4152
k=4 轮廓系数(Silhouette Coefficient): 0.2548
k=6 轮廓系数(Silhouette Coefficient): 0.2039层次聚类模型搭建与评估
python
from sklearn.cluster import AgglomerativeClustering
python
single_model = AgglomerativeClustering(n_clusters=3,linkage="single").fit(auto_scaled)

single_labels = single_model.labels_
print("Single Linkage 轮廓系数(Silhouette Coefficient): %0.4f"
% metrics.silhouette_score(auto_scaled, single_labels))Single Linkage 轮廓系数(Silhouette Coefficient): 0.0111
python
complete_model = AgglomerativeClustering(n_clusters=3, linkage='complete').fit(auto_scaled)

complete_labels = complete_model.labels_
print("Complete Linkage 轮廓系数(Silhouette Coefficient): %0.4f"
% metrics.silhouette_score(auto_scaled, complete_labels))Complete Linkage 轮廓系数(Silhouette Coefficient): 0.2297
python
average_model = AgglomerativeClustering(n_clusters=3, linkage='average').fit(auto_scaled)

average_labels = average_model.labels_
print("Average Linkage轮廓系数(Silhouette Coefficient): %0.4f"
% metrics.silhouette_score(auto_scaled, average_labels))Average Linkage轮廓系数(Silhouette Coefficient): 0.3075
python
#画每个簇样本数的柱状图
auto_label = average_model.labels_
auto_label_dataframe = pd.DataFrame({'clusters':auto_label})
auto_label_dataframe['clusters'] = auto_label_dataframe['clusters'].astype('category')
ggplot(auto_label_dataframe,aes('clusters',fill='clusters')) + geom_bar()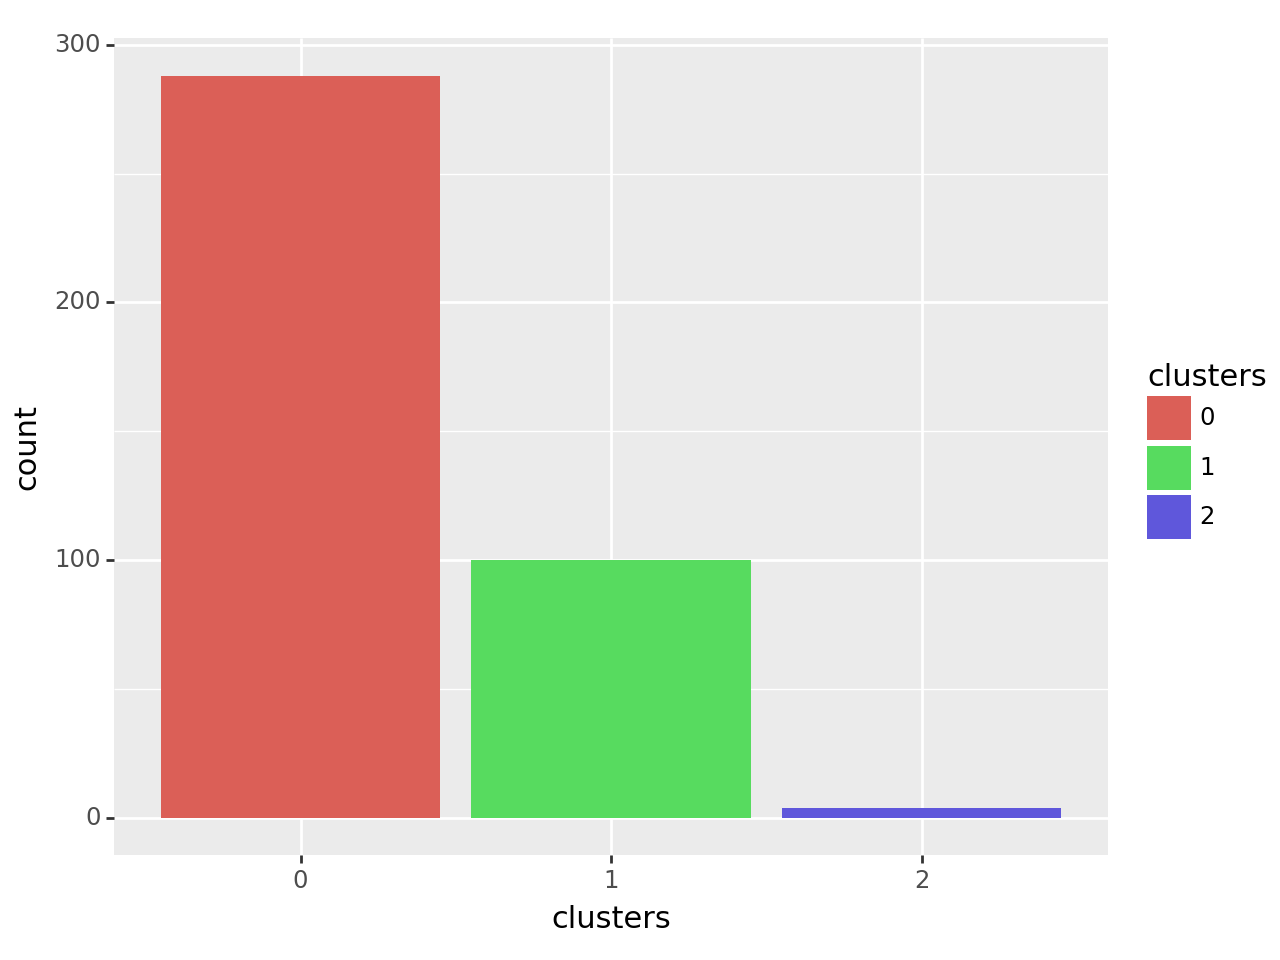
python
# 绘制谱系图
from scipy.spatial.distance import pdist
from scipy.cluster.hierarchy import linkage, dendrogram
import matplotlib.pyplot as plt
plt.rcParams['font.sans-serif'] = ['SimHei']

#利用scipy中pdist,linkage,dendrogram函数绘制谱系图
#pdist函数返回距离矩阵,linkage函数返回一个ndarray对象,描述了簇合并的过程
#dendrogram函数用来绘制谱系图
row_clusters = linkage(pdist(auto_scaled,metric='euclidean'),method='ward')
fig = plt.figure(figsize=(12,10))
#参数p和参数truncate_mode用来将谱系图截断,部分结点的子树被剪枝,横轴显示的是该结点包含的样本数
row_dendr = dendrogram(row_clusters,p=50,truncate_mode='lastp',color_threshold=5)
plt.tight_layout()
plt.xticks(fontsize=15)
plt.title('谱系图', fontsize=15)Text(0.5, 1.0, '谱系图')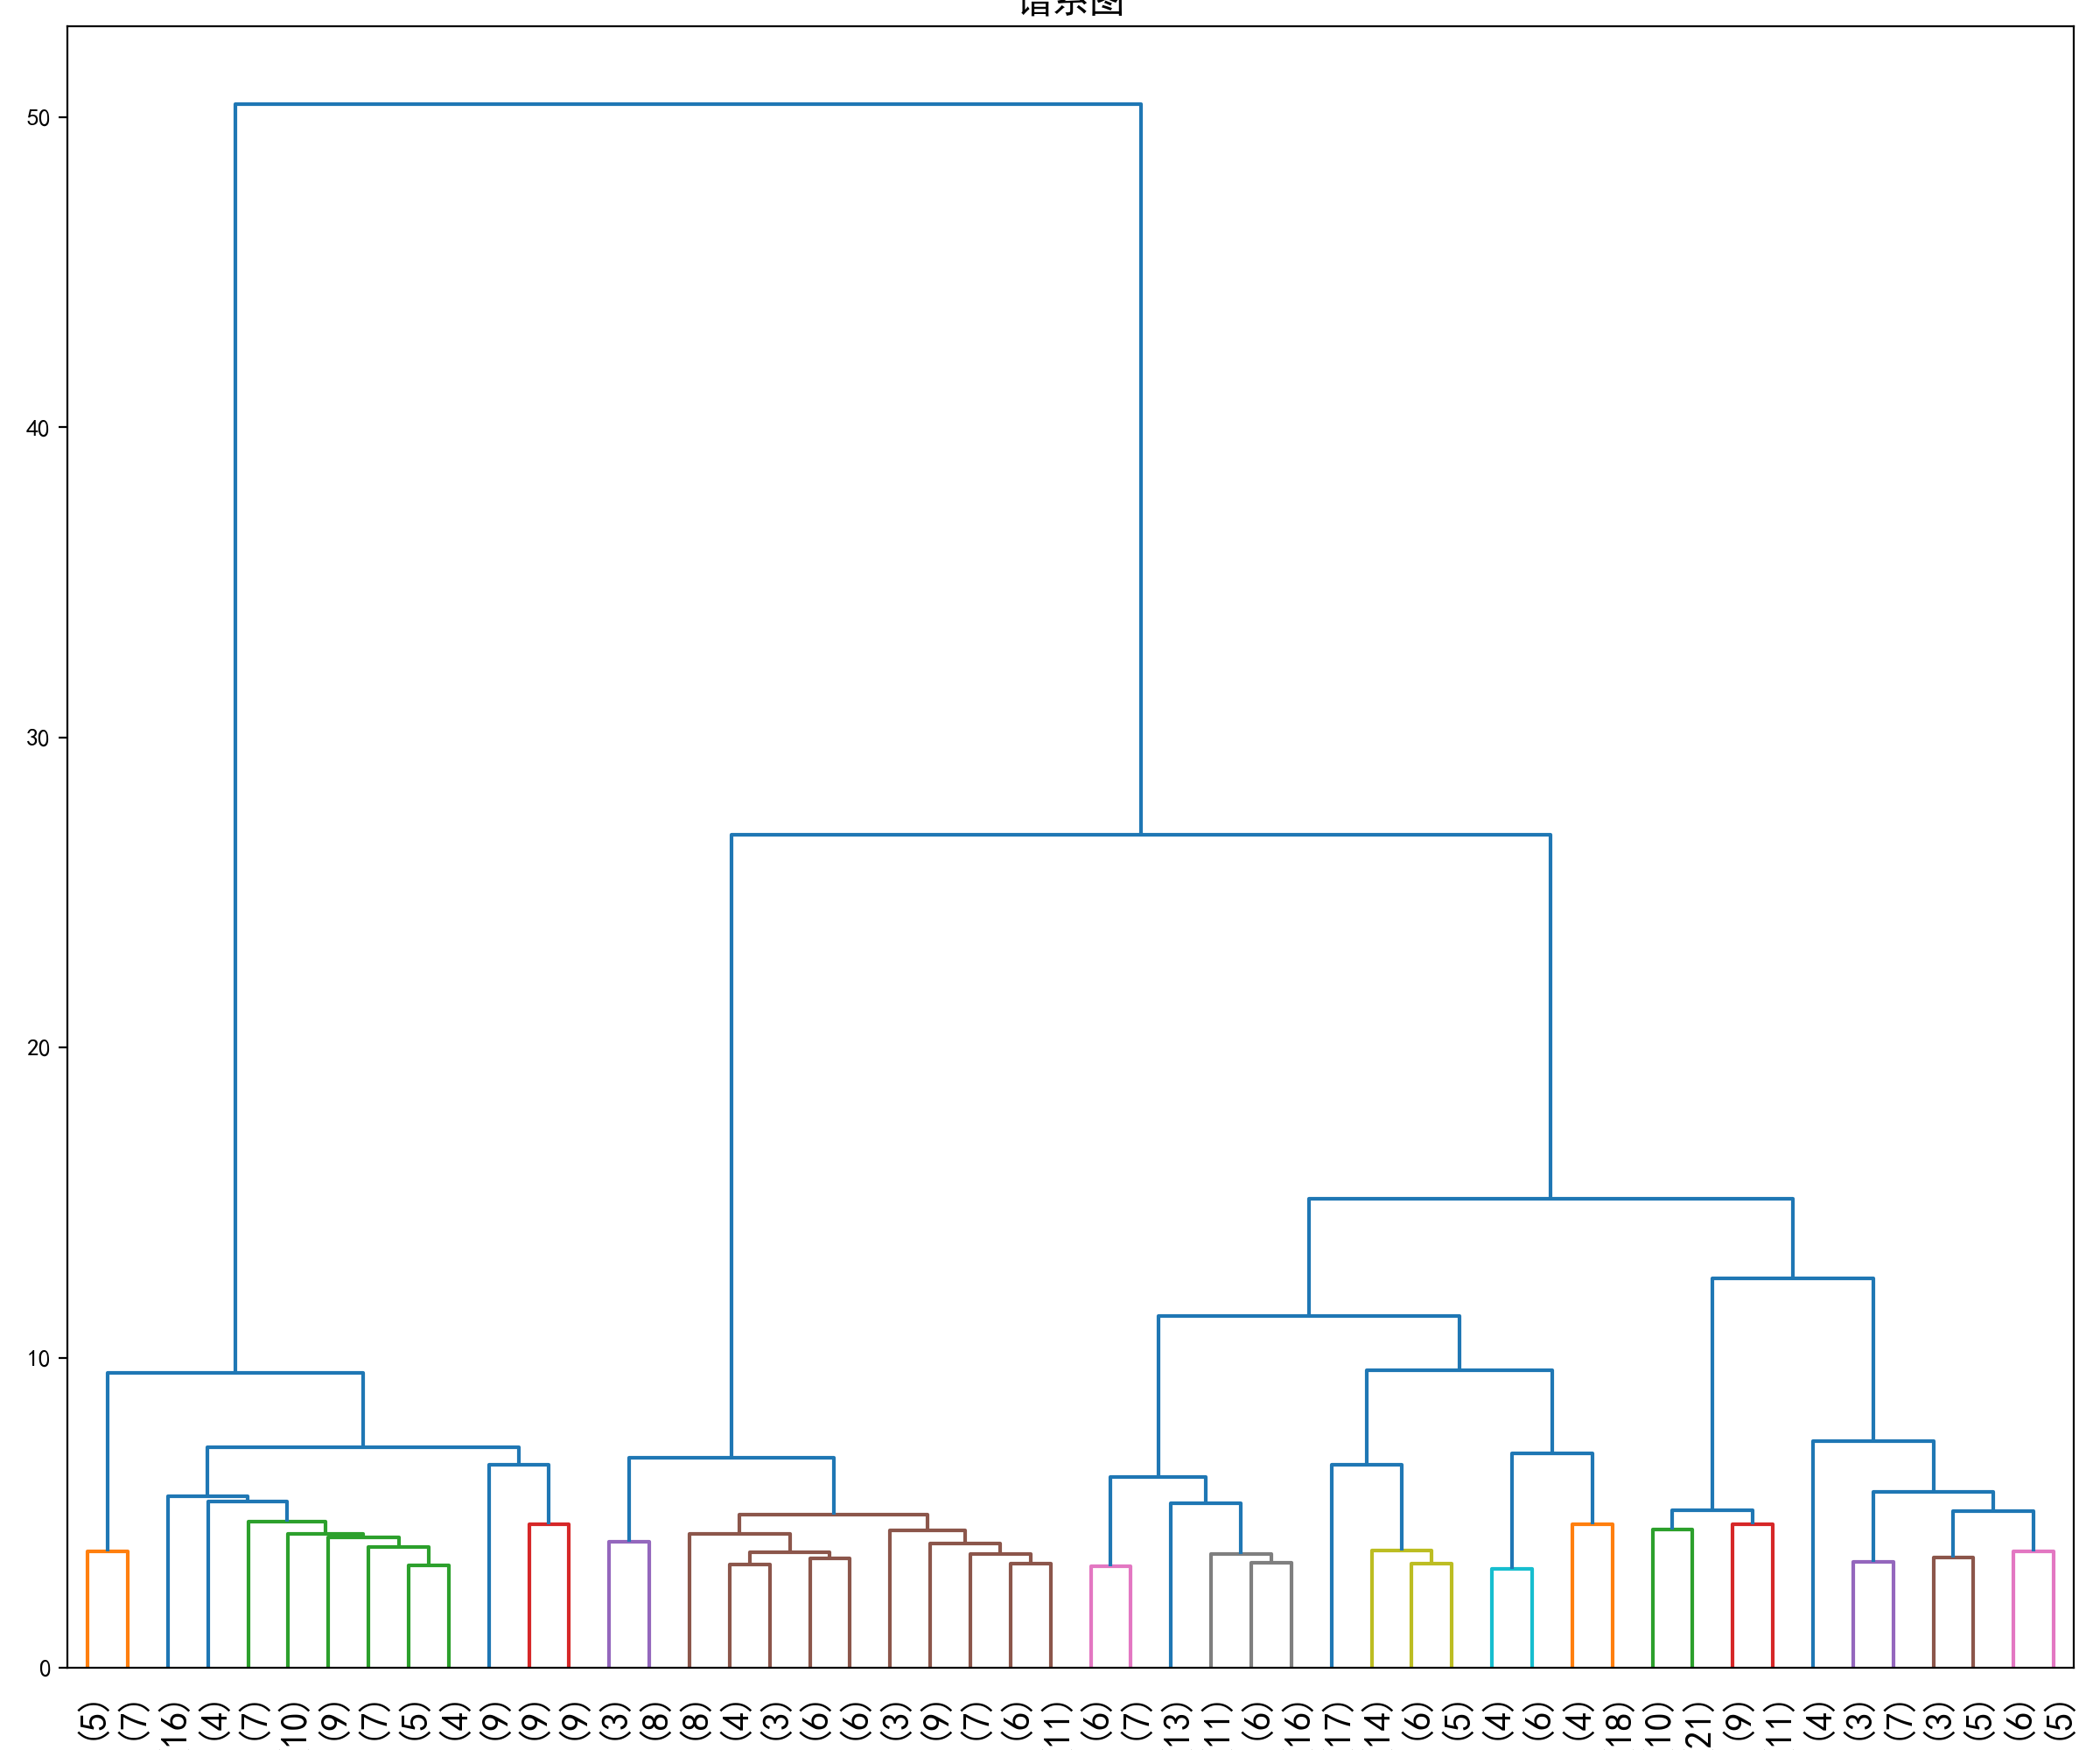
DBSCAN模型搭建与评估
python
from sklearn.cluster import DBSCAN
python
model = DBSCAN(eps=1.5,min_samples=4).fit(auto_scaled)
python
#绘制不同簇的样本数柱状图
auto_label = model.labels_
auto_label_dataframe = pd.DataFrame({'clusters':auto_label})
auto_label_dataframe['clusters'] = auto_label_dataframe['clusters'].astype('category')
ggplot(auto_label_dataframe,aes('clusters',fill='clusters')) + geom_bar()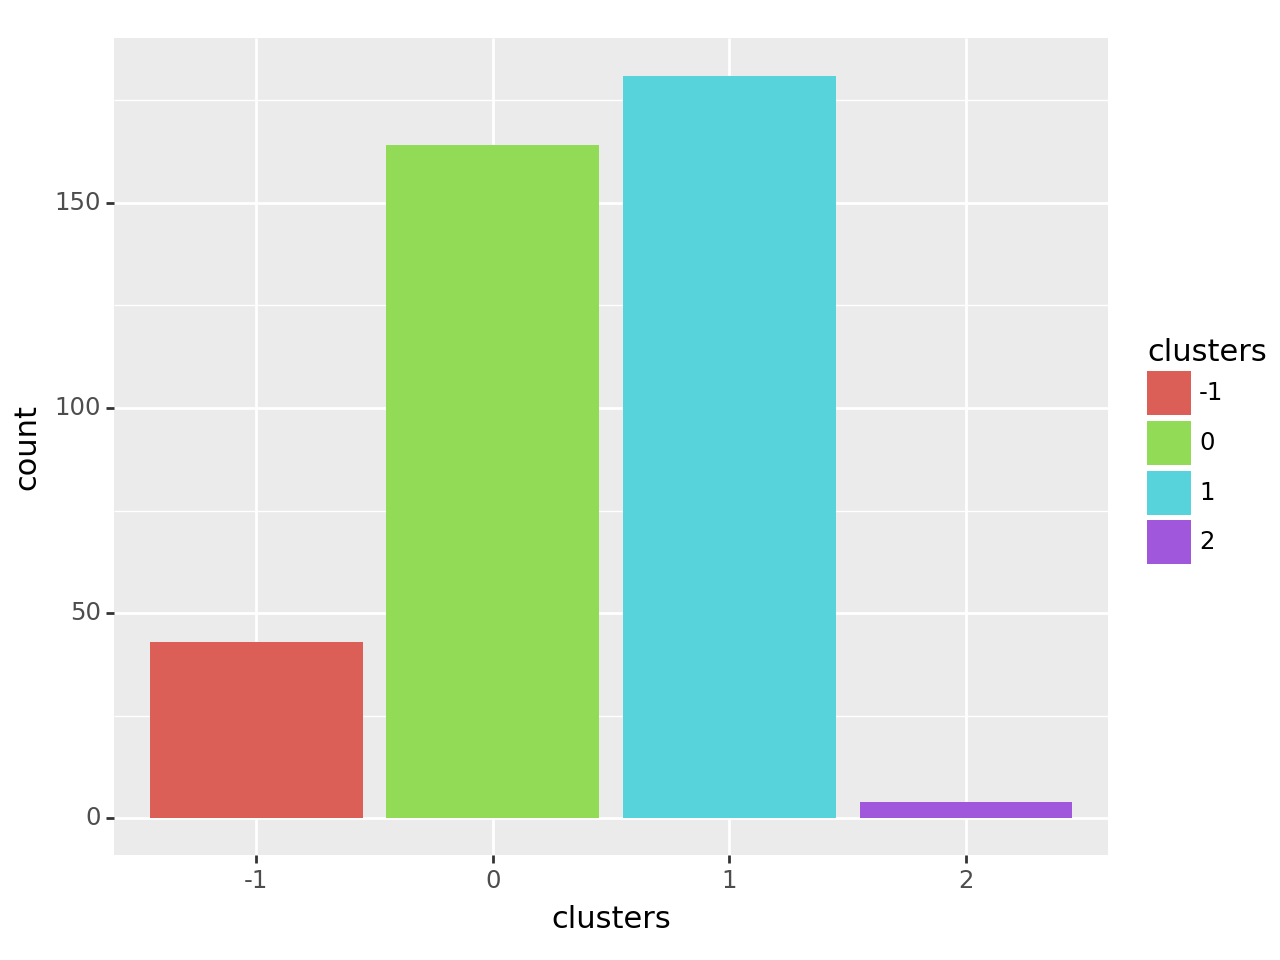
python
# 样本的类别标签
labels = model.labels_

# 标签中的簇数,忽略噪声点
n_clusters_ = len(set(labels)) - (1 if -1 in labels else 0)

print('簇数: %d' % n_clusters_)
print("轮廓系数(Silhouette Coefficient): %0.4f"
% metrics.silhouette_score(auto_scaled, labels))簇数: 3
轮廓系数(Silhouette Coefficient): 0.1476
python
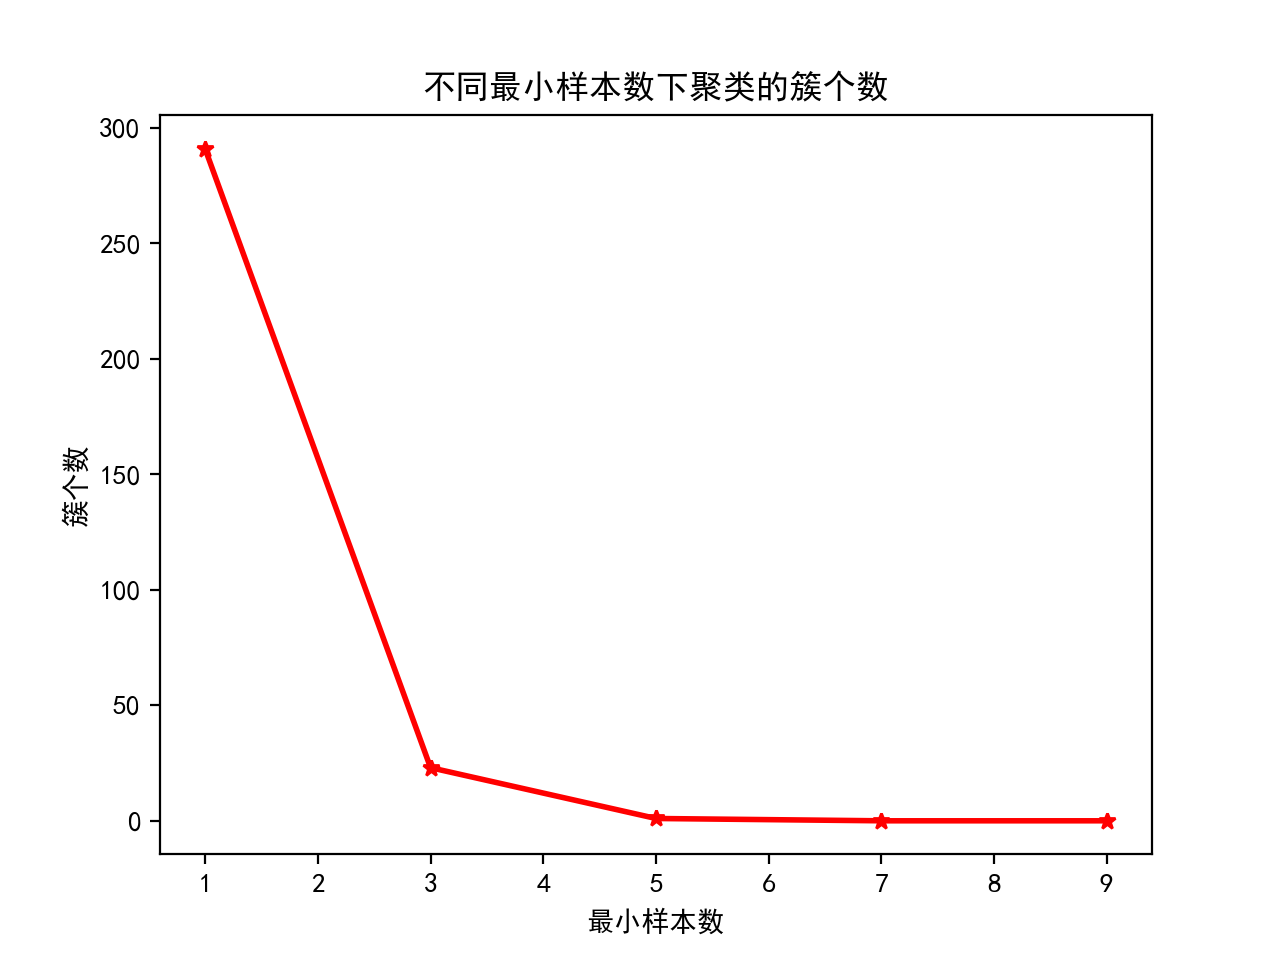
# 不同最小样本数下的簇个数
## 设置参数取值范围
min_samples_grid = [1, 3, 5, 7, 9]

## 训练模型并输出簇个数
cluster_number = []
slt_score = []

for item in min_samples_grid:
    model = DBSCAN(min_samples=item).fit(auto_scaled)
    cluster_number.append(len(np.unique(model.labels_))-1)

## 绘图
plt.plot(min_samples_grid, cluster_number, 'r-*', linewidth=2)
plt.xlabel('最小样本数')
plt.ylabel('簇个数')
plt.title('不同最小样本数下聚类的簇个数')Text(0.5, 1.0, '不同最小样本数下聚类的簇个数')