单头 Self-Attention
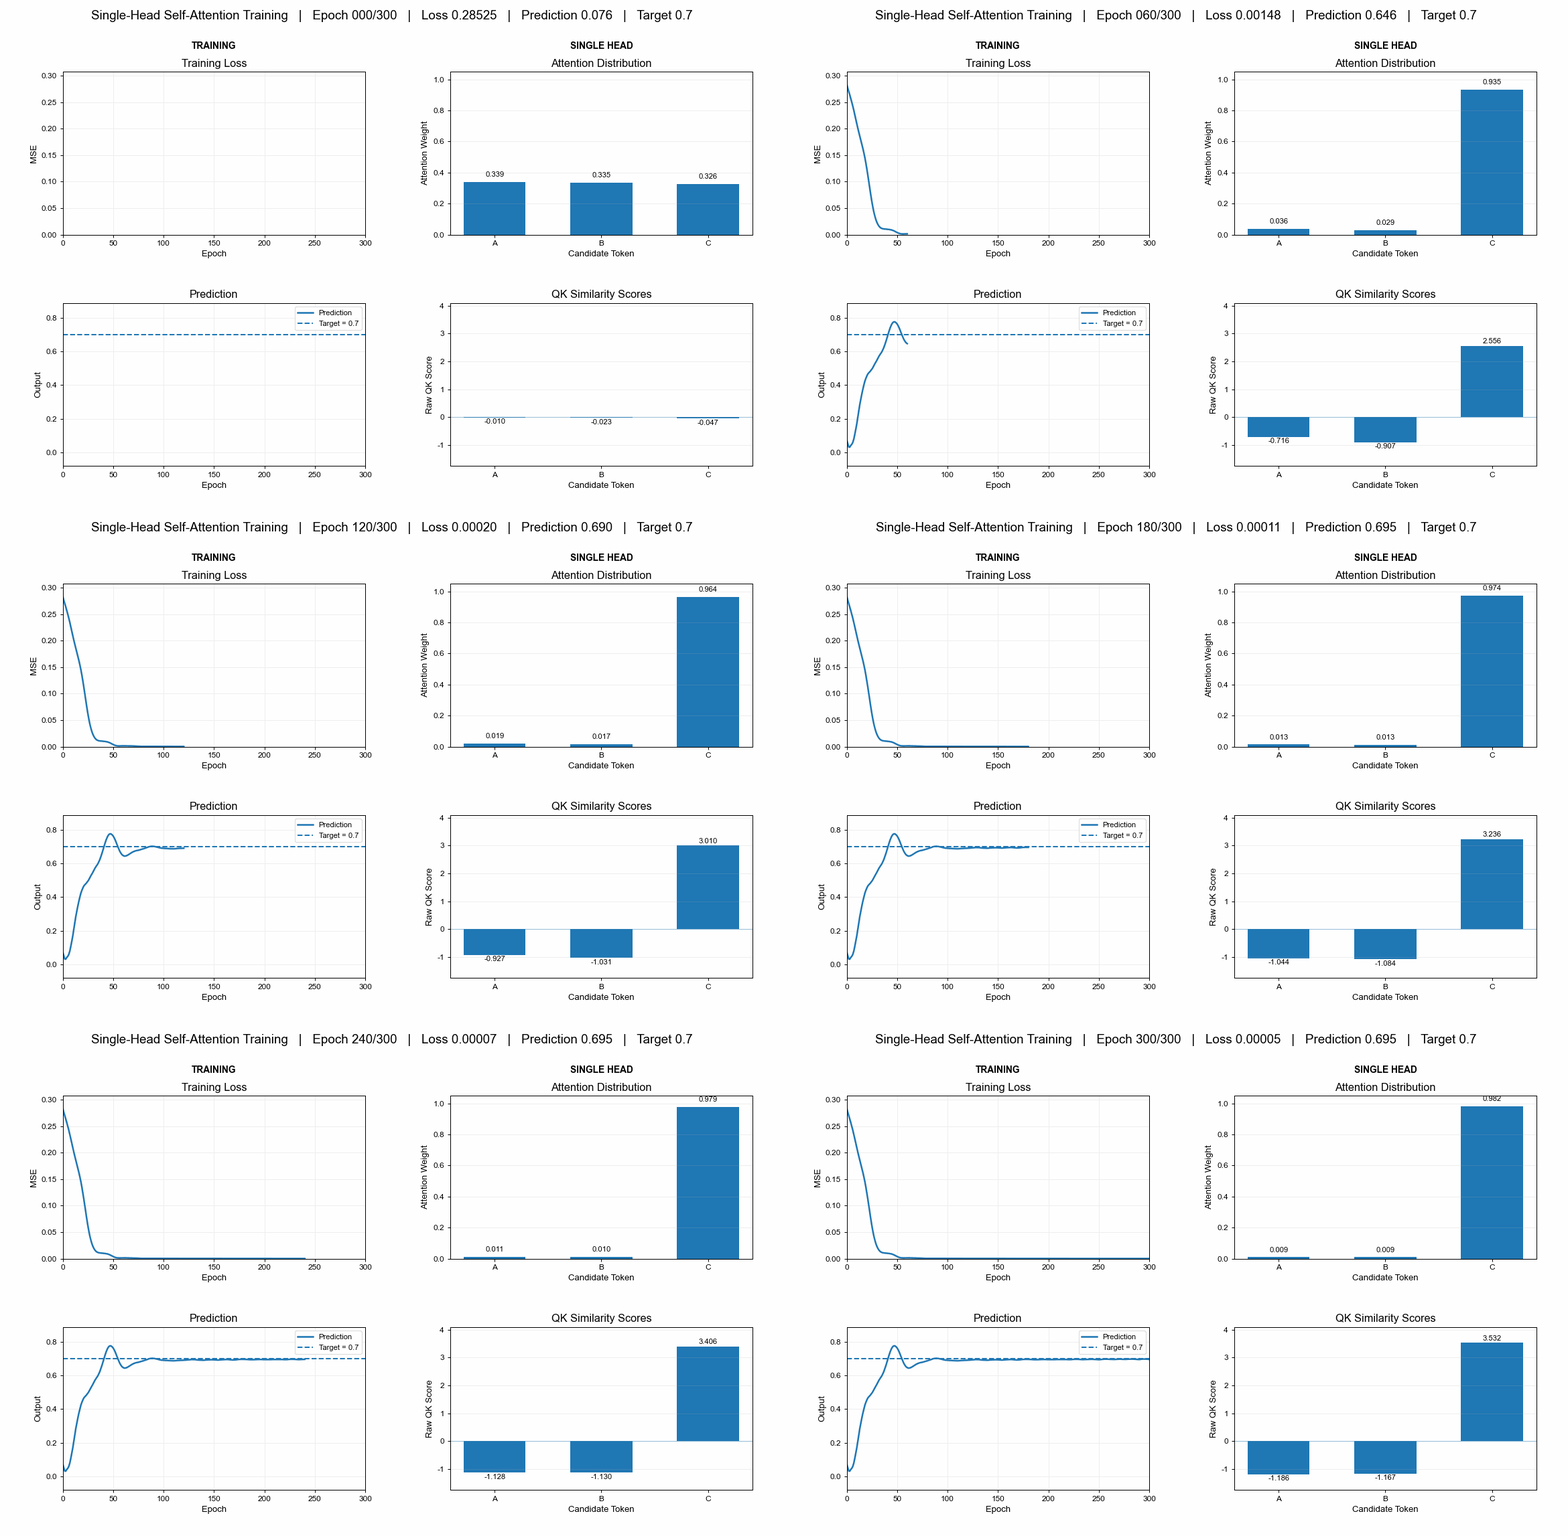
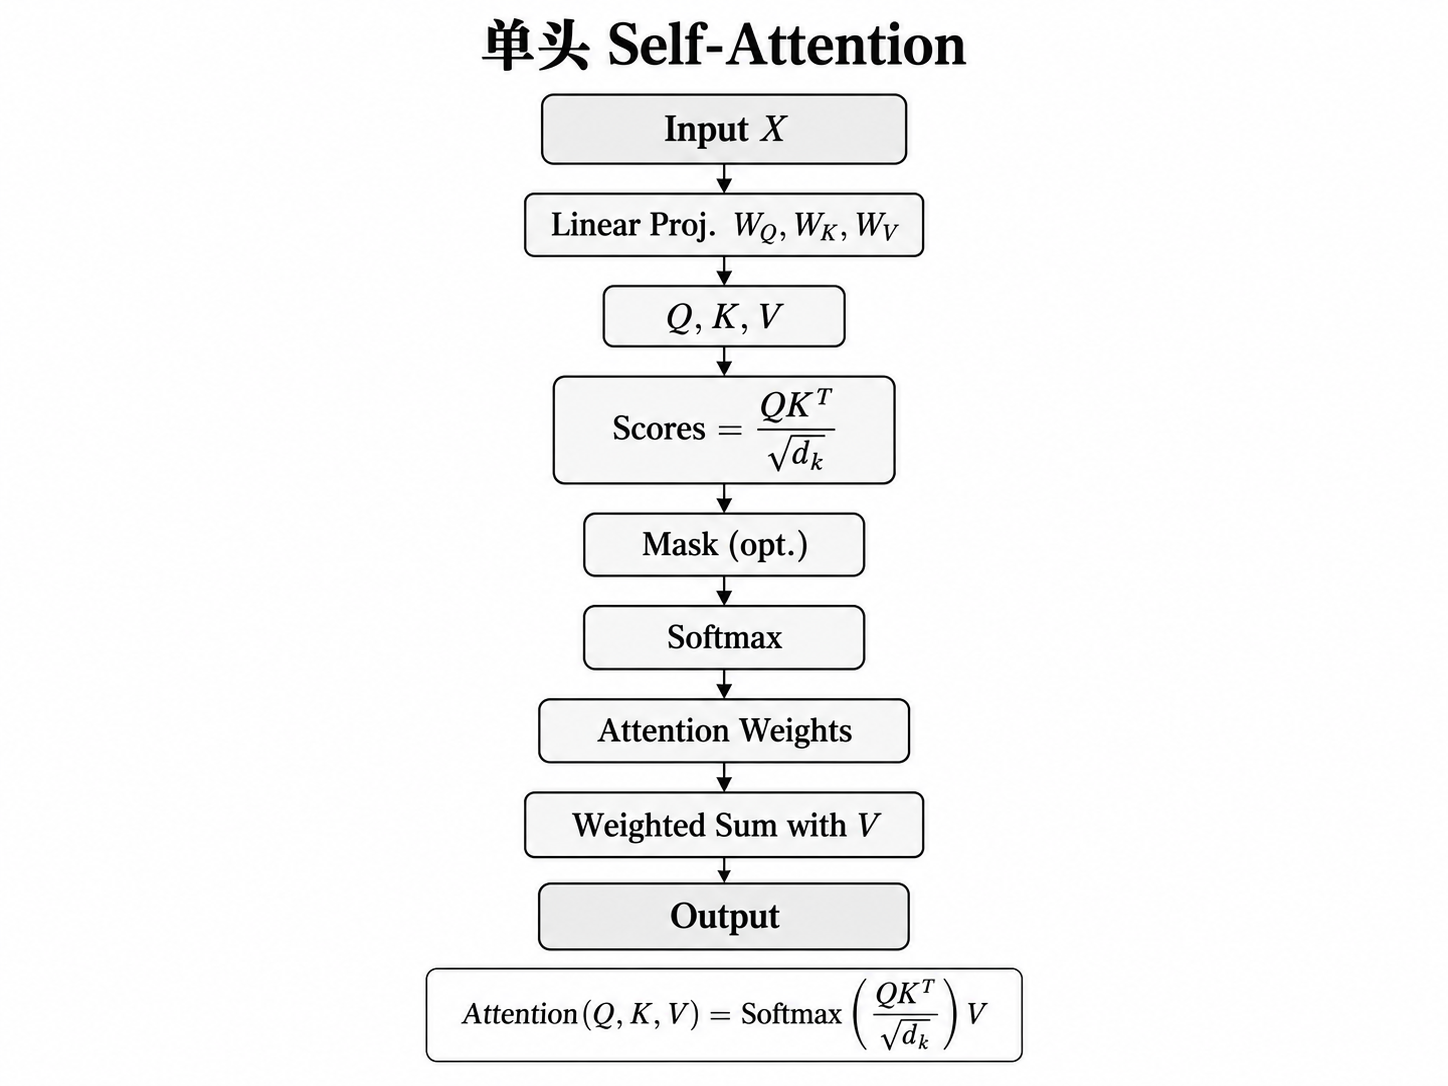
单头自注意力首先将输入特征 XX 通过线性映射得到 QQ、KK 和 VV,随后利用缩放点积计算注意力权重,并对 VV 进行加权聚合,从而获得包含上下文关系的特征表示。
单头可视化运行GIF
单头框架图
Self-Attention Code
python
import math

import torch
import torch.nn as nn
import matplotlib.pyplot as plt
from matplotlib.widgets import Slider, Button


# =========================
# 配置
# =========================
torch.manual_seed(1)

EPOCHS = 300
BATCH_SIZE = 512
LR = 0.03

D_MODEL = 4
D_K = 3

plt.rcParams["font.sans-serif"] = [
    "PingFang SC",
    "Arial",
    "DejaVu Sans"
]
plt.rcParams["axes.unicode_minus"] = False

plt.rcParams.update({
    "font.size": 11,
    "axes.titlesize": 13,
    "axes.labelsize": 10.5,
    "xtick.labelsize": 9.5,
    "ytick.labelsize": 9.5,
    "legend.fontsize": 9
})


# =========================
# 数据
# =========================
# token = [is_A, is_B, is_C, value]
def make_batch(batch_size=BATCH_SIZE):
    X = torch.zeros(batch_size, 4, D_MODEL)
    values = torch.rand(batch_size, 3) * 2 - 1

    X[:, 1, 0] = 1
    X[:, 1, 3] = values[:, 0]

    X[:, 2, 1] = 1
    X[:, 2, 3] = values[:, 1]

    X[:, 3, 2] = 1
    X[:, 3, 3] = values[:, 2]

    wanted = torch.randint(
        0,
        3,
        (batch_size,)
    )

    X[
        torch.arange(batch_size),
        0,
        wanted
    ] = 1

    y = values[
        torch.arange(batch_size),
        wanted
    ].unsqueeze(1)

    return X, y


# 固定观察样本:Query要C
demo_X = torch.tensor([[
    [0., 0., 1., 0.],
    [1., 0., 0., -0.8],
    [0., 1., 0.,  0.4],
    [0., 0., 1.,  0.7]
]])

TARGET = 0.7


# =========================
# Single-Head Attention
# =========================
class SingleHeadAttention(nn.Module):

    def __init__(self):
        super().__init__()

        self.Wq = nn.Linear(
            D_MODEL,
            D_K,
            bias=False
        )

        self.Wk = nn.Linear(
            D_MODEL,
            D_K,
            bias=False
        )

        self.Wv = nn.Linear(
            D_MODEL,
            1,
            bias=False
        )

    def forward(self, X):

        q = self.Wq(
            X[:, 0:1, :]
        )

        K = self.Wk(X)
        V = self.Wv(X)

        scores = (
            q @ K.transpose(-2, -1)
        ) / math.sqrt(D_K)

        mask = torch.zeros_like(
            scores,
            dtype=torch.bool
        )

        mask[:, :, 0] = True

        scores = scores.masked_fill(
            mask,
            -1e9
        )

        attention = torch.softmax(
            scores,
            dim=-1
        )

        output = attention @ V

        return (
            output.squeeze(1),
            scores.squeeze(1),
            attention.squeeze(1)
        )


# =========================
# 模型
# =========================
model = SingleHeadAttention()

loss_fn = nn.MSELoss()

optimizer = torch.optim.Adam(
    model.parameters(),
    lr=LR
)

monitor_X, monitor_y = make_batch(
    2048
)


# =========================
# 训练记录
# =========================
loss_history = []
pred_history = []
attention_history = []
score_history = []


def record_state():

    model.eval()

    with torch.no_grad():

        monitor_pred, _, _ = model(
            monitor_X
        )

        monitor_loss = loss_fn(
            monitor_pred,
            monitor_y
        )

        (
            demo_pred,
            demo_scores,
            demo_attention
        ) = model(demo_X)

    loss_history.append(
        monitor_loss.item()
    )

    pred_history.append(
        demo_pred.item()
    )

    attention_history.append([
        demo_attention[0, 1].item(),
        demo_attention[0, 2].item(),
        demo_attention[0, 3].item()
    ])

    score_history.append([
        demo_scores[0, 1].item(),
        demo_scores[0, 2].item(),
        demo_scores[0, 3].item()
    ])


# Epoch 0
record_state()


# =========================
# 训练
# =========================
for epoch in range(1, EPOCHS + 1):

    model.train()

    X, y = make_batch()

    pred, _, _ = model(X)

    loss = loss_fn(
        pred,
        y
    )

    optimizer.zero_grad()
    loss.backward()
    optimizer.step()

    record_state()


# =========================
# 输出结果
# =========================
print("\n========== Before Training ==========")

print(
    "Prediction =",
    round(pred_history[0], 4)
)

print(
    "Attention(A,B,C) =",
    [
        round(v, 4)
        for v in attention_history[0]
    ]
)


print("\n========== After Training ==========")

print(
    "Target =",
    TARGET
)

print(
    "Prediction =",
    round(pred_history[-1], 4)
)

print(
    "Attention(A,B,C) =",
    [
        round(v, 4)
        for v in attention_history[-1]
    ]
)

print("\nFinal WQ:")
print(model.Wq.weight.data)

print("\nFinal WK:")
print(model.Wk.weight.data)

print("\nFinal WV:")
print(model.Wv.weight.data)


# =========================
# 图形范围
# =========================
all_scores = [
    v
    for row in score_history
    for v in row
]

score_min = min(all_scores)
score_max = max(all_scores)

score_margin = max(
    0.5,
    (score_max - score_min) * 0.12
)


all_preds = (
    pred_history
    + [TARGET]
)

pred_min = min(all_preds)
pred_max = max(all_preds)

pred_margin = max(
    0.1,
    (pred_max - pred_min) * 0.15
)


# =========================
# Dashboard
# =========================
fig = plt.figure(
    figsize=(13, 8.5)
)

gs = fig.add_gridspec(
    2,
    2,
    left=0.08,
    right=0.96,
    top=0.86,
    bottom=0.22,
    wspace=0.28,
    hspace=0.42
)

# 第一列
ax_loss = fig.add_subplot(
    gs[0, 0]
)

ax_pred = fig.add_subplot(
    gs[1, 0]
)

# 第二列
ax_attn = fig.add_subplot(
    gs[0, 1]
)

ax_score = fig.add_subplot(
    gs[1, 1]
)


# =========================
# 列标题
# =========================
for ax, title in [
    (ax_loss, "TRAINING"),
    (ax_attn, "SINGLE HEAD")
]:

    pos = ax.get_position()

    fig.text(
        (pos.x0 + pos.x1) / 2,
        0.905,
        title,
        ha="center",
        fontsize=11,
        fontweight="bold"
    )


# =========================
# Loss
# =========================
loss_line, = ax_loss.plot(
    [],
    [],
    linewidth=2
)

ax_loss.set_xlim(
    0,
    EPOCHS
)

ax_loss.set_ylim(
    0,
    max(loss_history) * 1.08
)

ax_loss.set_title(
    "Training Loss"
)

ax_loss.set_xlabel(
    "Epoch"
)

ax_loss.set_ylabel(
    "MSE"
)

ax_loss.grid(
    alpha=0.2
)


# =========================
# Prediction
# =========================
pred_line, = ax_pred.plot(
    [],
    [],
    linewidth=2,
    label="Prediction"
)

ax_pred.axhline(
    TARGET,
    linestyle="--",
    linewidth=1.6,
    label="Target = 0.7"
)

ax_pred.set_xlim(
    0,
    EPOCHS
)

ax_pred.set_ylim(
    pred_min - pred_margin,
    pred_max + pred_margin
)

ax_pred.set_title(
    "Prediction"
)

ax_pred.set_xlabel(
    "Epoch"
)

ax_pred.set_ylabel(
    "Output"
)

ax_pred.legend()

ax_pred.grid(
    alpha=0.2
)


# =========================
# Attention
# =========================
attn_bars = ax_attn.bar(
    ["A", "B", "C"],
    [0, 0, 0],
    width=0.58
)

ax_attn.set_ylim(
    0,
    1.05
)

ax_attn.set_title(
    "Attention Distribution"
)

ax_attn.set_xlabel(
    "Candidate Token"
)

ax_attn.set_ylabel(
    "Attention Weight"
)

ax_attn.tick_params(
    axis="x",
    labelrotation=0
)

ax_attn.grid(
    axis="y",
    alpha=0.2
)

attn_texts = [
    ax_attn.text(
        i,
        0.02,
        "0.000",
        ha="center",
        va="bottom",
        fontsize=9
    )
    for i in range(3)
]


# =========================
# QK Score
# =========================
score_bars = ax_score.bar(
    ["A", "B", "C"],
    [0, 0, 0],
    width=0.58
)

ax_score.set_ylim(
    score_min - score_margin,
    score_max + score_margin
)

ax_score.set_title(
    "QK Similarity Scores"
)

ax_score.set_xlabel(
    "Candidate Token"
)

ax_score.set_ylabel(
    "Raw QK Score"
)

ax_score.tick_params(
    axis="x",
    labelrotation=0
)

ax_score.axhline(
    0,
    linewidth=0.8,
    alpha=0.4
)

ax_score.grid(
    axis="y",
    alpha=0.2
)

score_texts = [
    ax_score.text(
        i,
        0,
        "0.000",
        ha="center",
        fontsize=9
    )
    for i in range(3)
]


# =========================
# Slider
# =========================
ax_slider = fig.add_axes(
    [0.15, 0.13, 0.70, 0.03]
)

slider = Slider(
    ax=ax_slider,
    label="Epoch",
    valmin=0,
    valmax=EPOCHS,
    valinit=0,
    valstep=1
)


# =========================
# Buttons
# =========================
button_y = 0.05
button_h = 0.045
button_w = 0.09
gap = 0.014
start_x = 0.25

ax_play = fig.add_axes([
    start_x,
    button_y,
    button_w,
    button_h
])

ax_pause = fig.add_axes([
    start_x + button_w + gap,
    button_y,
    button_w,
    button_h
])

ax_step = fig.add_axes([
    start_x + 2 * (button_w + gap),
    button_y,
    button_w,
    button_h
])

ax_reset = fig.add_axes([
    start_x + 3 * (button_w + gap),
    button_y,
    button_w,
    button_h
])

ax_repeat = fig.add_axes([
    start_x + 4 * (button_w + gap),
    button_y,
    button_w + 0.035,
    button_h
])

btn_play = Button(
    ax_play,
    "Play",
    hovercolor="0.92"
)

btn_pause = Button(
    ax_pause,
    "Pause",
    hovercolor="0.92"
)

btn_step = Button(
    ax_step,
    "Step >",
    hovercolor="0.92"
)

btn_reset = Button(
    ax_reset,
    "Reset",
    hovercolor="0.92"
)

btn_repeat = Button(
    ax_repeat,
    "Repeat: ON",
    hovercolor="0.92"
)


# =========================
# 播放状态
# =========================
state = {
    "frame": 0,
    "playing": False,
    "repeat": True
}

timer = fig.canvas.new_timer(
    interval=70
)


# =========================
# 更新
# =========================
def update_bars(
    bars,
    texts,
    values,
    offset
):

    for bar, text, value in zip(
        bars,
        texts,
        values
    ):

        bar.set_height(
            value
        )

        text.set_text(
            f"{value:.3f}"
        )

        if value >= 0:

            text.set_y(
                value + offset
            )

            text.set_va(
                "bottom"
            )

        else:

            text.set_y(
                value - offset
            )

            text.set_va(
                "top"
            )


def draw_frame(frame):

    frame = max(
        0,
        min(
            EPOCHS,
            int(frame)
        )
    )

    state["frame"] = frame

    x = list(
        range(frame + 1)
    )

    loss_line.set_data(
        x,
        loss_history[:frame + 1]
    )

    pred_line.set_data(
        x,
        pred_history[:frame + 1]
    )

    update_bars(
        attn_bars,
        attn_texts,
        attention_history[frame],
        0.025
    )

    update_bars(
        score_bars,
        score_texts,
        score_history[frame],
        score_margin * 0.06
    )

    fig.suptitle(
        f"Single-Head Self-Attention Training"
        f"   |   Epoch {frame:03d}/{EPOCHS}"
        f"   |   Loss {loss_history[frame]:.5f}"
        f"   |   Prediction {pred_history[frame]:.3f}"
        f"   |   Target {TARGET:.1f}",
        fontsize=15,
        fontweight="medium"
    )

    fig.canvas.draw_idle()


# =========================
# 播放控制
# =========================
def next_frame():

    frame = (
        state["frame"] + 1
    )

    if frame > EPOCHS:

        if state["repeat"]:
            frame = 0

        else:
            state["playing"] = False
            timer.stop()
            return

    slider.set_val(
        frame
    )


def timer_callback():

    if state["playing"]:
        next_frame()


timer.add_callback(
    timer_callback
)


def play_clicked(event):

    if not state["playing"]:
        state["playing"] = True
        timer.start()


def pause_clicked(event):

    state["playing"] = False
    timer.stop()


def step_clicked(event):

    state["playing"] = False
    timer.stop()
    next_frame()


def reset_clicked(event):

    state["playing"] = False
    timer.stop()
    slider.set_val(0)


def repeat_clicked(event):

    state["repeat"] = (
        not state["repeat"]
    )

    btn_repeat.label.set_text(
        "Repeat: ON"
        if state["repeat"]
        else "Repeat: OFF"
    )

    fig.canvas.draw_idle()


slider.on_changed(
    lambda value:
    draw_frame(value)
)

btn_play.on_clicked(
    play_clicked
)

btn_pause.on_clicked(
    pause_clicked
)

btn_step.on_clicked(
    step_clicked
)

btn_reset.on_clicked(
    reset_clicked
)

btn_repeat.on_clicked(
    repeat_clicked
)


# =========================
# 键盘
# =========================
def keyboard(event):

    if event.key == " ":

        if state["playing"]:
            pause_clicked(None)

        else:
            play_clicked(None)

    elif event.key == "right":

        step_clicked(None)

    elif event.key == "left":

        state["playing"] = False
        timer.stop()

        slider.set_val(
            max(
                0,
                state["frame"] - 1
            )
        )

    elif event.key == "r":

        reset_clicked(None)


fig.canvas.mpl_connect(
    "key_press_event",
    keyboard
)


# =========================
# 启动
# =========================
draw_frame(0)

plt.show()
多头 Multi-Head Attention
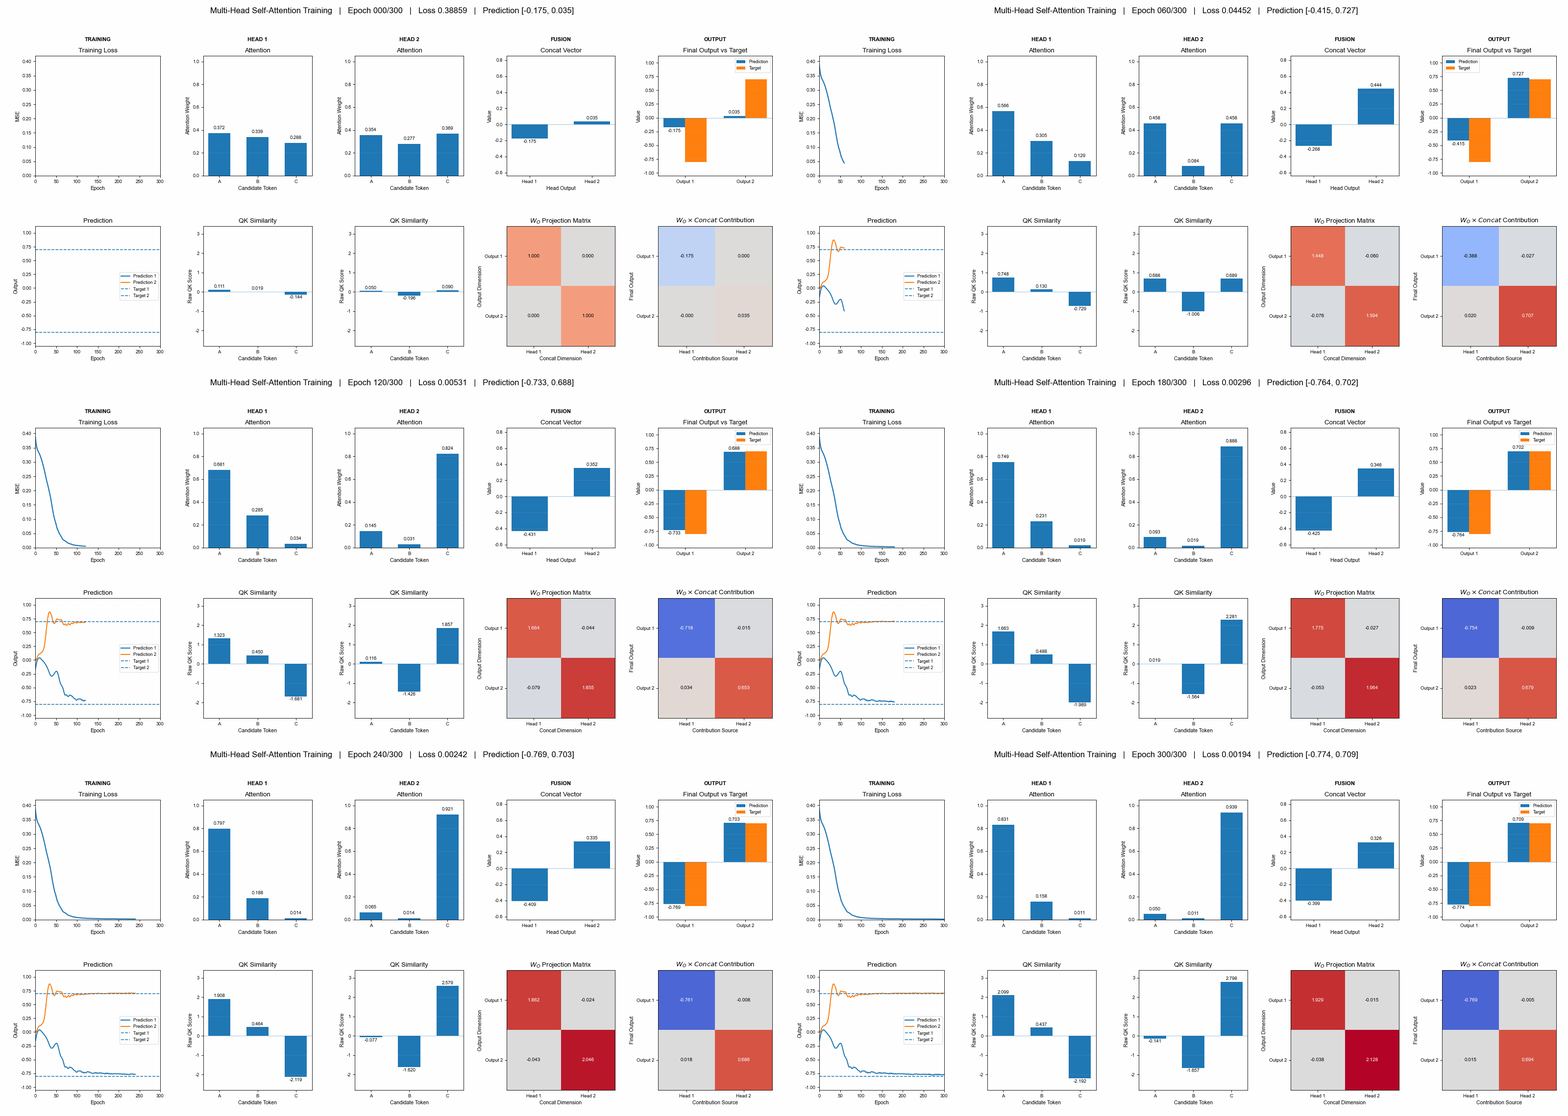
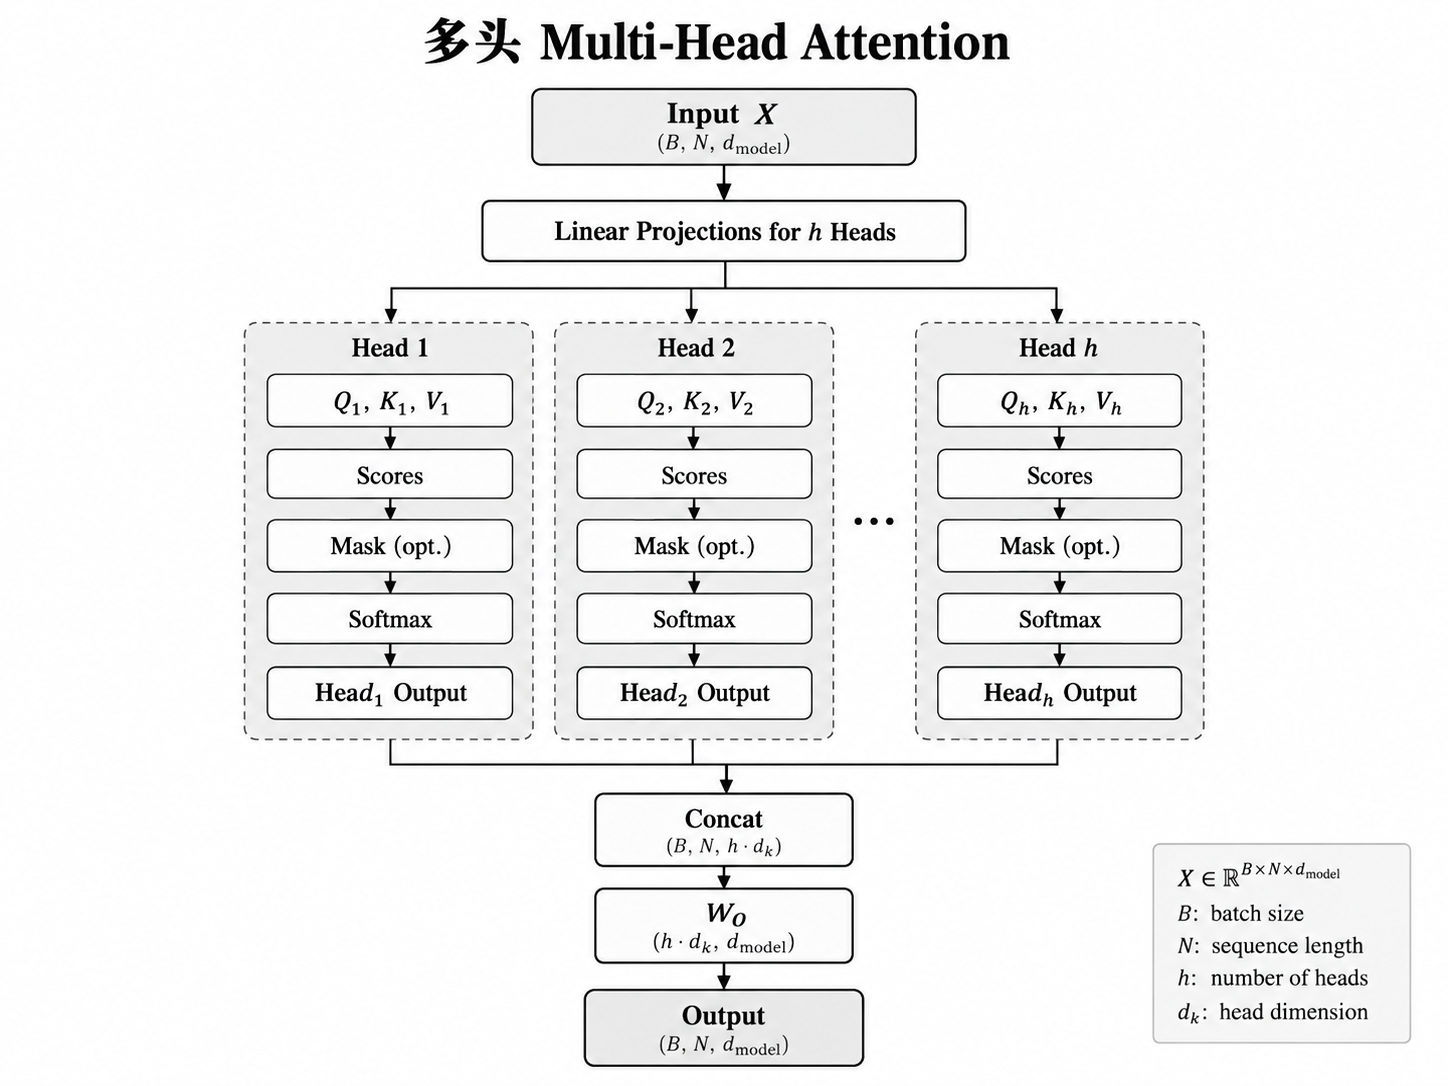
多头注意力将输入映射到多个独立的注意力子空间,各 Head 分别学习不同的特征关联;随后将各 Head 输出进行拼接,并通过输出投影矩阵 WOW_O 完成特征融合,从而增强模型对多种关联模式的建模能力。
多头可视化运行GIF

多头框架图
Multi-Head Attention Code
python
import math
import torch
import torch.nn as nn
import matplotlib.pyplot as plt
from matplotlib.widgets import Slider, Button
# =========================
# 配置
# =========================
torch.manual_seed(7)
EPOCHS = 300
BATCH_SIZE = 1024
LR = 0.02
D_MODEL = 7
N_HEADS = 2
D_K = 4
D_V = 1
plt.rcParams["font.sans-serif"] = [
"PingFang SC",
"Arial",
"DejaVu Sans"
]
plt.rcParams["axes.unicode_minus"] = False
plt.rcParams.update({
"font.size": 9.5,
"axes.titlesize": 12,
"axes.labelsize": 9.5,
"xtick.labelsize": 8.5,
"ytick.labelsize": 8.5,
"legend.fontsize": 8
})
# =========================
# 数据
# =========================
# [Target1_A/B/C, Target2_A/B/C, value]
def make_batch(batch_size=BATCH_SIZE):
X = torch.zeros(batch_size, 4, D_MODEL)
values = torch.rand(batch_size, 3) * 2 - 1
for i in range(3):
X[:, i + 1, i] = 1
X[:, i + 1, i + 3] = 1
X[:, i + 1, 6] = values[:, i]
target1 = torch.randint(0, 3, (batch_size,))
offset = torch.randint(1, 3, (batch_size,))
target2 = (target1 + offset) % 3
X[torch.arange(batch_size), 0, target1] = 1
X[torch.arange(batch_size), 0, target2 + 3] = 1
y1 = values[torch.arange(batch_size), target1]
y2 = values[torch.arange(batch_size), target2]
y = torch.stack([y1, y2], dim=1)
return X, y
# 固定演示:Target1=A,Target2=C
demo_X = torch.tensor([[
[1., 0., 0., 0., 0., 1., 0.],
[1., 0., 0., 1., 0., 0., -0.8],
[0., 1., 0., 0., 1., 0., 0.4],
[0., 0., 1., 0., 0., 1., 0.7]
]])
TARGET = torch.tensor([-0.8, 0.7])
# =========================
# Multi-Head Attention
# =========================
class TinyMultiHeadAttention(nn.Module):
def __init__(self):
super().__init__()
self.Wq = nn.ModuleList([
nn.Linear(D_MODEL, D_K, bias=False)
for _ in range(N_HEADS)
])
self.Wk = nn.ModuleList([
nn.Linear(D_MODEL, D_K, bias=False)
for _ in range(N_HEADS)
])
self.Wv = nn.ModuleList([
nn.Linear(D_MODEL, D_V, bias=False)
for _ in range(N_HEADS)
])
self.Wo = nn.Linear(
N_HEADS * D_V,
2,
bias=False
)
with torch.no_grad():
self.Wo.weight.copy_(torch.eye(2))
def forward(self, X):
head_outputs = []
score_list = []
attention_list = []
for h in range(N_HEADS):
q = self.Wq[h](X[:, 0:1, :])
K = self.Wk[h](X)
V = self.Wv[h](X)
scores = (
q @ K.transpose(-2, -1)
) / math.sqrt(D_K)
# Query不关注自己
mask = torch.zeros_like(
scores,
dtype=torch.bool
)
mask[:, :, 0] = True
scores = scores.masked_fill(
mask,
-1e9
)
attention = torch.softmax(
scores,
dim=-1
)
head_output = (
attention @ V
).squeeze(1)
head_outputs.append(head_output)
score_list.append(scores.squeeze(1))
attention_list.append(attention.squeeze(1))
concat = torch.cat(
head_outputs,
dim=1
)
prediction = self.Wo(concat)
return (
prediction,
score_list,
attention_list,
concat
)
# =========================
# 模型
# =========================
model = TinyMultiHeadAttention()
loss_fn = nn.MSELoss()
optimizer = torch.optim.Adam(
model.parameters(),
lr=LR
)
monitor_X, monitor_y = make_batch(4096)
# =========================
# 历史记录
# =========================
loss_history = []
pred1_history = []
pred2_history = []
head1_attn_history = []
head2_attn_history = []
head1_score_history = []
head2_score_history = []
concat_history = []
wo_history = []
contribution_history = []
def record_state():
model.eval()
with torch.no_grad():
monitor_pred, _, _, _ = model(
monitor_X
)
monitor_loss = loss_fn(
monitor_pred,
monitor_y
)
(
demo_pred,
demo_scores,
demo_attn,
demo_concat
) = model(demo_X)
wo = model.Wo.weight.detach().clone()
# Output_i中每个Head的贡献
contribution = (
wo * demo_concat[0].unsqueeze(0)
)
loss_history.append(
monitor_loss.item()
)
pred1_history.append(
demo_pred[0, 0].item()
)
pred2_history.append(
demo_pred[0, 1].item()
)
head1_attn_history.append([
demo_attn[0][0, 1].item(),
demo_attn[0][0, 2].item(),
demo_attn[0][0, 3].item()
])
head2_attn_history.append([
demo_attn[1][0, 1].item(),
demo_attn[1][0, 2].item(),
demo_attn[1][0, 3].item()
])
head1_score_history.append([
demo_scores[0][0, 1].item(),
demo_scores[0][0, 2].item(),
demo_scores[0][0, 3].item()
])
head2_score_history.append([
demo_scores[1][0, 1].item(),
demo_scores[1][0, 2].item(),
demo_scores[1][0, 3].item()
])
concat_history.append(
demo_concat[0].tolist()
)
wo_history.append(
wo.tolist()
)
contribution_history.append(
contribution.tolist()
)
# Epoch 0
record_state()
# =========================
# 训练
# =========================
for epoch in range(1, EPOCHS + 1):
model.train()
X, y = make_batch()
pred, _, _, _ = model(X)
loss = loss_fn(
pred,
y
)
optimizer.zero_grad()
loss.backward()
optimizer.step()
record_state()
# =========================
# 输出结果
# =========================
print("\n========== Before Training ==========")
print(
"Prediction =",
[
round(pred1_history[0], 4),
round(pred2_history[0], 4)
]
)
print(
"Head1 Attention =",
[round(v, 4) for v in head1_attn_history[0]]
)
print(
"Head2 Attention =",
[round(v, 4) for v in head2_attn_history[0]]
)
print(
"Concat =",
[round(v, 4) for v in concat_history[0]]
)
print("\n========== After Training ==========")
print(
"Target =",
TARGET.tolist()
)
print(
"Prediction =",
[
round(pred1_history[-1], 4),
round(pred2_history[-1], 4)
]
)
print(
"Head1 Attention =",
[round(v, 4) for v in head1_attn_history[-1]]
)
print(
"Head2 Attention =",
[round(v, 4) for v in head2_attn_history[-1]]
)
print(
"Concat =",
[round(v, 4) for v in concat_history[-1]]
)
print("\nFinal WO:")
print(model.Wo.weight.data)
# =========================
# 图形范围
# =========================
all_scores = (
[v for row in head1_score_history for v in row]
+
[v for row in head2_score_history for v in row]
)
score_min = min(all_scores)
score_max = max(all_scores)
score_margin = max(
0.5,
(score_max - score_min) * 0.12
)
all_concat = [
v
for row in concat_history
for v in row
]
concat_min = min(all_concat)
concat_max = max(all_concat)
concat_margin = max(
0.2,
(concat_max - concat_min) * 0.15
)
all_preds = (
pred1_history
+ pred2_history
+ TARGET.tolist()
)
pred_min = min(all_preds)
pred_max = max(all_preds)
pred_margin = max(
0.15,
(pred_max - pred_min) * 0.15
)
wo_abs_max = max(
abs(v)
for matrix in wo_history
for row in matrix
for v in row
)
wo_abs_max = max(
wo_abs_max,
0.1
)
contrib_abs_max = max(
abs(v)
for matrix in contribution_history
for row in matrix
for v in row
)
contrib_abs_max = max(
contrib_abs_max,
0.1
)
# ============================================================
# Dashboard
# ============================================================
fig = plt.figure(
figsize=(20, 9.5)
)
gs = fig.add_gridspec(
2,
5,
width_ratios=[
1.15,
1,
1,
1,
1.05
],
left=0.045,
right=0.985,
top=0.85,
bottom=0.19,
wspace=0.38,
hspace=0.42
)
# 第1列:Training
ax_loss = fig.add_subplot(gs[0, 0])
ax_pred = fig.add_subplot(gs[1, 0])
# 第2列:Head 1
ax_h1_attn = fig.add_subplot(gs[0, 1])
ax_h1_score = fig.add_subplot(gs[1, 1])
# 第3列:Head 2
ax_h2_attn = fig.add_subplot(gs[0, 2])
ax_h2_score = fig.add_subplot(gs[1, 2])
# 第4列:Fusion
ax_concat = fig.add_subplot(gs[0, 3])
ax_wo = fig.add_subplot(gs[1, 3])
# 第5列:Output
ax_output = fig.add_subplot(gs[0, 4])
ax_contrib = fig.add_subplot(gs[1, 4])
# =========================
# 列标题
# =========================
column_axes = [
ax_loss,
ax_h1_attn,
ax_h2_attn,
ax_concat,
ax_output
]
column_titles = [
"TRAINING",
"HEAD 1",
"HEAD 2",
"FUSION",
"OUTPUT"
]
for ax, title in zip(
column_axes,
column_titles
):
pos = ax.get_position()
fig.text(
(pos.x0 + pos.x1) / 2,
0.89,
title,
ha="center",
fontsize=10,
fontweight="bold"
)
# =========================
# Loss
# =========================
loss_line, = ax_loss.plot(
[],
[],
linewidth=2
)
ax_loss.set_xlim(
0,
EPOCHS
)
ax_loss.set_ylim(
0,
max(loss_history) * 1.08
)
ax_loss.set_title(
"Training Loss"
)
ax_loss.set_xlabel(
"Epoch"
)
ax_loss.set_ylabel(
"MSE"
)
ax_loss.grid(
alpha=0.2
)
# =========================
# Prediction
# =========================
pred1_line, = ax_pred.plot(
[],
[],
linewidth=1.8,
label="Prediction 1"
)
pred2_line, = ax_pred.plot(
[],
[],
linewidth=1.8,
label="Prediction 2"
)
ax_pred.axhline(
TARGET[0].item(),
linestyle="--",
linewidth=1.4,
label="Target 1"
)
ax_pred.axhline(
TARGET[1].item(),
linestyle="--",
linewidth=1.4,
label="Target 2"
)
ax_pred.set_xlim(
0,
EPOCHS
)
ax_pred.set_ylim(
pred_min - pred_margin,
pred_max + pred_margin
)
ax_pred.set_title(
"Prediction"
)
ax_pred.set_xlabel(
"Epoch"
)
ax_pred.set_ylabel(
"Output"
)
ax_pred.legend(
loc="best"
)
ax_pred.grid(
alpha=0.2
)
# =========================
# Attention
# =========================
def setup_attention_axis(ax):
bars = ax.bar(
["A", "B", "C"],
[0, 0, 0],
width=0.58
)
ax.set_ylim(
0,
1.05
)
ax.set_title(
"Attention"
)
ax.set_xlabel(
"Candidate Token"
)
ax.set_ylabel(
"Attention Weight"
)
ax.tick_params(
axis="x",
labelrotation=0
)
ax.grid(
axis="y",
alpha=0.2
)
texts = [
ax.text(
i,
0.02,
"0.000",
ha="center",
va="bottom",
fontsize=8.5
)
for i in range(3)
]
return bars, texts
h1_attn_bars, h1_attn_texts = (
setup_attention_axis(
ax_h1_attn
)
)
h2_attn_bars, h2_attn_texts = (
setup_attention_axis(
ax_h2_attn
)
)
# =========================
# QK Score
# =========================
def setup_score_axis(ax):
bars = ax.bar(
["A", "B", "C"],
[0, 0, 0],
width=0.58
)
ax.set_ylim(
score_min - score_margin,
score_max + score_margin
)
ax.set_title(
"QK Similarity"
)
ax.set_xlabel(
"Candidate Token"
)
ax.set_ylabel(
"Raw QK Score"
)
ax.tick_params(
axis="x",
labelrotation=0
)
ax.axhline(
0,
linewidth=0.8,
alpha=0.4
)
ax.grid(
axis="y",
alpha=0.2
)
texts = [
ax.text(
i,
0,
"0.000",
ha="center",
fontsize=8.5
)
for i in range(3)
]
return bars, texts
h1_score_bars, h1_score_texts = (
setup_score_axis(
ax_h1_score
)
)
h2_score_bars, h2_score_texts = (
setup_score_axis(
ax_h2_score
)
)
# =========================
# Concat
# =========================
concat_bars = ax_concat.bar(
["Head 1", "Head 2"],
[0, 0],
width=0.58
)
ax_concat.set_ylim(
concat_min - concat_margin,
concat_max + concat_margin
)
ax_concat.set_title(
"Concat Vector"
)
ax_concat.set_xlabel(
"Head Output"
)
ax_concat.set_ylabel(
"Value"
)
ax_concat.axhline(
0,
linewidth=0.8,
alpha=0.4
)
ax_concat.grid(
axis="y",
alpha=0.2
)
concat_texts = [
ax_concat.text(
i,
0,
"0.000",
ha="center",
fontsize=8.5
)
for i in range(2)
]
# =========================
# WO Heatmap
# =========================
wo_image = ax_wo.imshow(
wo_history[0],
cmap="coolwarm",
vmin=-wo_abs_max,
vmax=wo_abs_max,
aspect="auto"
)
ax_wo.set_title(
r"$W_O$ Projection Matrix"
)
ax_wo.set_xticks(
[0, 1]
)
ax_wo.set_xticklabels([
"Head 1",
"Head 2"
])
ax_wo.set_yticks(
[0, 1]
)
ax_wo.set_yticklabels([
"Output 1",
"Output 2"
])
ax_wo.set_xlabel(
"Concat Dimension"
)
ax_wo.set_ylabel(
"Output Dimension"
)
wo_texts = []
for i in range(2):
row = []
for j in range(2):
text = ax_wo.text(
j,
i,
"0.000",
ha="center",
va="center",
fontsize=9,
fontweight="medium"
)
row.append(text)
wo_texts.append(row)
# =========================
# Final Output
# =========================
x_pos = [0, 1]
bar_width = 0.36
output_pred_bars = ax_output.bar(
[
x - bar_width / 2
for x in x_pos
],
[0, 0],
width=bar_width,
label="Prediction"
)
ax_output.bar(
[
x + bar_width / 2
for x in x_pos
],
TARGET.tolist(),
width=bar_width,
label="Target"
)
ax_output.set_ylim(
pred_min - pred_margin,
pred_max + pred_margin
)
ax_output.set_xticks(
x_pos
)
ax_output.set_xticklabels([
"Output 1",
"Output 2"
])
ax_output.set_title(
"Final Output vs Target"
)
ax_output.set_ylabel(
"Value"
)
ax_output.axhline(
0,
linewidth=0.8,
alpha=0.4
)
ax_output.legend()
ax_output.grid(
axis="y",
alpha=0.2
)
output_texts = [
ax_output.text(
x - bar_width / 2,
0,
"0.000",
ha="center",
fontsize=8.5
)
for x in x_pos
]
# =========================
# Contribution Heatmap
# =========================
contrib_image = ax_contrib.imshow(
contribution_history[0],
cmap="coolwarm",
vmin=-contrib_abs_max,
vmax=contrib_abs_max,
aspect="auto"
)
ax_contrib.set_title(
r"$W_O \times Concat$ Contribution"
)
ax_contrib.set_xticks(
[0, 1]
)
ax_contrib.set_xticklabels([
"Head 1",
"Head 2"
])
ax_contrib.set_yticks(
[0, 1]
)
ax_contrib.set_yticklabels([
"Output 1",
"Output 2"
])
ax_contrib.set_xlabel(
"Contribution Source"
)
ax_contrib.set_ylabel(
"Final Output"
)
contrib_texts = []
for i in range(2):
row = []
for j in range(2):
text = ax_contrib.text(
j,
i,
"0.000",
ha="center",
va="center",
fontsize=9,
fontweight="medium"
)
row.append(text)
contrib_texts.append(row)
# =========================
# Slider
# =========================
ax_slider = fig.add_axes(
[0.13, 0.115, 0.74, 0.027]
)
slider = Slider(
ax=ax_slider,
label="Epoch",
valmin=0,
valmax=EPOCHS,
valinit=0,
valstep=1
)
# =========================
# Buttons
# =========================
button_y = 0.045
button_h = 0.042
button_w = 0.08
gap = 0.012
start_x = 0.275
ax_play = fig.add_axes([
start_x,
button_y,
button_w,
button_h
])
ax_pause = fig.add_axes([
start_x + button_w + gap,
button_y,
button_w,
button_h
])
ax_step = fig.add_axes([
start_x + 2 * (button_w + gap),
button_y,
button_w,
button_h
])
ax_reset = fig.add_axes([
start_x + 3 * (button_w + gap),
button_y,
button_w,
button_h
])
ax_repeat = fig.add_axes([
start_x + 4 * (button_w + gap),
button_y,
button_w + 0.025,
button_h
])
btn_play = Button(
ax_play,
"Play",
hovercolor="0.92"
)
btn_pause = Button(
ax_pause,
"Pause",
hovercolor="0.92"
)
btn_step = Button(
ax_step,
"Step >",
hovercolor="0.92"
)
btn_reset = Button(
ax_reset,
"Reset",
hovercolor="0.92"
)
btn_repeat = Button(
ax_repeat,
"Repeat: ON",
hovercolor="0.92"
)
# =========================
# 播放状态
# =========================
state = {
"frame": 0,
"playing": False,
"repeat": True
}
timer = fig.canvas.new_timer(
interval=70
)
# =========================
# 更新工具
# =========================
def update_bars(
bars,
texts,
values,
offset
):
for bar, text, value in zip(
bars,
texts,
values
):
bar.set_height(
value
)
text.set_text(
f"{value:.3f}"
)
if value >= 0:
text.set_y(
value + offset
)
text.set_va(
"bottom"
)
else:
text.set_y(
value - offset
)
text.set_va(
"top"
)
def update_heatmap_text(
texts,
matrix,
max_abs
):
for i in range(2):
for j in range(2):
value = matrix[i][j]
texts[i][j].set_text(
f"{value:.3f}"
)
if abs(value) > max_abs * 0.55:
texts[i][j].set_color(
"white"
)
else:
texts[i][j].set_color(
"black"
)
# =========================
# 刷新Dashboard
# =========================
def draw_frame(frame):
frame = max(
0,
min(
EPOCHS,
int(frame)
)
)
state["frame"] = frame
x_axis = list(
range(frame + 1)
)
# Training
loss_line.set_data(
x_axis,
loss_history[:frame + 1]
)
pred1_line.set_data(
x_axis,
pred1_history[:frame + 1]
)
pred2_line.set_data(
x_axis,
pred2_history[:frame + 1]
)
# Head 1
update_bars(
h1_attn_bars,
h1_attn_texts,
head1_attn_history[frame],
0.025
)
update_bars(
h1_score_bars,
h1_score_texts,
head1_score_history[frame],
score_margin * 0.06
)
# Head 2
update_bars(
h2_attn_bars,
h2_attn_texts,
head2_attn_history[frame],
0.025
)
update_bars(
h2_score_bars,
h2_score_texts,
head2_score_history[frame],
score_margin * 0.06
)
# Concat
update_bars(
concat_bars,
concat_texts,
concat_history[frame],
concat_margin * 0.08
)
# WO
current_wo = (
wo_history[frame]
)
wo_image.set_data(
current_wo
)
update_heatmap_text(
wo_texts,
current_wo,
wo_abs_max
)
# Final Output
current_pred = [
pred1_history[frame],
pred2_history[frame]
]
update_bars(
output_pred_bars,
output_texts,
current_pred,
pred_margin * 0.08
)
# Contribution
current_contrib = (
contribution_history[frame]
)
contrib_image.set_data(
current_contrib
)
update_heatmap_text(
contrib_texts,
current_contrib,
contrib_abs_max
)
fig.suptitle(
f"Multi-Head Self-Attention Training"
f" | Epoch {frame:03d}/{EPOCHS}"
f" | Loss {loss_history[frame]:.5f}"
f" | Prediction "
f"[{pred1_history[frame]:.3f}, "
f"{pred2_history[frame]:.3f}]",
fontsize=15,
fontweight="medium"
)
fig.canvas.draw_idle()
# =========================
# 播放控制
# =========================
def next_frame():
frame = (
state["frame"] + 1
)
if frame > EPOCHS:
if state["repeat"]:
frame = 0
else:
state["playing"] = False
timer.stop()
return
slider.set_val(
frame
)
def timer_callback():
if state["playing"]:
next_frame()
timer.add_callback(
timer_callback
)
def play_clicked(event):
if not state["playing"]:
state["playing"] = True
timer.start()
def pause_clicked(event):
state["playing"] = False
timer.stop()
def step_clicked(event):
state["playing"] = False
timer.stop()
next_frame()
def reset_clicked(event):
state["playing"] = False
timer.stop()
slider.set_val(
0
)
def repeat_clicked(event):
state["repeat"] = (
not state["repeat"]
)
btn_repeat.label.set_text(
"Repeat: ON"
if state["repeat"]
else "Repeat: OFF"
)
fig.canvas.draw_idle()
# =========================
# 控件绑定
# =========================
slider.on_changed(
lambda value:
draw_frame(value)
)
btn_play.on_clicked(
play_clicked
)
btn_pause.on_clicked(
pause_clicked
)
btn_step.on_clicked(
step_clicked
)
btn_reset.on_clicked(
reset_clicked
)
btn_repeat.on_clicked(
repeat_clicked
)
# =========================
# 键盘快捷键
# =========================
def keyboard(event):
# 空格:播放/暂停
if event.key == " ":
if state["playing"]:
pause_clicked(None)
else:
play_clicked(None)
# 右键:下一Epoch
elif event.key == "right":
step_clicked(None)
# 左键:上一Epoch
elif event.key == "left":
state["playing"] = False
timer.stop()
slider.set_val(
max(
0,
state["frame"] - 1
)
)
# R:重置
elif event.key == "r":
reset_clicked(None)
fig.canvas.mpl_connect(
"key_press_event",
keyboard
)
# =========================
# 启动
# =========================
draw_frame(0)
plt.show()