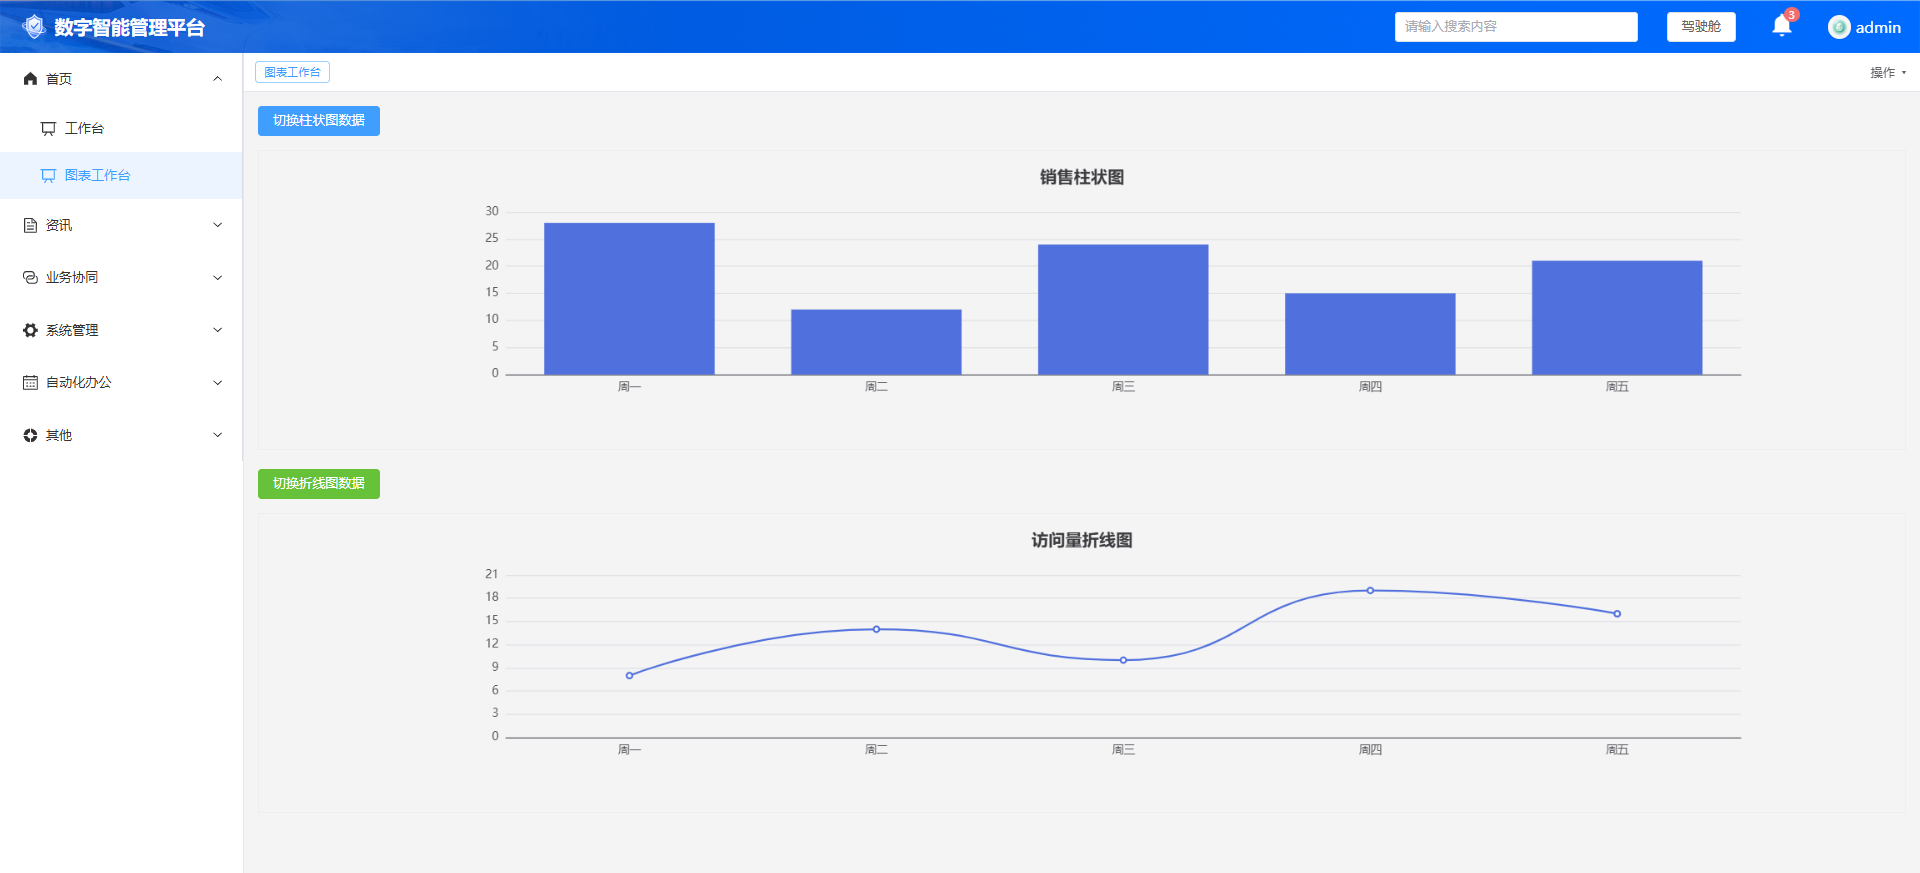
第 3 章:单页面多个 ECharts 图表共存(柱状图 + 折线图)
本章目标:在同一个页面创建 2 张独立图表,复用
useEcharts。核心要点:多次调用 useEcharts (),每次调用都会生成独立的 ref 和图表实例,互不干扰。
完整页面代码 chartDemo.vue
<template>
  <div class="chart-container">
    <!-- 第一个图表:柱状图 -->
    <el-button type="primary" @click="changeBarData">切换柱状图数据</el-button>
    <div
      ref="barChartRef"
      style="
        width: 100%;
        height: 320px;
        border: 1px solid #eee;
        margin-top: 15px;
      "
    ></div>

    <!-- 第二个图表:折线图 -->
    <el-button type="success" @click="changeLineData" style="margin-top:20px;">切换折线图数据</el-button>
    <div
      ref="lineChartRef"
      style="
        width: 100%;
        height: 320px;
        border: 1px solid #eee;
        margin-top: 15px;
      "
    ></div>
  </div>
</template>

<script setup>
import { onMounted } from 'vue'
import { useEcharts } from '@/composables/echartHelper'

// 🔥多次调用useEcharts,解构重命名,生成两套独立实例
const { chartRef: barChartRef, setChartOption: setBarOption } = useEcharts()
const { chartRef: lineChartRef, setChartOption: setLineOption } = useEcharts()

// ========== 柱状图配置 ==========
const barOptionA = {
  title: {
    text: '销售柱状图',
    left: 'center'
  },
  xAxis: {
    type: 'category',
    data: ['周一', '周二', '周三', '周四', '周五']
  },
  yAxis: {
    type: 'value'
  },
  series: [
    {
      type: 'bar',
      data: [10, 22, 18, 25, 16]
    }
  ]
}
const barOptionB = {
  title: {
    text: '销售柱状图',
    left: 'center'
  },
  xAxis: {
    type: 'category',
    data: ['周一', '周二', '周三', '周四', '周五']
  },
  yAxis: {
    type: 'value'
  },
  series: [
    {
      type: 'bar',
      data: [28, 12, 24, 15, 21]
    }
  ]
}
let currentBarOption = barOptionA

// ========== 折线图配置 ==========
const lineOptionA = {
  title: {
    text: '访问量折线图',
    left: 'center'
  },
  xAxis: {
    type: 'category',
    data: ['周一', '周二', '周三', '周四', '周五']
  },
  yAxis: {
    type: 'value'
  },
  series: [
    {
      type: 'line',
      smooth: true,
      data: [8, 14, 10, 19, 16]
    }
  ]
}
const lineOptionB = {
  title: {
    text: '访问量折线图',
    left: 'center'
  },
  xAxis: {
    type: 'category',
    data: ['周一', '周二', '周三', '周四', '周五']
  },
  yAxis: {
    type: 'value'
  },
  series: [
    {
      type: 'line',
      smooth: true,
      data: [22, 15, 28, 13, 20]
    }
  ]
}
let currentLineOption = lineOptionA

// 页面挂载完成,初始化两张图表
onMounted(() => {
  setBarOption(currentBarOption)
  setLineOption(currentLineOption)
})

// 切换柱状图
const changeBarData = () => {
  currentBarOption = currentBarOption === barOptionA ? barOptionB : barOptionA
  setBarOption(currentBarOption)
}

// 切换折线图
const changeLineData = () => {
  currentLineOption = currentLineOption === lineOptionA ? lineOptionB : lineOptionA
  setLineOption(currentLineOption)
}
</script>
第 3 章 测试清单
- 替换
chartDemo.vue全部代码,保存文件 - 刷新页面
- 逐项测试:
- 页面加载同时展示柱状图、折线图两张图表
- 点击【切换柱状图数据】,仅柱状图变化,折线图不动
- 点击【切换折线图数据】,仅折线图变化,柱状图不动
- 拉伸浏览器窗口,两张图表都自适应缩放
- 在若依菜单来回切换页面,控制台无报错,实例正常销毁