文章目录
1.启用Manager组件的Prometheus模块
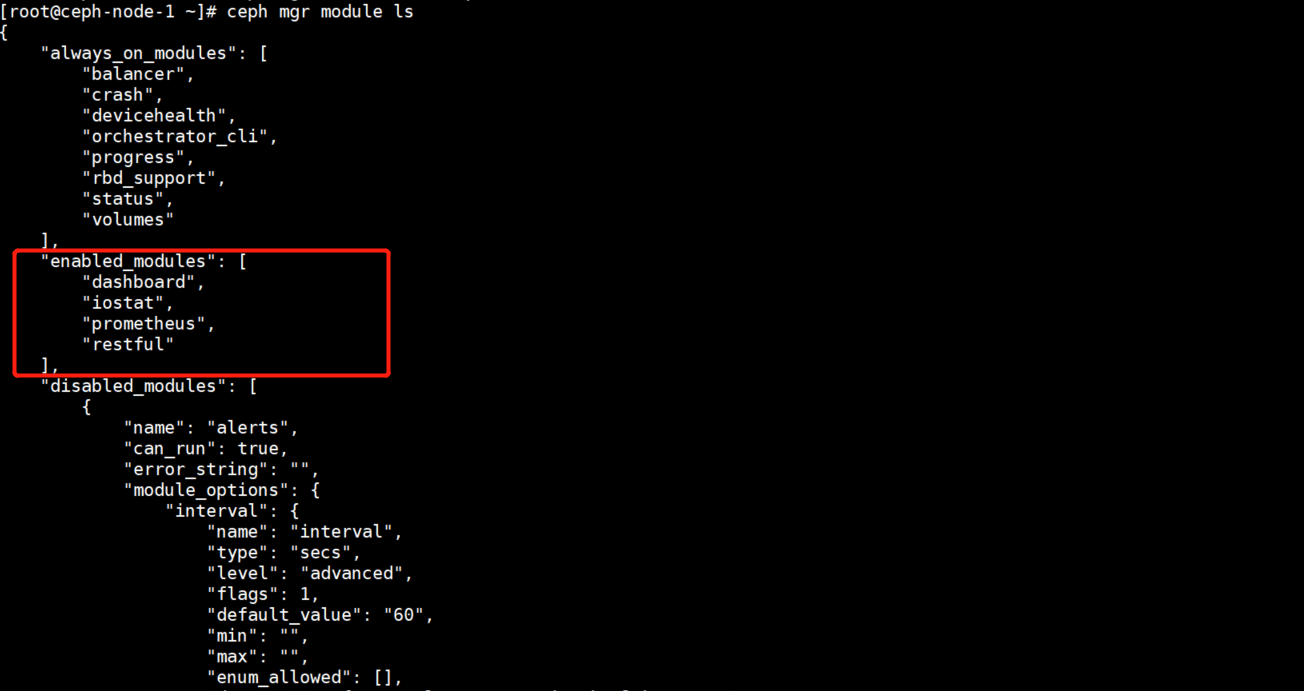
Manager组件的Prometheus模块提供了Ceph exporter客户端程序,会在集群的每一个节点汇总部署Ceph exporter,通过Ceph exporter采集Ceph集群的监控指标,最后由Prometheus监控系统展示监控数据。
sh
[root@ceph-node-1 ~]# ceph mgr module enable prometheusPrometheus模块启用成功。
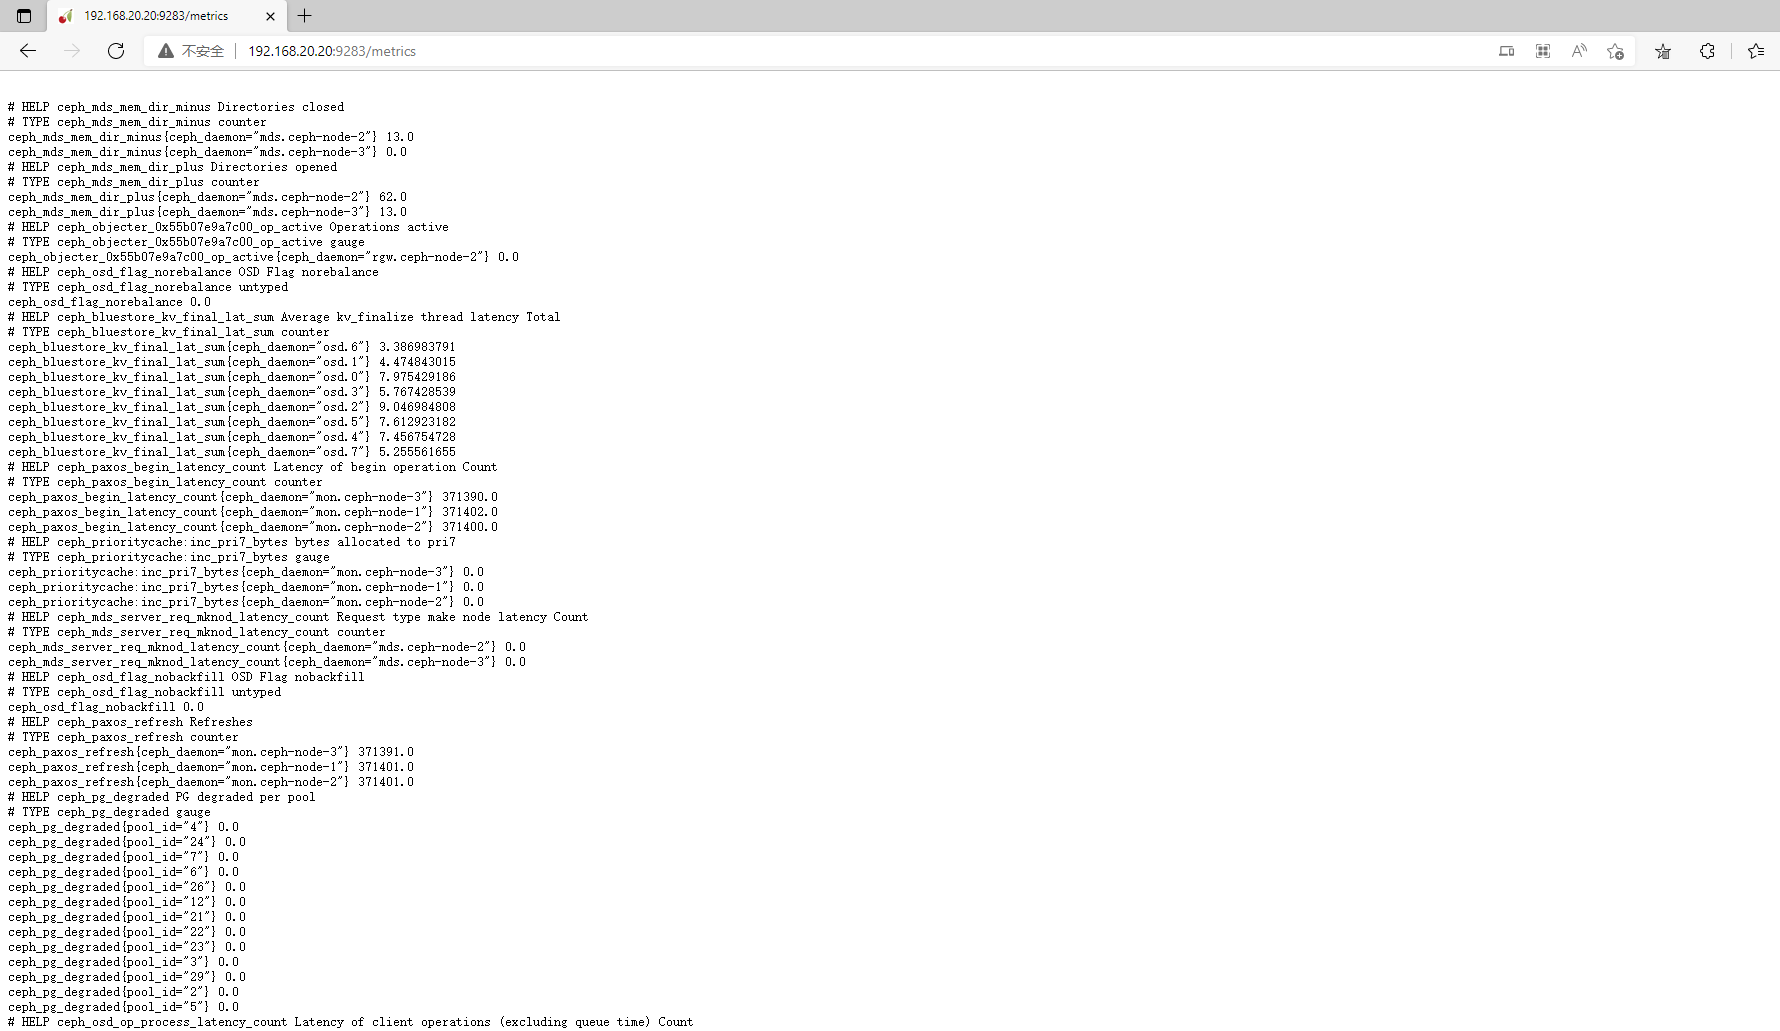
Prometheus模块开启后会在集群中启动一个9283的端口。
sh
[root@ceph-node-1 ~]# netstat -lnpt | grep 9283
tcp6 0 0 :::9283 :::* LISTEN 938527/ceph-mgr浏览器访问https://192.168.20.20:9283/metrics即可看到Ceph exporter采集的监控指标。
2.部署并配置Prometheus
2.1.部署Prometheus服务端
1)准备Prometheus监控系统的yum源
sh
[root@ceph-node-1 ~]# vim /etc/yum.repos.d/prometheus.repo
[prometheus]
name=prometheus
baseurl=https://packagecloud.io/prometheus-rpm/release/el/$releasever/$basearch
repo_gpgcheck=1
enabled=1
gpgcheck=0
metadata_expire=300
2)安装Prometheus
sh
[root@ceph-node-1 ~]# yum -y install prometheus3)启动Prometheus
sh
[root@ceph-node-1 ~]# systemctl start prometheus
[root@ceph-node-1 ~]# systemctl status prometheus
● prometheus.service - The Prometheus monitoring system and time series database.
Loaded: loaded (/usr/lib/systemd/system/prometheus.service; disabled; vendor preset: disabled)
Active: active (running) since 一 2022-04-25 15:47:31 CST; 4s ago
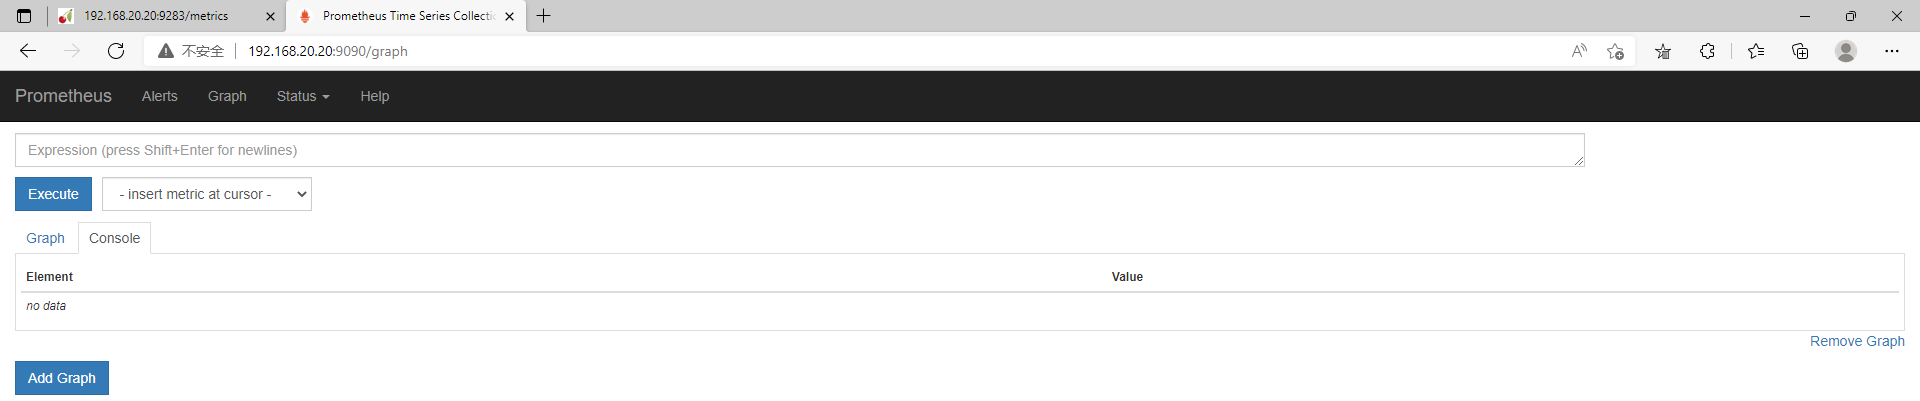
Docs: https://prometheus.io浏览器访问http://192.168.20.20:9090进入Prometheus监控系统。
2.2.配置Prometheus添加Ceph集群的监控信息
主要是在Prometheus中将Ceph exporter组件的地址添加到监控系统中,用于展示Ceph集群的监控数据。
yaml
[root@ceph-node-1 ~]# vim /etc/prometheus/prometheus.yml
global:
  scrape_interval:     15s
  evaluation_interval: 15s
  external_labels:
      monitor: 'codelab-monitor'

rule_files:

scrape_configs:
  - job_name: 'prometheus'
    static_configs:
      - targets: ['192.168.20.20:9090']

  - job_name: 'ceph_cluster'
    static_configs:
      - targets: ['192.168.20.20:9283']
注意:填写Ceph exporter组件的地址时,要填写处于Active状态的Manager组件地址。
重启Prometheus监控系统。
sh
[root@ceph-node-1 ~]# systemctl restart prometheus2.3.观察Prometheus监控系统中是否能浏览Ceph集群的监控数据
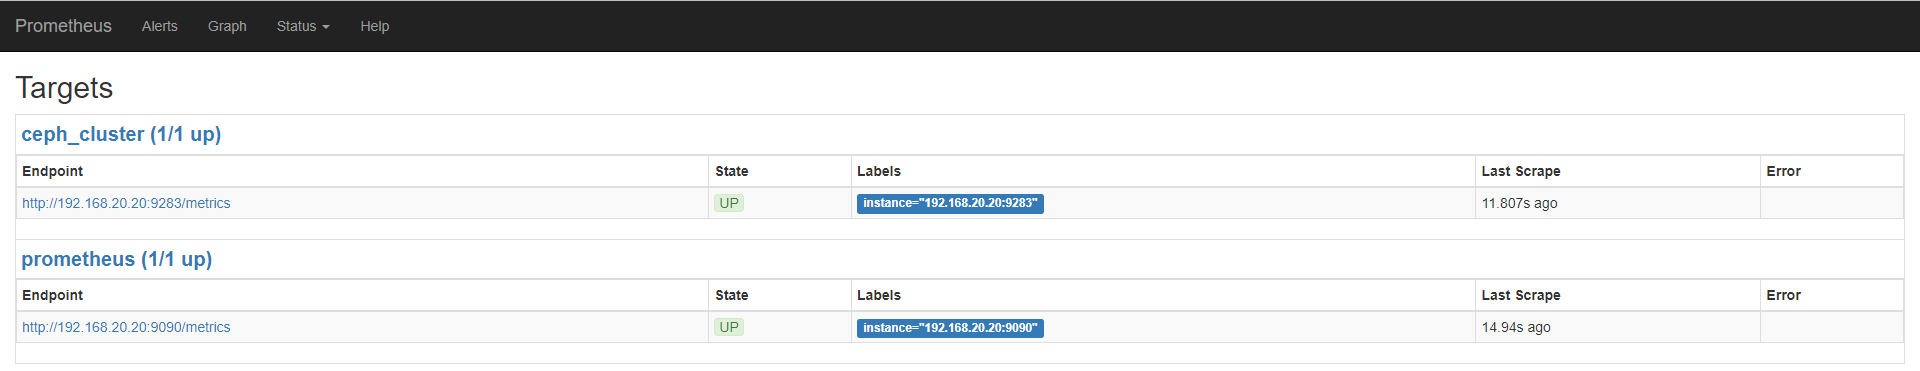
在Targets中可以看到监控主机的信息。
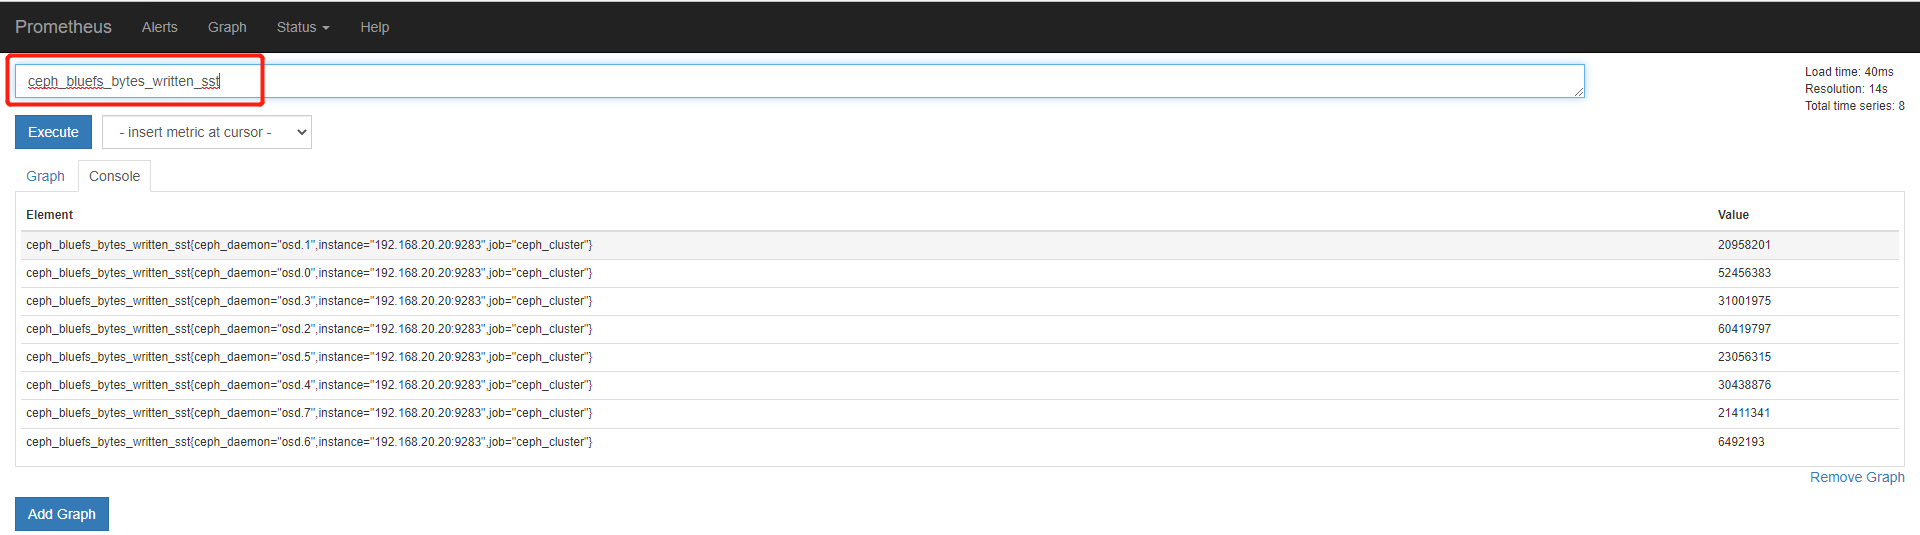
在首页搜索框中也可以看到大量的Ceph监控指标和数据。
3.部署Grafana用于展示Prometheus的监控数据
3.1.部署Grafana仪表盘
sh
1.下载Grafana的rpm包
[root@ceph-node-1 ~]# wget https://repo.huaweicloud.com/grafana/8.5.0/grafana-enterprise-8.5.0-1.x86_64.rpm

2.安装Grafana
[root@ceph-node-1 ~]# yum -y localinstall grafana-enterprise-8.5.0-1.x86_64.rpm

3.启动Grafana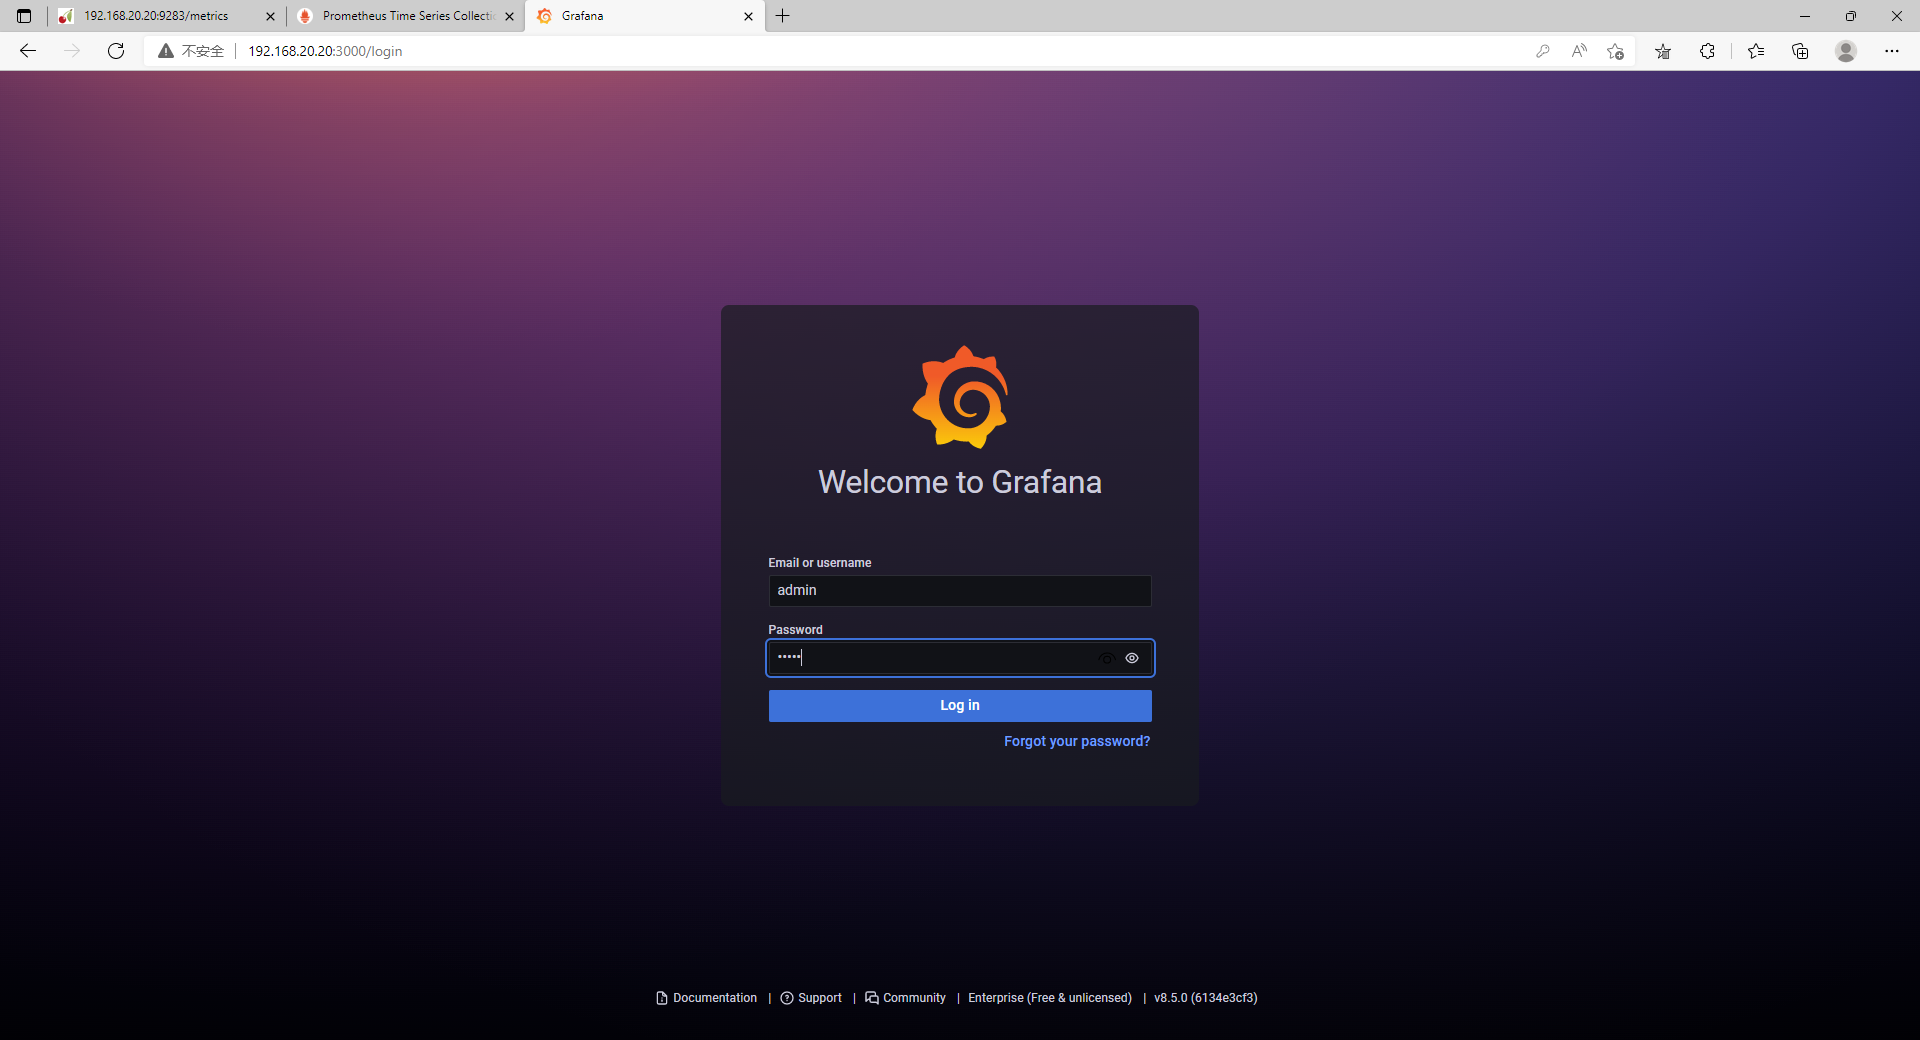
[root@ceph-node-1 ~]# systemctl start grafana-server访问Grafana仪表盘http://192.168.20.20:3000/login,默认占用系统的3000端口,默认账号密码都是admin。
3.2.Grafana仪表盘首页
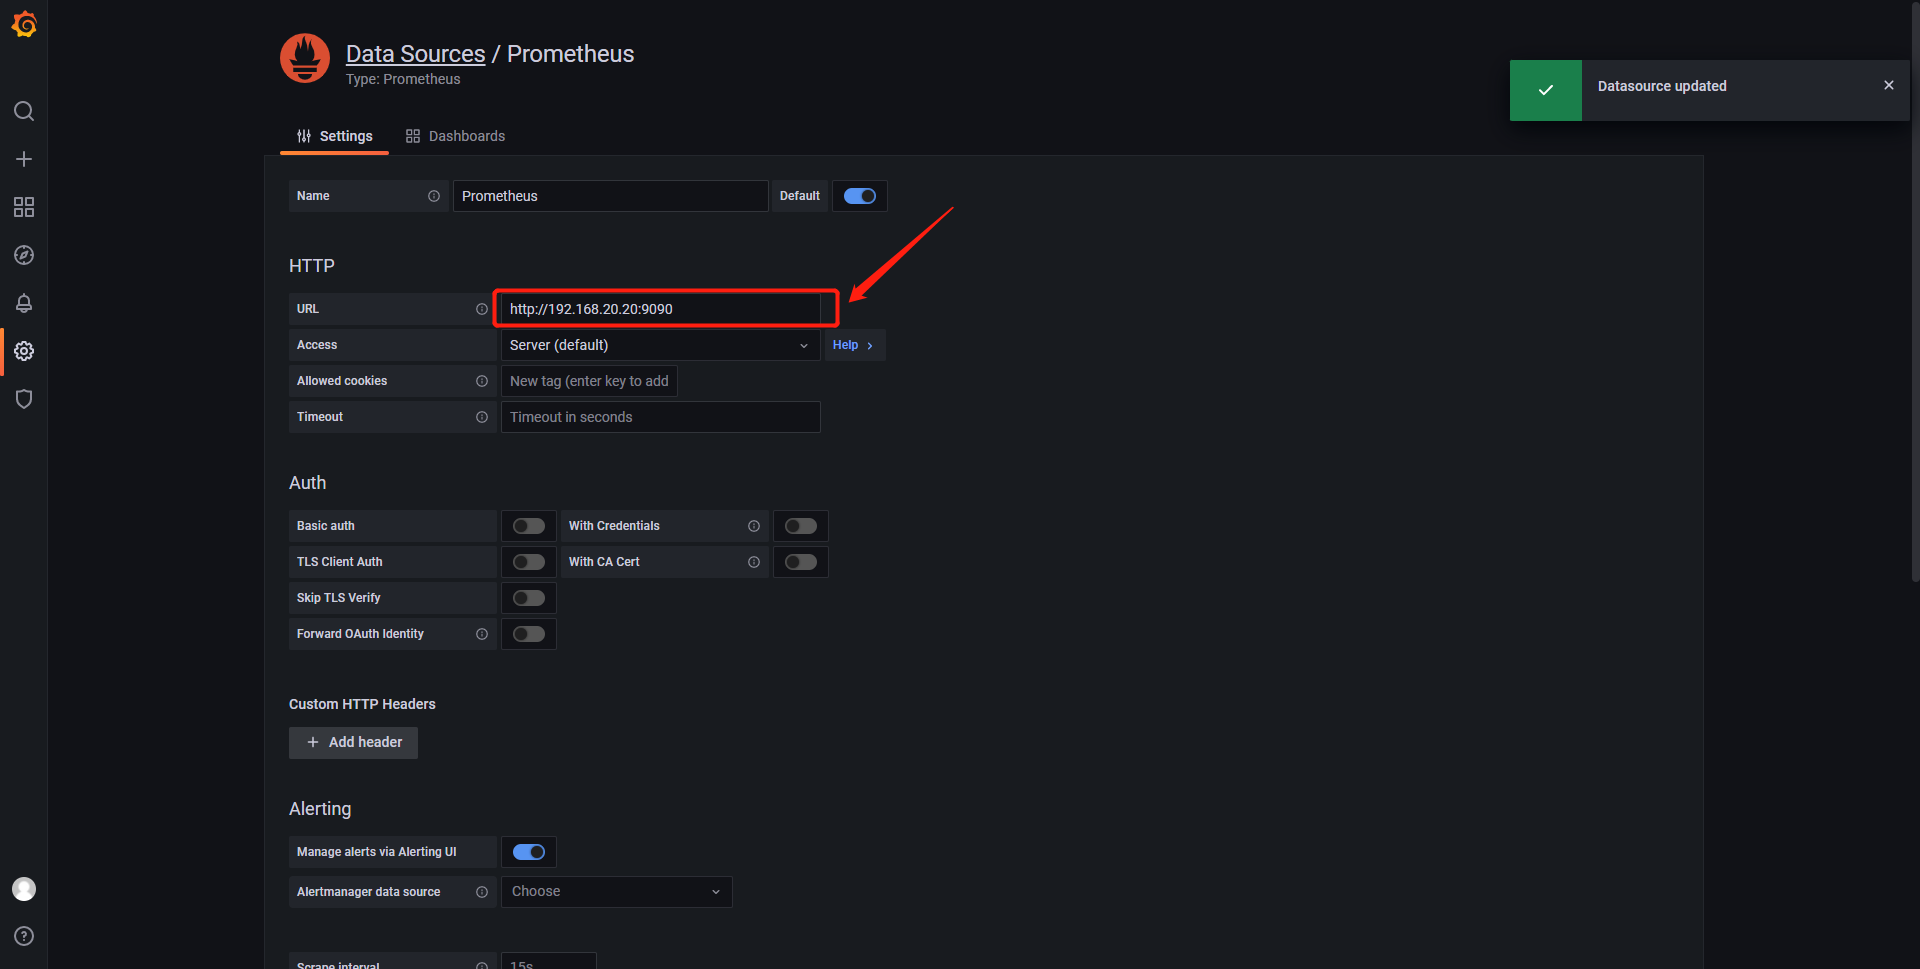
3.3.配置连接Prometheus数据源
点击设置--->Date Source--->Add data source--->选择Prometheus--->填写Prometheus监控系统的地址--->保存。
3.4.导入Ceph集群监控模板
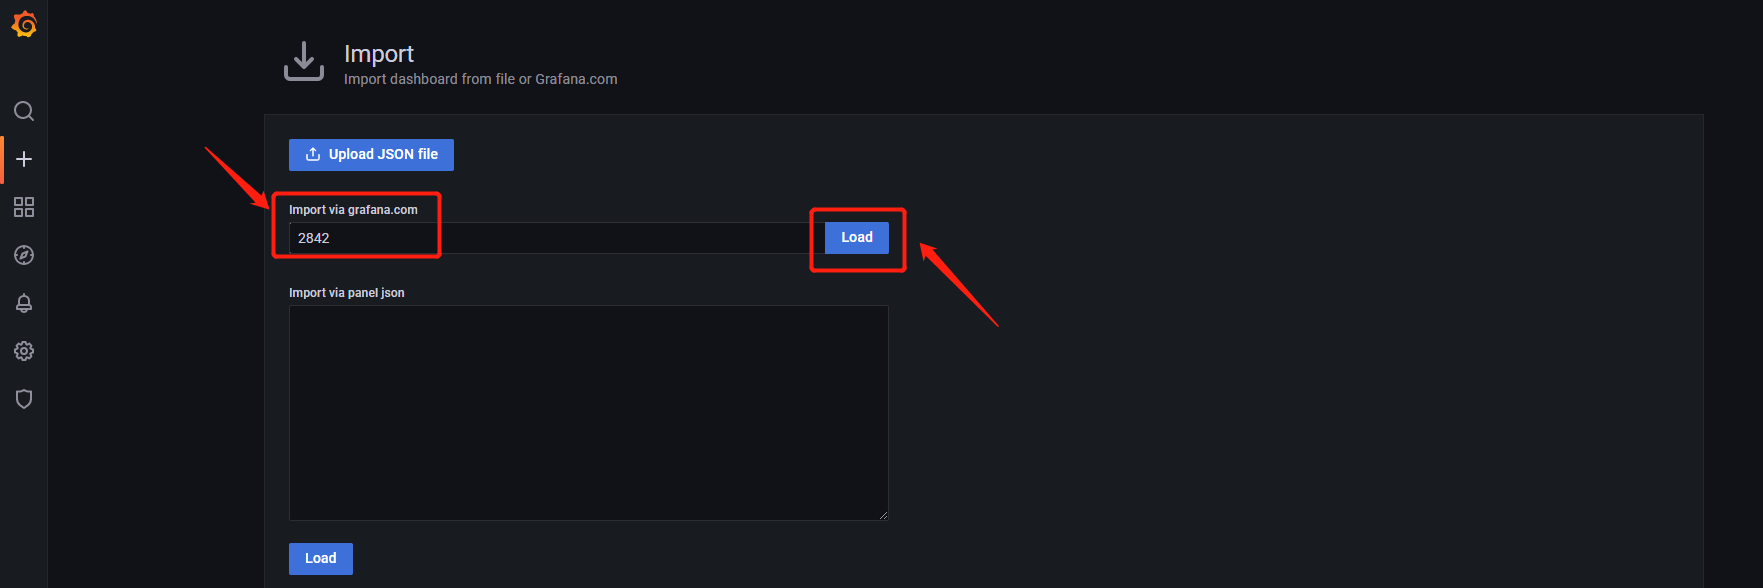
在Grafana官方搜索的Ceph集群监控模板,其中ID为2842和5336的图形模板展示的内容非常丰富。
2842模板主要展示集群的相关信息,非常全面。
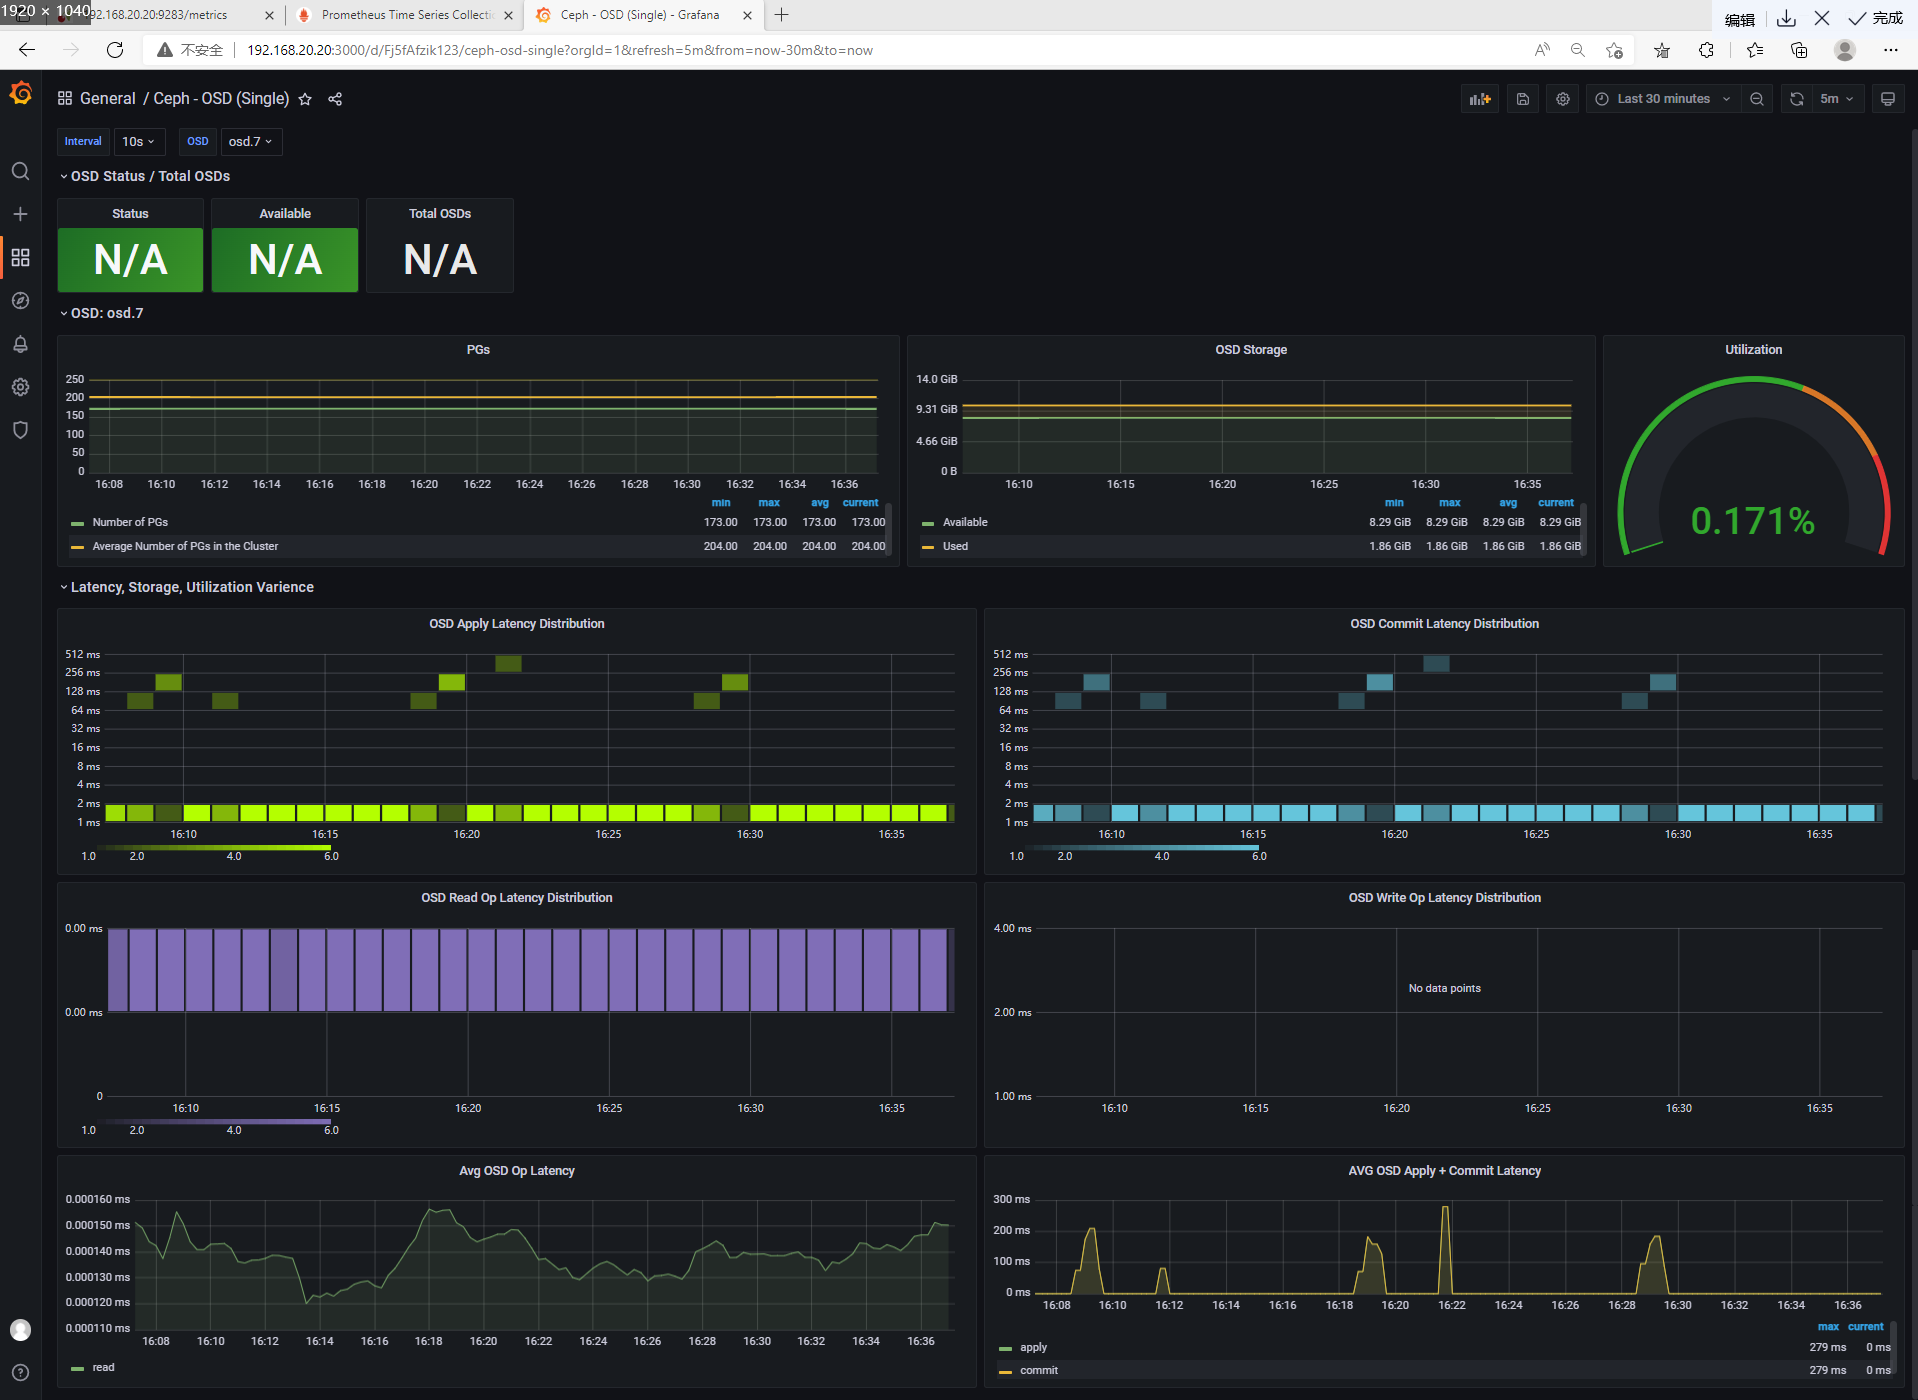
5336模板主要展示OSD的相关信息。
3.4.1.导入Grafana监控模板
1)点击+号--->选择Import--->输入2842--->点击Load。
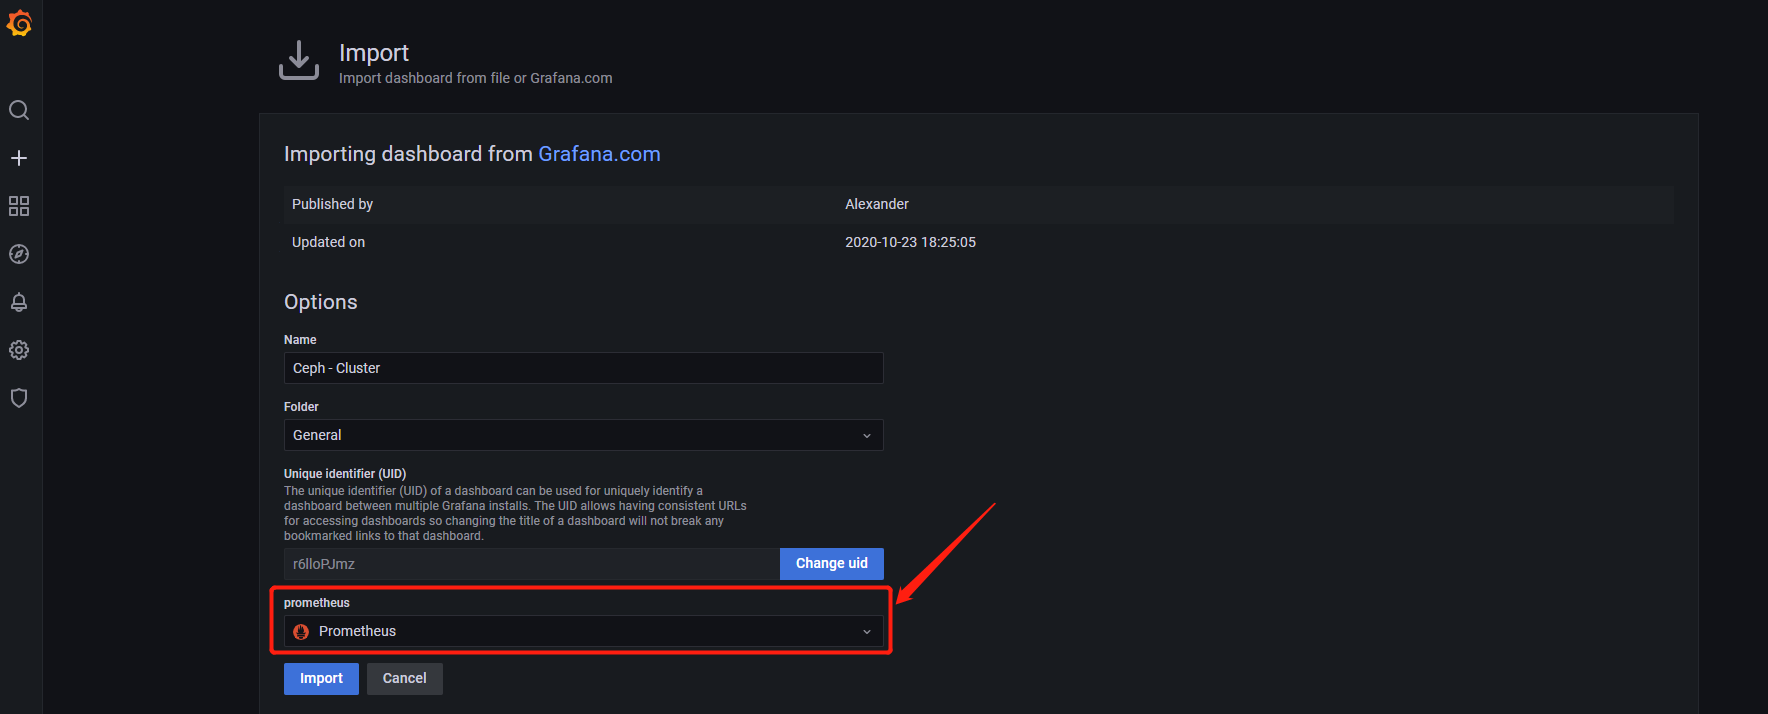
2)数据源选择Prometheus的数据源。
3.4.2.ID为2842号模板展示
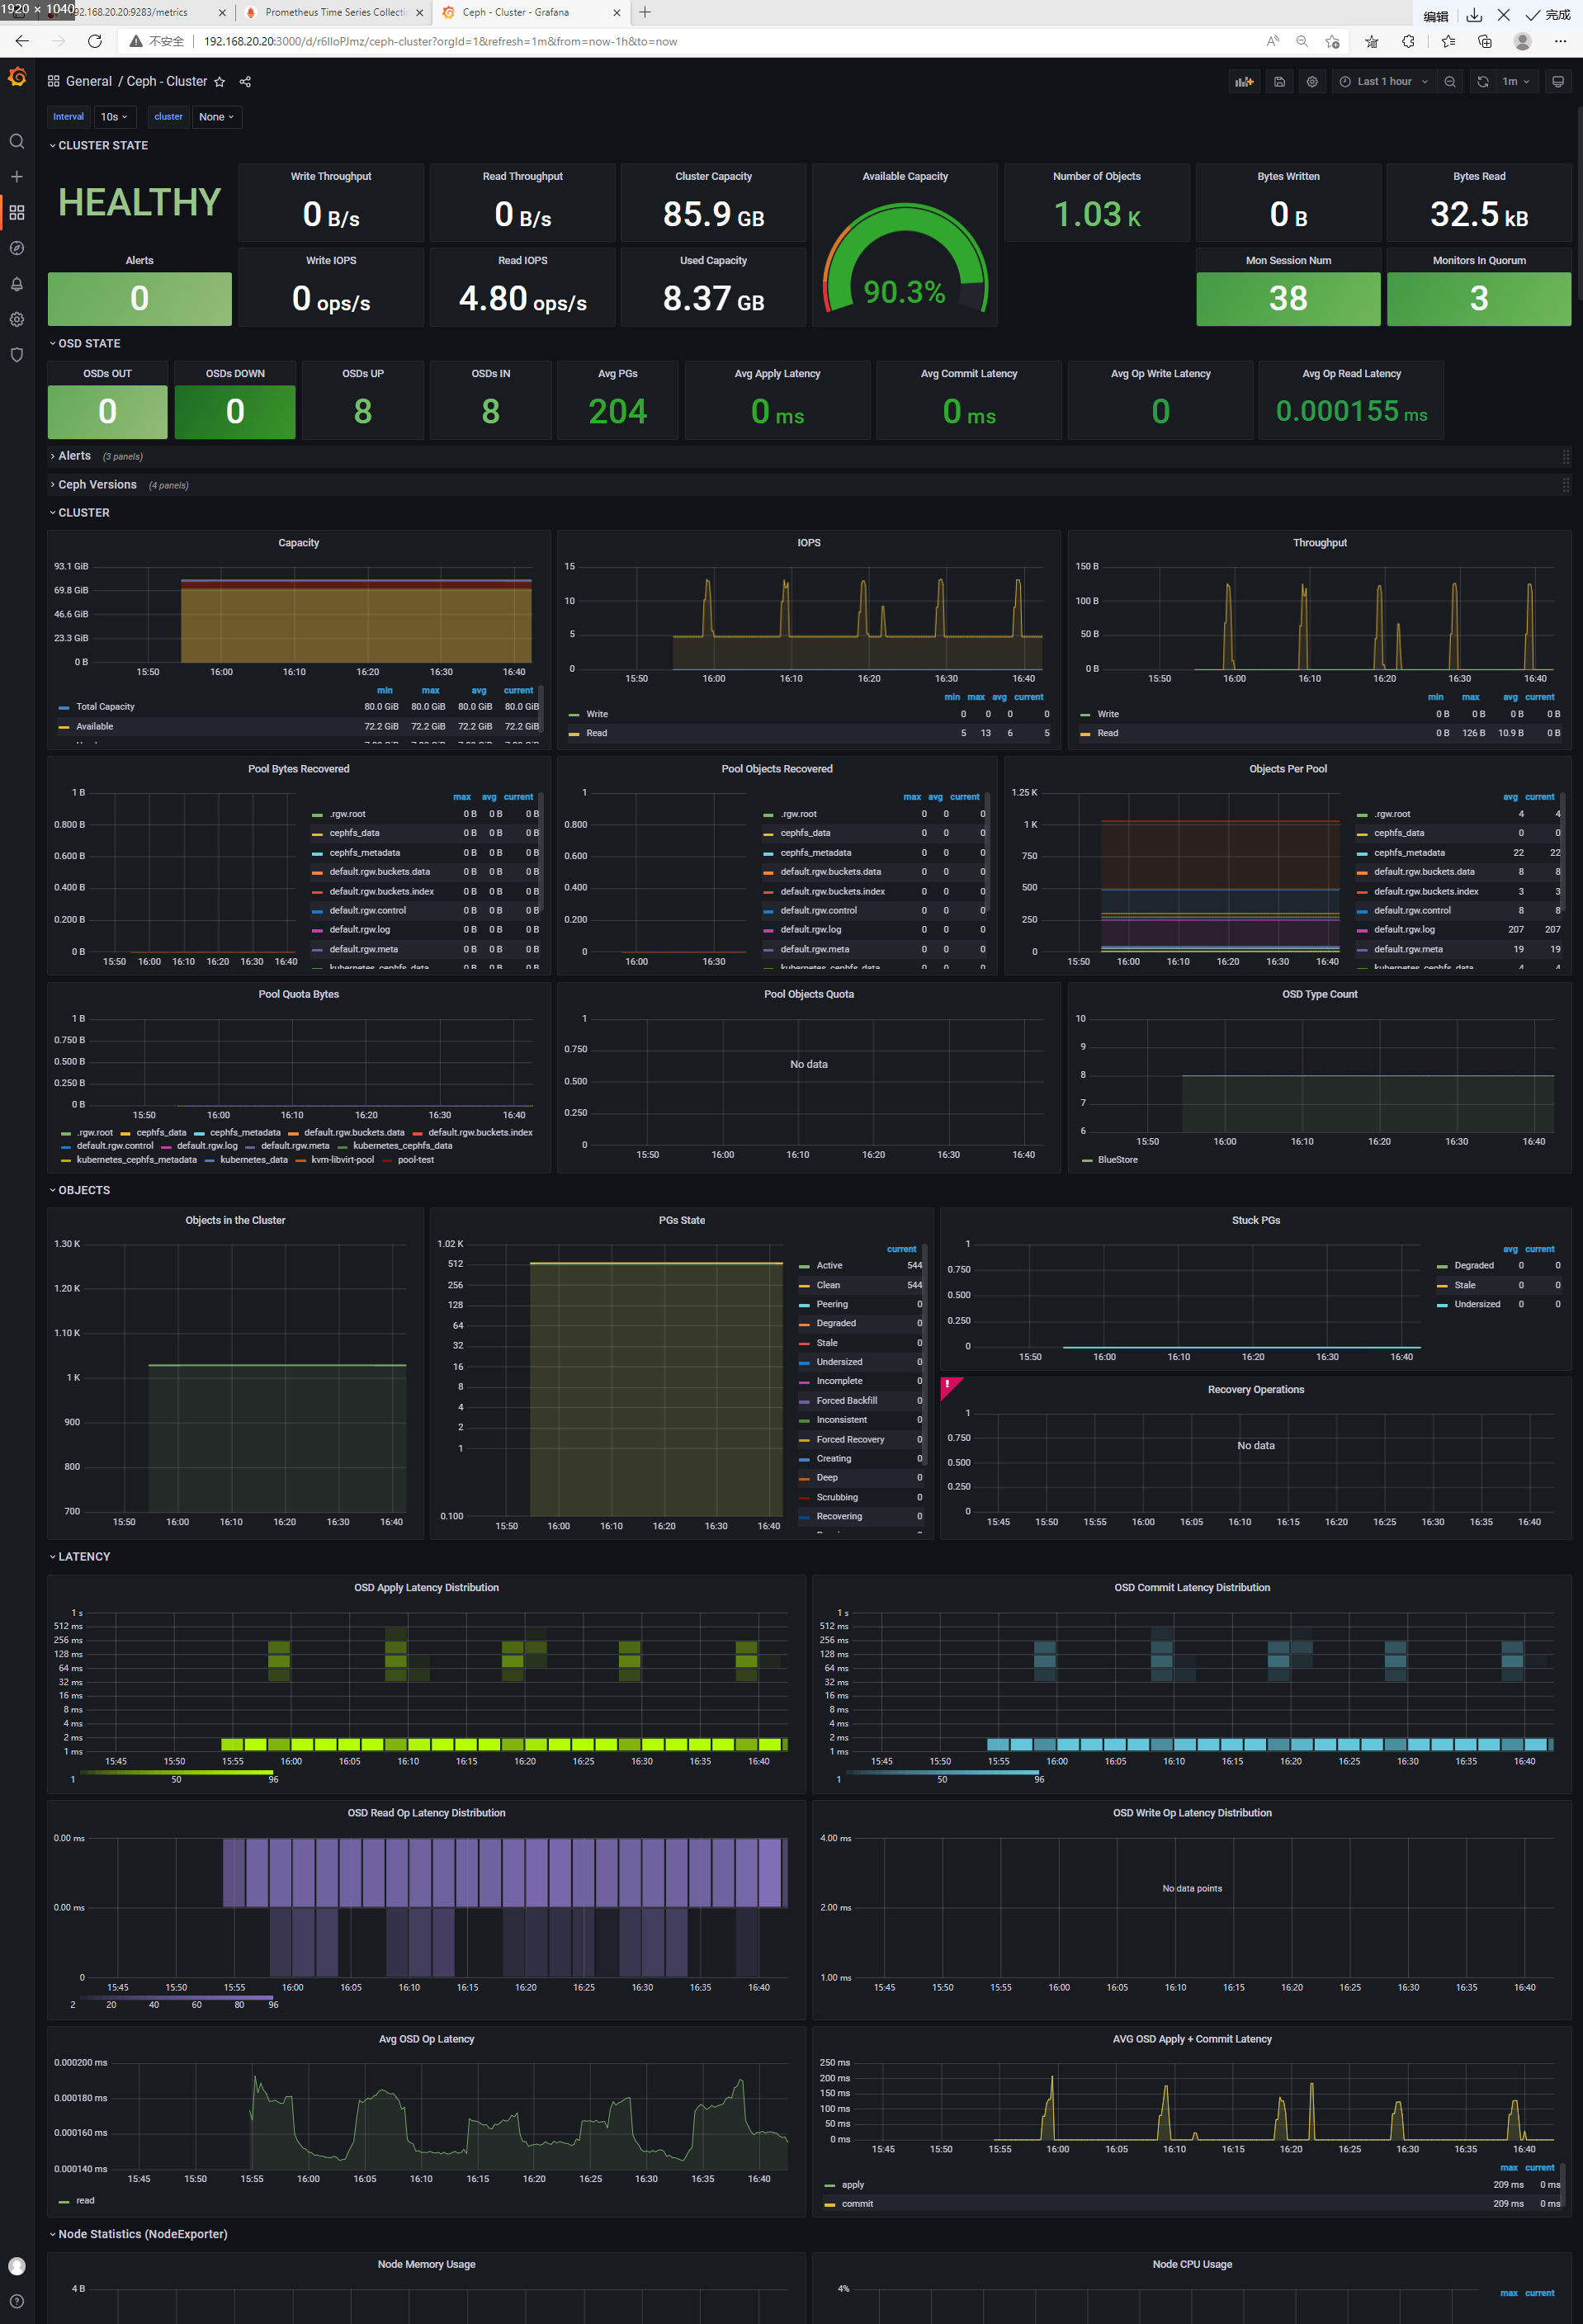
ID为2842号模板展示的Ceph集群监控数据非常全面,包括集群的状态、读写性能指标、组件数量、PG、OSD等等非常丰富的监控数据展示。
3.4.3.ID为5336号模板展示
ID为5336号模板主要是来展示OSD的监控信息的,可以看到很多有价值的监控指标。