安装 Elastic :Elasticsearch,Kibana,Logstash
另外安装一个收集器filebeat
通过二进制安装包进行安装
创建一个专门放elk目录
bash
mkdir /elk/
mkdir /elk/soft
下载 es 、kibana、Logstash、filebeat二进制包
bash
cd /elk/soft

wget https://artifacts.elastic.co/downloads/elasticsearch/elasticsearch-8.15.4-linux-x86_64.tar.gz
wget https://artifacts.elastic.co/downloads/kibana/kibana-8.15.4-linux-x86_64.tar.gz
wget https://artifacts.elastic.co/downloads/logstash/logstash-8.15.4-linux-x86_64.tar.gz
wget https://artifacts.elastic.co/downloads/beats/filebeat/filebeat-8.15.4-linux-x86_64.tar.gz
解压四个安装包
bash
tar -zxvf kibana-8.15.4-linux-x86_64.tar.gz -C /elk/
tar -zxvf elasticsearch-8.15.4-linux-x86_64.tar.gz -C /elk/
tar -zxvf logstash-8.15.4-linux-x86_64.tar.gz -C /elk/
tar -zxvf elasticsearch-8.15.4-linux-x86_64.tar.gz -C /elk/
tar -zxvf filebeat-8.15.4-linux-x86_64.tar.gz -C /elk/
查看解压出来的文件
bash
[root@server elk]# ls
elasticsearch-8.15.4  filebeat-8.15.4-linux-x86_64  kibana-8.15.4  logstash-8.15.4  soft
安装Elasticsearch
进入elasticsearch目录,修改配置文件
bash
[root@server elk]# cd elasticsearch-8.15.4/
[root@server elasticsearch-8.15.4]# ls
bin  config  jdk  lib  LICENSE.txt  logs  modules  NOTICE.txt  plugins  README.asciidoc

[root@server config]# cd config/

[root@server config]# vim elasticsearch.yml
### 不同的集群使用不同的 cluster.name
cluster.name: my-application
### 默认是主机名
node.name: node-1
network.host: 0.0.0.0
http.port: 9200
xpack.monitoring.collection.enabled: true启动elasticsearch,报错Elasticsearchjava.lang.RuntimeException: can not run elasticsearch as root
bash
[root@server elasticsearch-8.15.4]# cd bin/
[root@server bin]# ./elasticsearch
warning: ignoring JAVA_HOME=/usr/local/jdk-21.0.5; using bundled JDK
Nov 14, 2024 2:46:50 PM sun.util.locale.provider.LocaleProviderAdapter <clinit>
WARNING: COMPAT locale provider will be removed in a future release
[2024-11-14T14:47:11,607][INFO ][o.e.n.NativeAccess       ] [server] Using native vector library; to disable start with -Dorg.elasticsearch.nativeaccess.enableVectorLibrary=false
[2024-11-14T14:47:12,169][INFO ][o.e.n.NativeAccess       ] [server] Using [jdk] native provider and native methods for [Linux]
[2024-11-14T14:47:12,169][ERROR][o.e.b.Elasticsearch      ] [server] fatal exception while booting Elasticsearchjava.lang.RuntimeException: can not run elasticsearch as root
        at org.elasticsearch.server@8.15.4/org.elasticsearch.bootstrap.Elasticsearch.initializeNatives(Elasticsearch.java:289)
        at org.elasticsearch.server@8.15.4/org.elasticsearch.bootstrap.Elasticsearch.initPhase2(Elasticsearch.java:170)
        at org.elasticsearch.server@8.15.4/org.elasticsearch.bootstrap.Elasticsearch.main(Elasticsearch.java:75)

See logs for more details.

ERROR: Elasticsearch did not exit normally - check the logs at /usr/local/elk/elasticsearch-8.15.4/logs/elasticsearch.log

ERROR: Elasticsearch died while starting up, with exit code 1
这里有几个很明显的提示:
- 有个告警:warning: ignoring JAVA_HOME=/usr/local/java; using bundled JDK ,Elasticsearch 安装包本身绑定使用的是 OpenJDK 。
Elasticsearch 使用 Java 构建,在每个发行版中都包含 OpenJDK 捆绑版本。 ES 推荐使用默认的 OpenJDK 的 JVM,该 JDK 位于$ES_HOME 的 jdk 目录中。
当然也可以改成使用自己的 Java 版本,设置一下 ES_JAVA_HOME 环境变量,指向自己的 JDK 即可。
建议还是使用 ES 默认的 JDK 进行构建,无需其他额外的配置。
can not run elasticsearch as root:不能使用 root 用户来运行 ES。
创建一个 elastic 用户,使用该用户启动
bash
[root@server config]#  useradd user-es
# 目录修改权限
[root@server config]# cd /elk/
[root@server elk]# chown user-es:user-es  elasticsearch-8.15.4/ -R
# 切换用户,进入目录
[root@server config]# su - user-es
[user-es@server ~]$ cd /elk/elasticsearch-8.15.4/
[user-es@server elasticsearch-8.15.4]$ ll
total 2260
drwxr-xr-x  2 user-es user-es    4096 Nov  7 17:42 bin
drwxr-xr-x  3 user-es user-es     210 Nov 15 15:28 config
drwxr-xr-x  8 user-es user-es      96 Nov  7 17:42 jdk
drwxr-xr-x  6 user-es user-es    4096 Nov  7 17:42 lib
-rw-r--r--  1 user-es user-es    3860 Nov  7 17:35 LICENSE.txt
drwxr-xr-x  2 user-es user-es       6 Nov  7 17:37 logs
drwxr-xr-x 83 user-es user-es    4096 Nov  7 17:42 modules
-rw-r--r--  1 user-es user-es 2285006 Nov  7 17:37 NOTICE.txt
drwxr-xr-x  2 user-es user-es       6 Nov  7 17:37 plugins
-rw-r--r--  1 user-es user-es   10156 Nov  7 17:35 README.asciidoc
启动服务成功后,记录一下最后输出的密码和密钥
bash
[user-es@server elasticsearch-8.15.4]$ ./bin/elasticsearch
...
...
✅ Elasticsearch security features have been automatically configured!
✅ Authentication is enabled and cluster connections are encrypted.

ℹ️  Password for the elastic user (reset with `bin/elasticsearch-reset-password -u elastic`):
  sL=UaxXXma1MvHkYL2KN

ℹ️  HTTP CA certificate SHA-256 fingerprint:
  1588a660008e333c1c80e525323440b153515689f63c7bc9399f4e5948ed0fe4

ℹ️  Configure Kibana to use this cluster:
• Run Kibana and click the configuration link in the terminal when Kibana starts.
• Copy the following enrollment token and paste it into Kibana in your browser (valid for the next 30 minutes):
  eyJ2ZXIiOiI4LjE0LjAiLCJhZHIiOlsiMTkyLjE2OC41Ni4xMzU6OTIwMCJdLCJmZ3IiOiIxNTg4YTY2MDAwOGUzMzNjMWM4MGU1MjUzMjM0NDBiMTUzNTE1Njg5ZjYzYzdiYzkzOTlmNGU1OTQ4ZWQwZmU0Iiwia2V5IjoiTl9pOExwTUJKWmt2dWNHbVVrOVE6c0xFVlZvbzFRVGluY1RZVzRONWxrZyJ9

ℹ️ Configure other nodes to join this cluster:
• Copy the following enrollment token and start new Elasticsearch nodes with `bin/elasticsearch --enrollment-token <token>` (valid for the next 30 minutes):
  eyJ2ZXIiOiI4LjE0LjAiLCJhZHIiOlsiMTkyLjE2OC41Ni4xMzU6OTIwMCJdLCJmZ3IiOiIxNTg4YTY2MDAwOGUzMzNjMWM4MGU1MjUzMjM0NDBiMTUzNTE1Njg5ZjYzYzdiYzkzOTlmNGU1OTQ4ZWQwZmU0Iiwia2V5IjoiTmZpOExwTUJKWmt2dWNHbVVrOU46Z0dMSjhsSC1TdUc0MVpYYUhZWDY2QSJ9

  If you're running in Docker, copy the enrollment token and run:
  `docker run -e "ENROLLMENT_TOKEN=<token>" docker.elastic.co/elasticsearch/elasticsearch:8.15.4`
停掉之后重新后台运行, -d 参数是后台运行,第一次执行不要加-d,需要记录最后返回的密码和ca证书的信息
bash
[user-es@server elasticsearch-8.15.4]$ ./bin/elasticsearch -d启动成功后可查看端口情况9200和9300端口
如果失败可以查以下链接解决
Linux环境下安装Elasticsearch,史上最详细的教程来啦~_linux elasticsearch-CSDN博客
bash
[root@server ~]# netstat -ntpl
Active Internet connections (only servers)
Proto Recv-Q Send-Q Local Address Foreign Address State PID/Program name
tcp 0 0 0.0.0.0:22 0.0.0.0:* LISTEN 1418/sshd
tcp 0 0 127.0.0.1:25 0.0.0.0:* LISTEN 1644/master
tcp6 0 0 127.0.0.1:9300 :::* LISTEN 4455/java
tcp6 0 0 ::1:9300 :::* LISTEN 4455/java
tcp6 0 0 :::22 :::* LISTEN 1418/sshd
tcp6 0 0 ::1:25 :::* LISTEN 1644/master
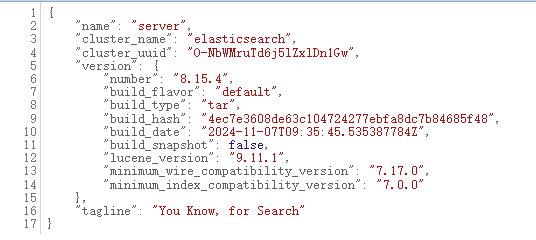
tcp6 0 0 :::9200 :::* LISTEN 4455/java 浏览器访问https://ip地址:9200端口,账号密码在启动时的最后有展示
bash
Password for the elastic user (reset with `bin/elasticsearch-reset-password -u elastic`):
  zgPgb3EPuflSKVBwT3wu

账号:elastic
密码:zgPgb3EPuflSKVBwT3wu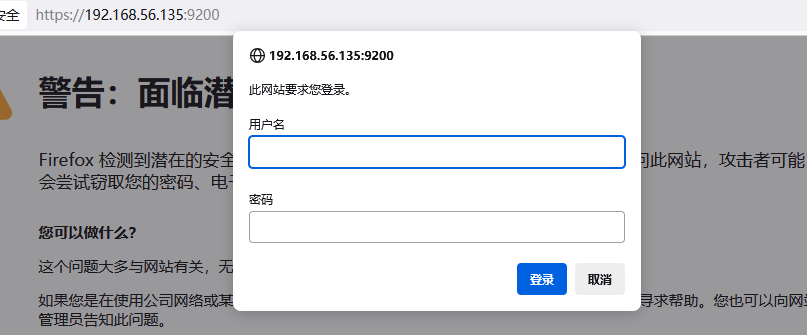
elasticsearch8.x启用了安全模块
在配置文件
config/elasticsearch.yml中可以查看
bash
# Enable security features
xpack.security.enabled: true

xpack.security.enrollment.enabled: true

# Enable encryption for HTTP API client connections, such as Kibana, Logstash, and Agents
xpack.security.http.ssl:
  enabled: true
  keystore.path: certs/http.p12

# Enable encryption and mutual authentication between cluster nodes
xpack.security.transport.ssl:
  enabled: true
  verification_mode: certificate
  keystore.path: certs/transport.p12
  truststore.path: certs/transport.p12
# Create a new cluster with the current node only
# Additional nodes can still join the cluster later
cluster.initial_master_nodes: ["node-1"]
如果没记住启动时的账号密码可以使用工具生成
bash
使用 bin/elasticsearch-reset-password 可以修改密码,通常有两种方式:
# 生成随机密码
./elasticsearch-reset-password -u elastic

# 指定密码
./elasticsearch-reset-password -u elastic -i
安装Kibana
Kibana 版本选择和 Elasticsearch 的版本一致即可,官方提供了一致的版本。
安装和Elasticsearch基本相似
修改配置文件
退回到root用户,进入kibana-8.15.4目录中修改配置文件
bash
[root@server kibana-8.15.4]# vi config/kibana.yml
# 修改server.host 改为0.0.0.0 使其能够外网访问
server.host: "0.0.0.0"

# 启动中文
i18n.locale: "zh-CN"
启动服务
给目录赋权普通用户并使用普通用户启动
bash
[root@server elk]#  chown user-es:user-es -R kibana-8.15.4/
[root@server elk]# su - user-es

[user-es@server ~]$ cd /elk/kibana-8.15.4/
[user-es@server kibana-8.15.4]$ ./bin/kibana
...
...
[2024-11-15T15:40:30.812+08:00][INFO ][root] Kibana is starting
[2024-11-15T15:40:30.855+08:00][INFO ][node] Kibana process configured with roles: [background_tasks, ui]
[2024-11-15T15:40:40.498+08:00][INFO ][plugins-service] The following plugins are disabled: "cloudChat,cloudExperiments,cloudFullStory,profilingDataAccess,profiling,securitySolutionServerless,serverless,serverlessObservability,serverlessSearch".
[2024-11-15T15:40:40.573+08:00][INFO ][http.server.Preboot] http server running at http://0.0.0.0:5601
[2024-11-15T15:40:40.852+08:00][INFO ][plugins-system.preboot] Setting up [1] plugins: [interactiveSetup]
[2024-11-15T15:40:40.869+08:00][INFO ][preboot] "interactiveSetup" plugin is holding setup: Validating Elasticsearch connection configuration...
[2024-11-15T15:40:40.908+08:00][INFO ][root] Holding setup until preboot stage is completed.
i Kibana has not been configured.

Go to http://0.0.0.0:5601/?code=609695 to get started.

# 后台启动方法
[user-es@server kibana-8.15.4]$ nohup ./bin/kibana &直接使用root启动会报错Kibana should not be run as root. Use --allow-root to continue.,但是可以加上--allow-root参数忽略
bash
[root@server kibana-8.15.4]# ./bin/kibana
Kibana is currently running with legacy OpenSSL providers enabled! For details and instructions on how to disable see https://www.elastic.co/guide/en/kibana/8.15/production.html#openssl-legacy-provider
Kibana should not be run as root.  Use --allow-root to continue.

# 可以直接忽略启动
[root@server kibana-8.15.4]# ./bin/kibana --allow-root

[2024-11-14T15:21:50.455+08:00][INFO ][root] Kibana is starting
[2024-11-14T15:21:50.508+08:00][INFO ][node] Kibana process configured with roles: [background_tasks, ui]
[2024-11-14T15:22:02.328+08:00][INFO ][plugins-service] The following plugins are disabled: "cloudChat,cloudExperiments,cloudFullStory,profilingDataAccess,profiling,securitySolutionServerless,serverless,serverlessObservability,serverlessSearch".
[2024-11-14T15:22:02.409+08:00][INFO ][http.server.Preboot] http server running at http://0.0.0.0:5601
[2024-11-14T15:22:02.715+08:00][INFO ][plugins-system.preboot] Setting up [1] plugins: [interactiveSetup]
[2024-11-14T15:22:02.734+08:00][INFO ][preboot] "interactiveSetup" plugin is holding setup: Validating Elasticsearch connection configuration...
[2024-11-14T15:22:02.773+08:00][INFO ][root] Holding setup until preboot stage is completed.


i Kibana has not been configured.

Go to http://0.0.0.0:5601/?code=337222 to get started.

# 后台启动命令
 nohup ./bin/kibana --allow-root &
启动成功后访问5601端口,需要我们使用令牌进行注册
注册elasticsearch
令牌可以使用elasticsearch-create-enrollment-token 命令为 Elasticsearch 节点和 Kibana 实例创建注册令牌:
实际上在启动es的时候最后展示的结果中也有内容,但是30分钟如果不用的话会失效,失效之后也可以使用上面的命令创建一个新的
bash
# elasticsearch启动中返回的令牌
ℹ️  Configure Kibana to use this cluster:
• Run Kibana and click the configuration link in the terminal when Kibana starts.
• Copy the following enrollment token and paste it into Kibana in your browser (valid for the next 30 minutes):
  eyJ2ZXIiOiI4LjE0LjAiLCJhZHIiOlsiMTkyLjE2OC41Ni4xMzU6OTIwMCJdLCJmZ3IiOiIxNTg4YTY2MDAwOGUzMzNjMWM4MGU1MjUzMjM0NDBiMTUzNTE1Njg5ZjYzYzdiYzkzOTlmNGU1OTQ4ZWQwZmU0Iiwia2V5IjoiTl9pOExwTUJKWmt2dWNHbVVrOVE6c0xFVlZvbzFRVGluY1RZVzRONWxrZyJ9
创建新的令牌,直接执行发现需要指定参数
bash
[user-es@server bin]$ ./elasticsearch-create-enrollment-token
warning: ignoring JAVA_HOME=/usr/local/jdk-21.0.5; using bundled JDK
Creates enrollment tokens for elasticsearch nodes and kibana instances
Option (* = required) Description
--------------------- -----------
-E <KeyValuePair> Configure a setting
-f, --force Use this option to force execution of the command
against a cluster that is currently unhealthy.
-h, --help Show help
* -s, --scope The scope of this enrollment token, can be either "node"
or "kibana"
--url the URL where the elasticsearch node listens for
connections.
-v, --verbose Show verbose output
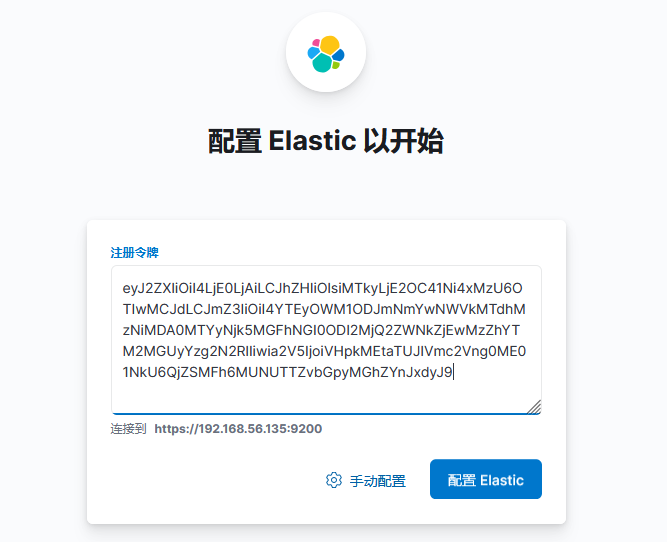
ERROR: Missing required option(s) [s/scope]提示 -s 为必填项,这里我们是要将kibana 加入,所以可以这样创建 token:
bash
[user-es@server bin]$ ./elasticsearch-create-enrollment-token -s kibana
warning: ignoring JAVA_HOME=/usr/local/jdk-21.0.5; using bundled JDK
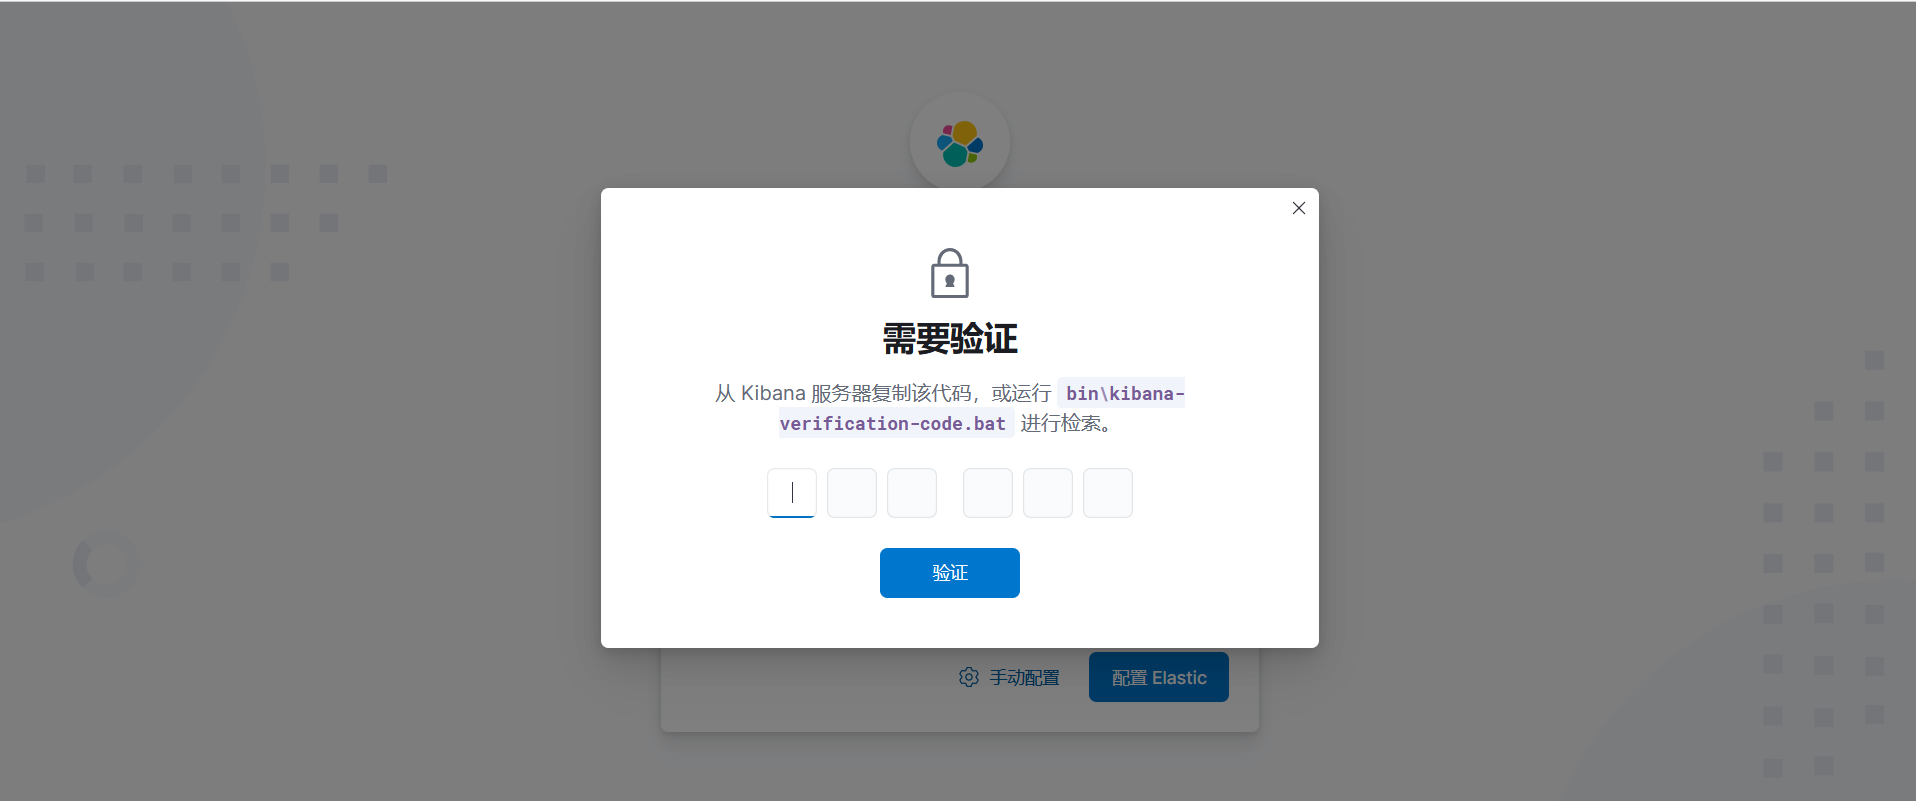
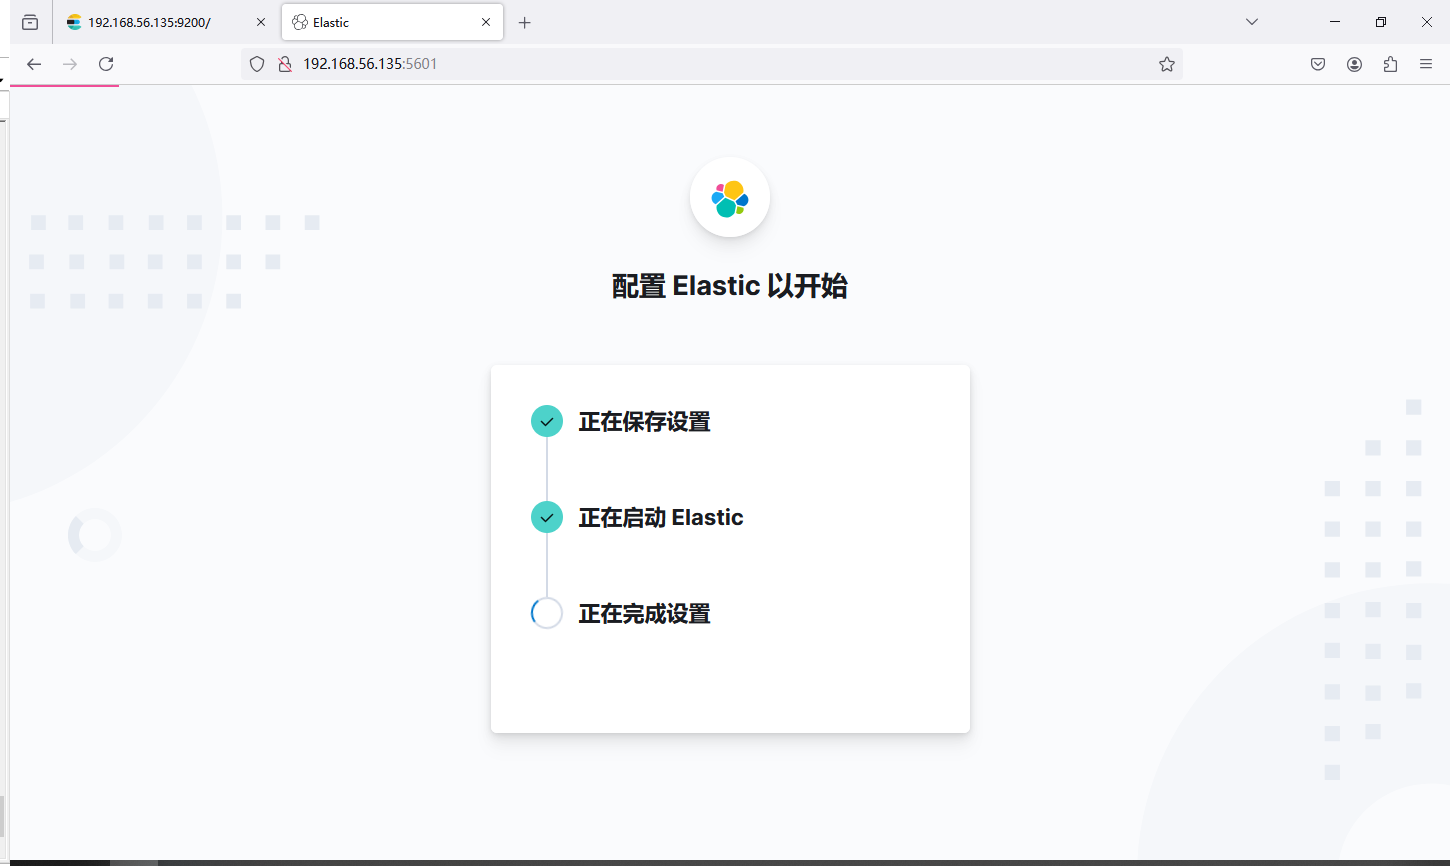
eyJ2ZXIiOiI4LjE0LjAiLCJhZHIiOlsiMTkyLjE2OC41Ni4xMzU6OTIwMCJdLCJmZ3IiOiI4YTEyOWM1ODJmNmYwNWVkMTdhMzNiMDA0MTYyNjk5MGFhNGI0ODI2MjQ2ZWNkZjEwMzZhYTM2MGUyYzg2N2RlIiwia2V5IjoiRzBTV0taTUJtUExTNWJ4TEFDTjA6bmJ5TDlIcjZUcENQSWJGQWlDTV9WdyJ9点击配置之后会让输入验证码,前台启动的话会在控制台打印出来,后台启动可以查看nohup日志最后获取
bash
Your verification code is: 609 695 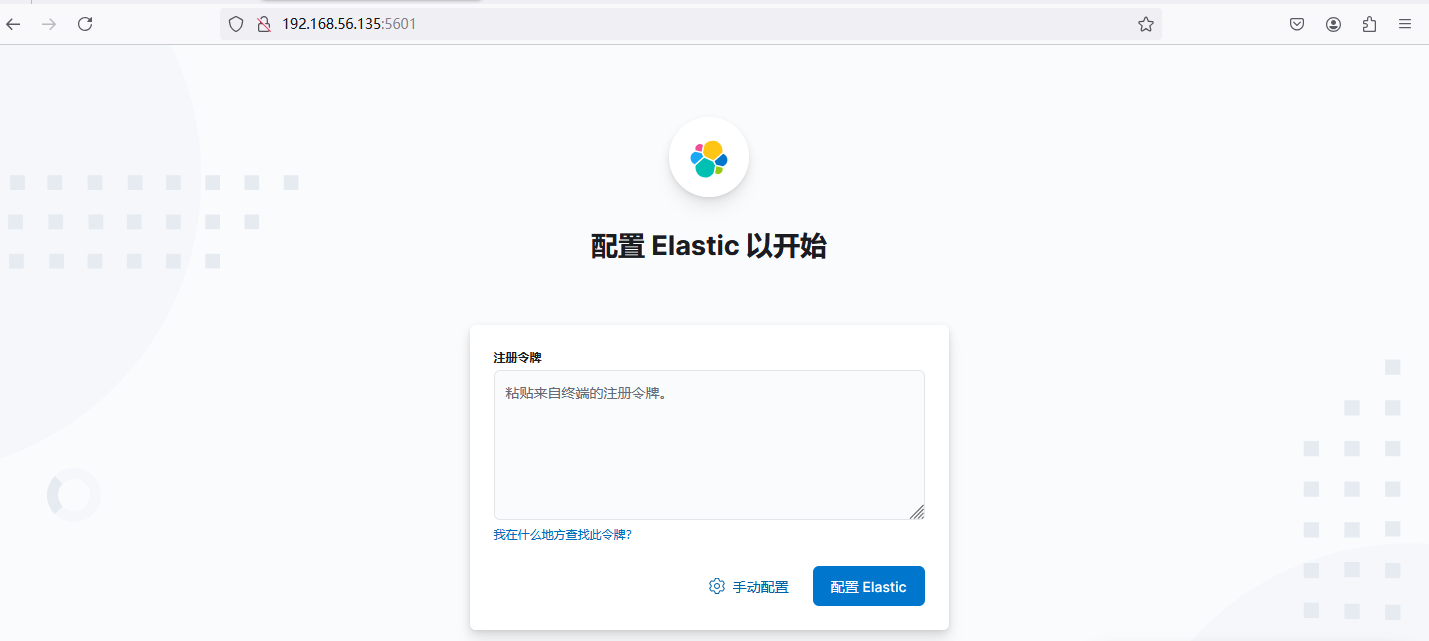
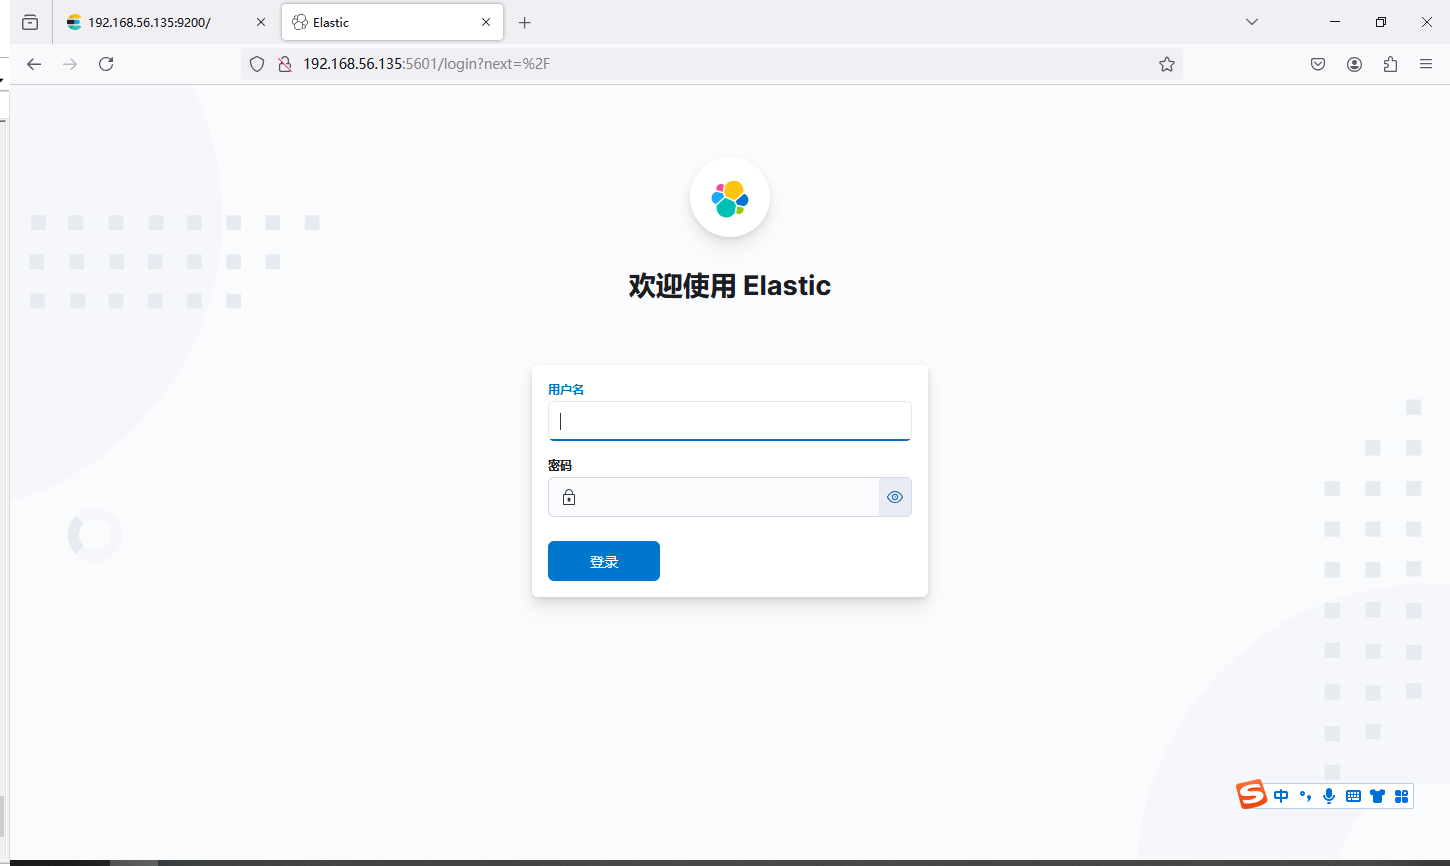
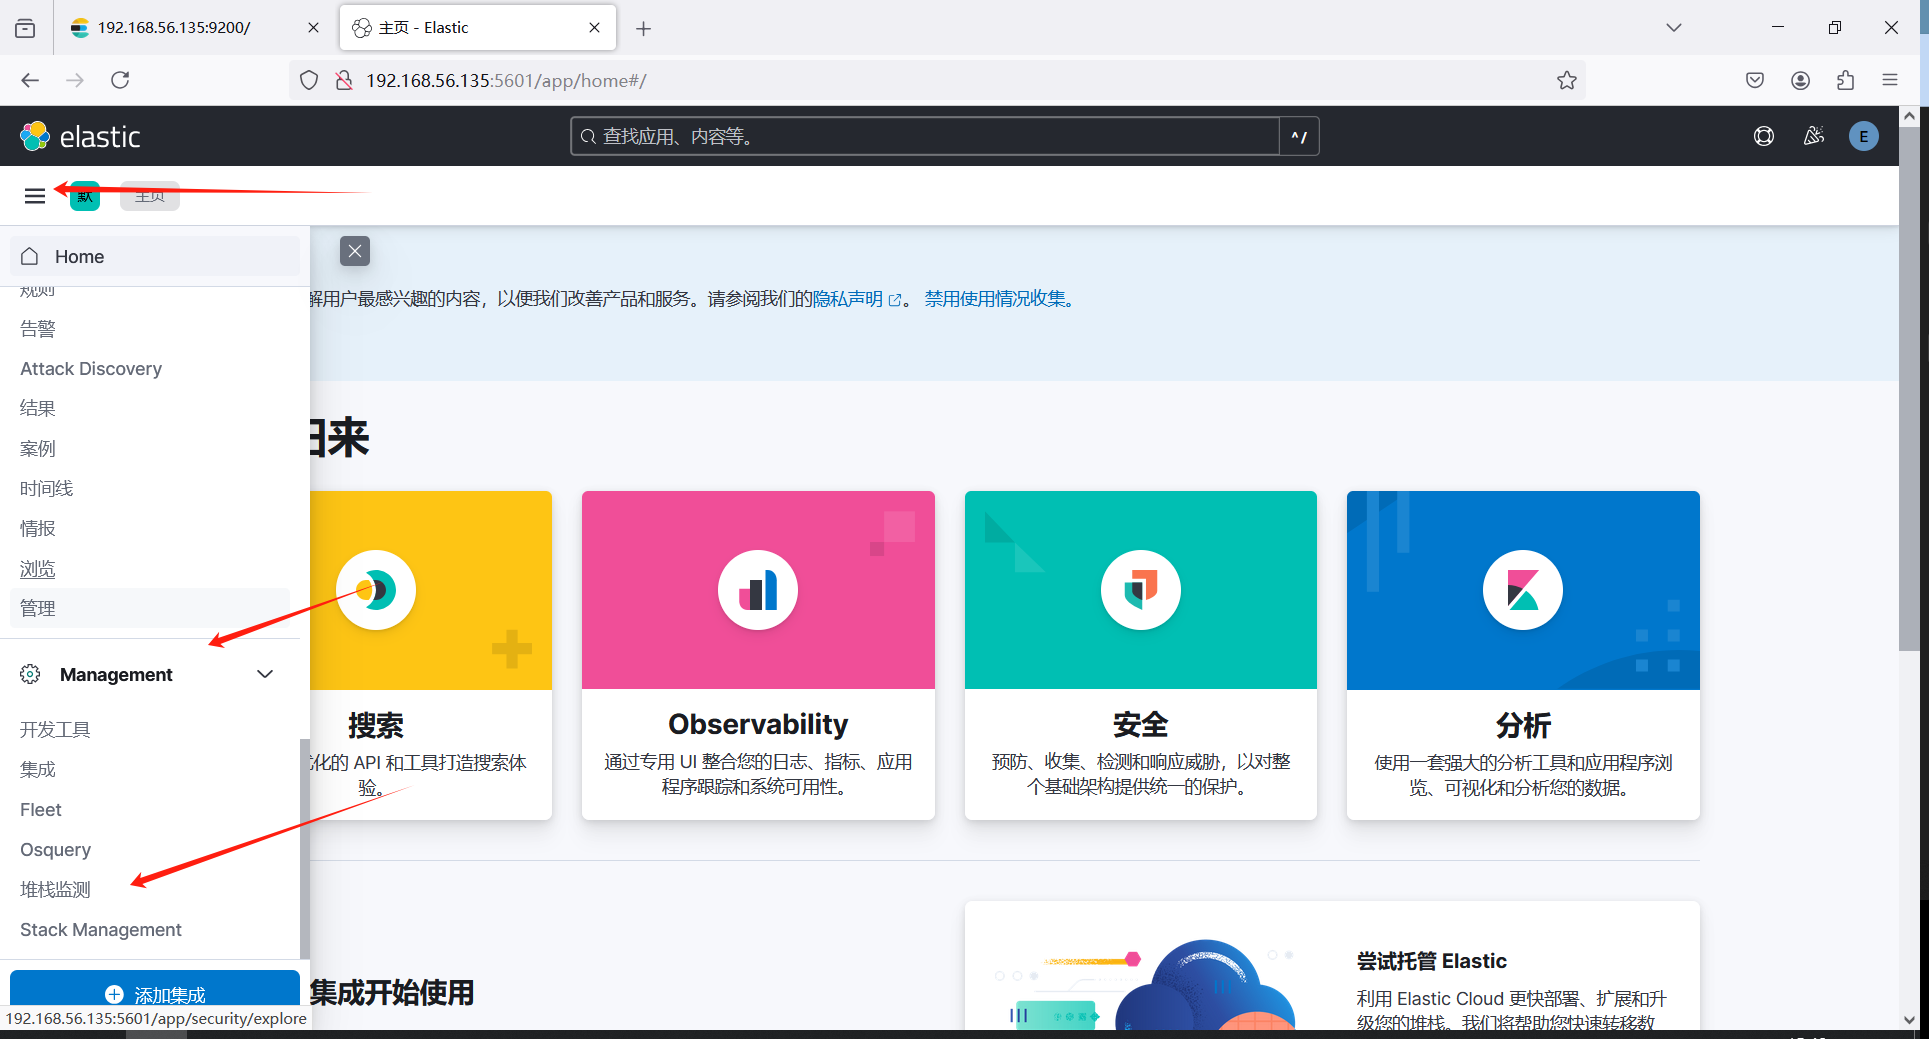
完成配置之后会跳转到登录界面,用户名称和密码和elasticsearch的一样
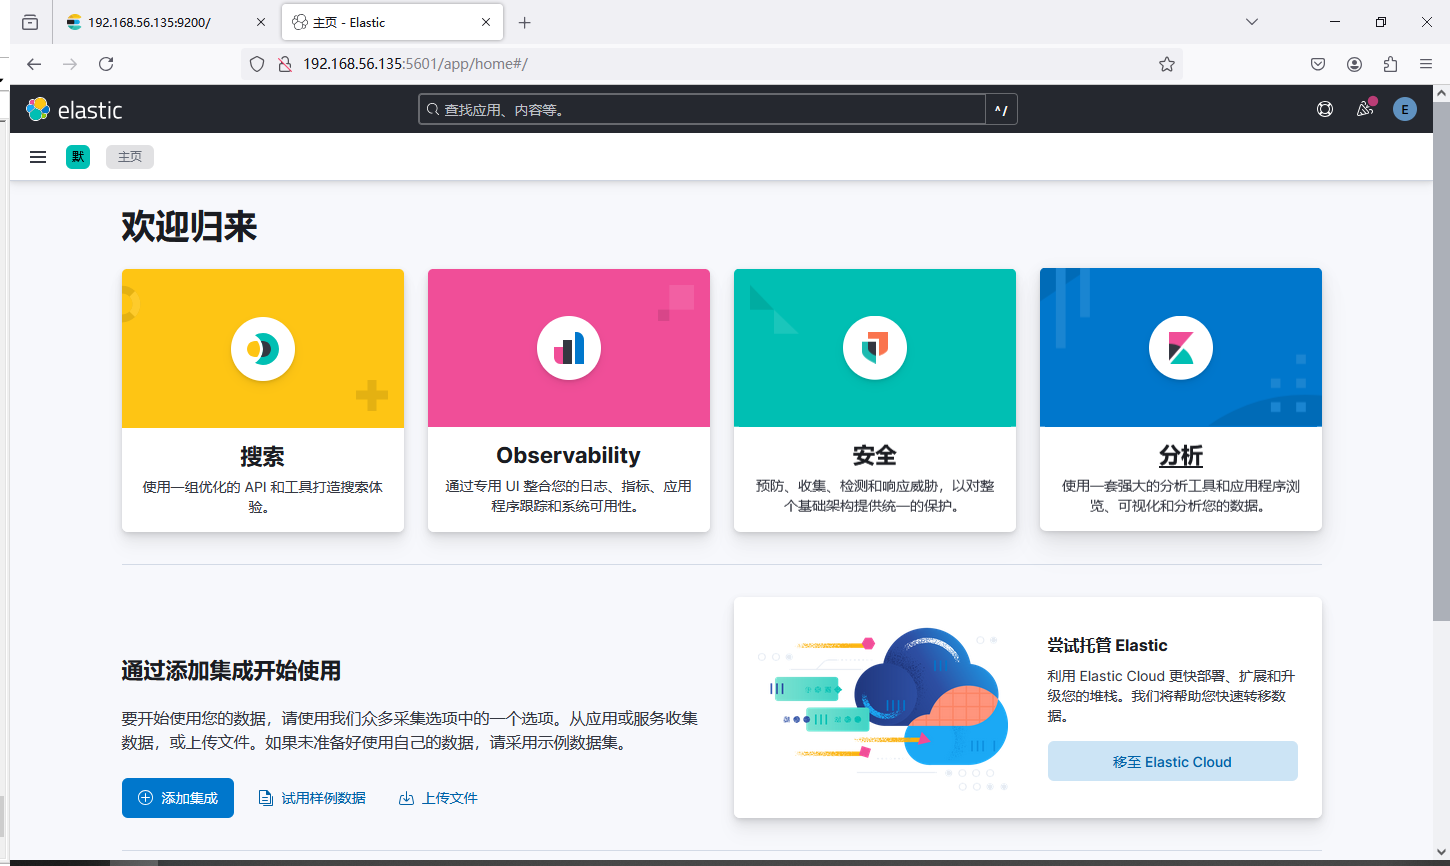
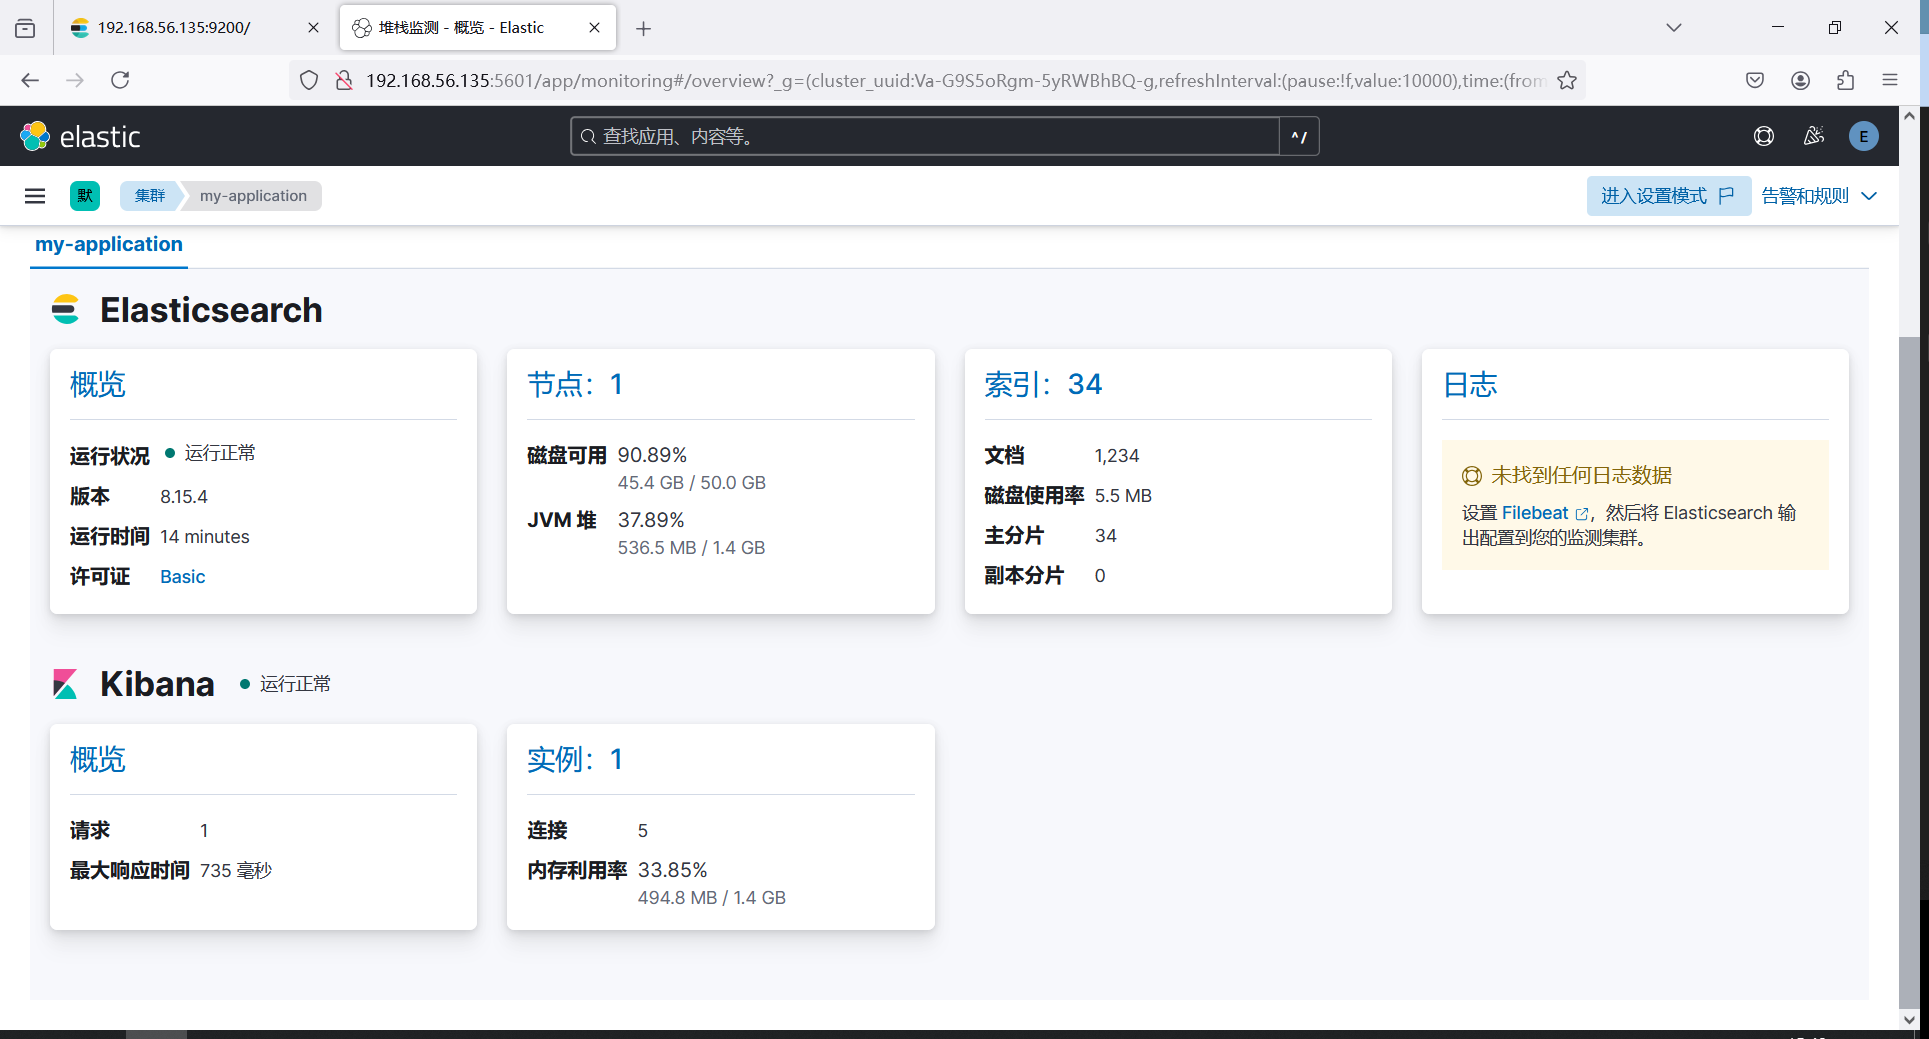
登录之后可以进入左上角的菜单 - Managerment - 堆栈检测中查看集群的状态
安装 Logstash
Logstash,直接下载安装包解压使用即可。版本需要和es、kibana一致
修改配置文件以及拷贝证书
退回到root用户,logstash可以直接使用root运行,进到目录中修改一下配置文件
bash
[root@server ~]# cd /elk/logstash-8.15.4/
[root@server logstash-8.15.4]# cd config/

#拷贝es目录下certs文件夹里到config下面有相关认证证书
[root@server config]# cp -rf /elk/elasticsearch-8.15.4/config/certs/ .
[root@server config]# ll certs/
total 24
-rw-r----- 1 root root  1915 Nov 15 15:51 http_ca.crt
-rw-r----- 1 root root 10029 Nov 15 15:51 http.p12
-rw-r----- 1 root root  5822 Nov 15 15:51 transport.p12
# 修改配置文件
[root@server config]$ vim logstash.yml
http.host: "0.0.0.0"
# 开启认证并填入elasticsearch账号密码
xpack.monitoring.enabled: true
xpack.monitoring.elasticsearch.username: "elastic"
xpack.monitoring.elasticsearch.password: "sL=UaxXXma1MvHkYL2KN"
# elasticsearch主机的地址
xpack.monitoring.elasticsearch.hosts: ["https://192.168.56.135:9200"]
# 将从elasticsearch目录中拷贝过来的证书填入
xpack.monitoring.elasticsearch.ssl.certificate_authority: "/elk/logstash-8.15.4/config/certs/http_ca.crt"
# ca_trusted_fingerprint获取方法,es启动时HTTP CA certificate SHA-256 fingerprint的值,或者查看kibana配置文件中有写
xpack.monitoring.elasticsearch.ssl.ca_trusted_fingerprint: 1588a660008e333c1c80e525323440b153515689f63c7bc9399f4e5948ed0fe4
修改输入输出配置文件
logstash需要配置一下才可以接收和输出日志,拷贝一份logstash-sample.conf进行修改
bash
[root@server config]# cp logstash-sample.conf logstash.conf
[root@server config]# cat logstash.conf
input {
  beats {
    port => 5044
  }
}

# 过滤相关内容
filter {
        grok{
             # 获取日志信息之后提取时间并赋予字段logdate
                match => {"message" => "%{SYSLOGTIMESTAMP:logdate}"}
           }
        # 使用date模块将日志中时间logdate值赋予@timestamp;@timestamp字段是es默认的索引字段,可以使用其进行排序
        date{
           match => [ "logdate", "MMM dd HH:mm:ss"]
           locale => "en"
          # add_tag => "@timestamp"
           target => "@timestamp"
           timezone => "Asia/Shanghai"
        }
      # 删除logdate 字段,不然会存在重复的时间字段,不删也行
       mutate{
           remove_field => ["logdate"]
        }
}

# 将数据输出到es中
output {
  elasticsearch {
  # 主机地址
    hosts => ["https://192.168.56.135:9200"]
  # 索引名称
    index => "newtime-es-%{+YYYY.MM.dd}"
    ssl => true
    ssl_certificate_verification => false
    # es的账号密码以及ca证书填入
    cacert => "/elk/logstash-8.15.4/config/certs/http_ca.crt"
    ca_trusted_fingerprint => "1588a660008e333c1c80e525323440b153515689f63c7bc9399f4e5948ed0fe4"
    user => "elastic"
    password => "sL=UaxXXma1MvHkYL2KN"
  }
}
启动logstash
bash
[root@server config]# ../bin/logstash -f logstash.conf
# 后台启动命令
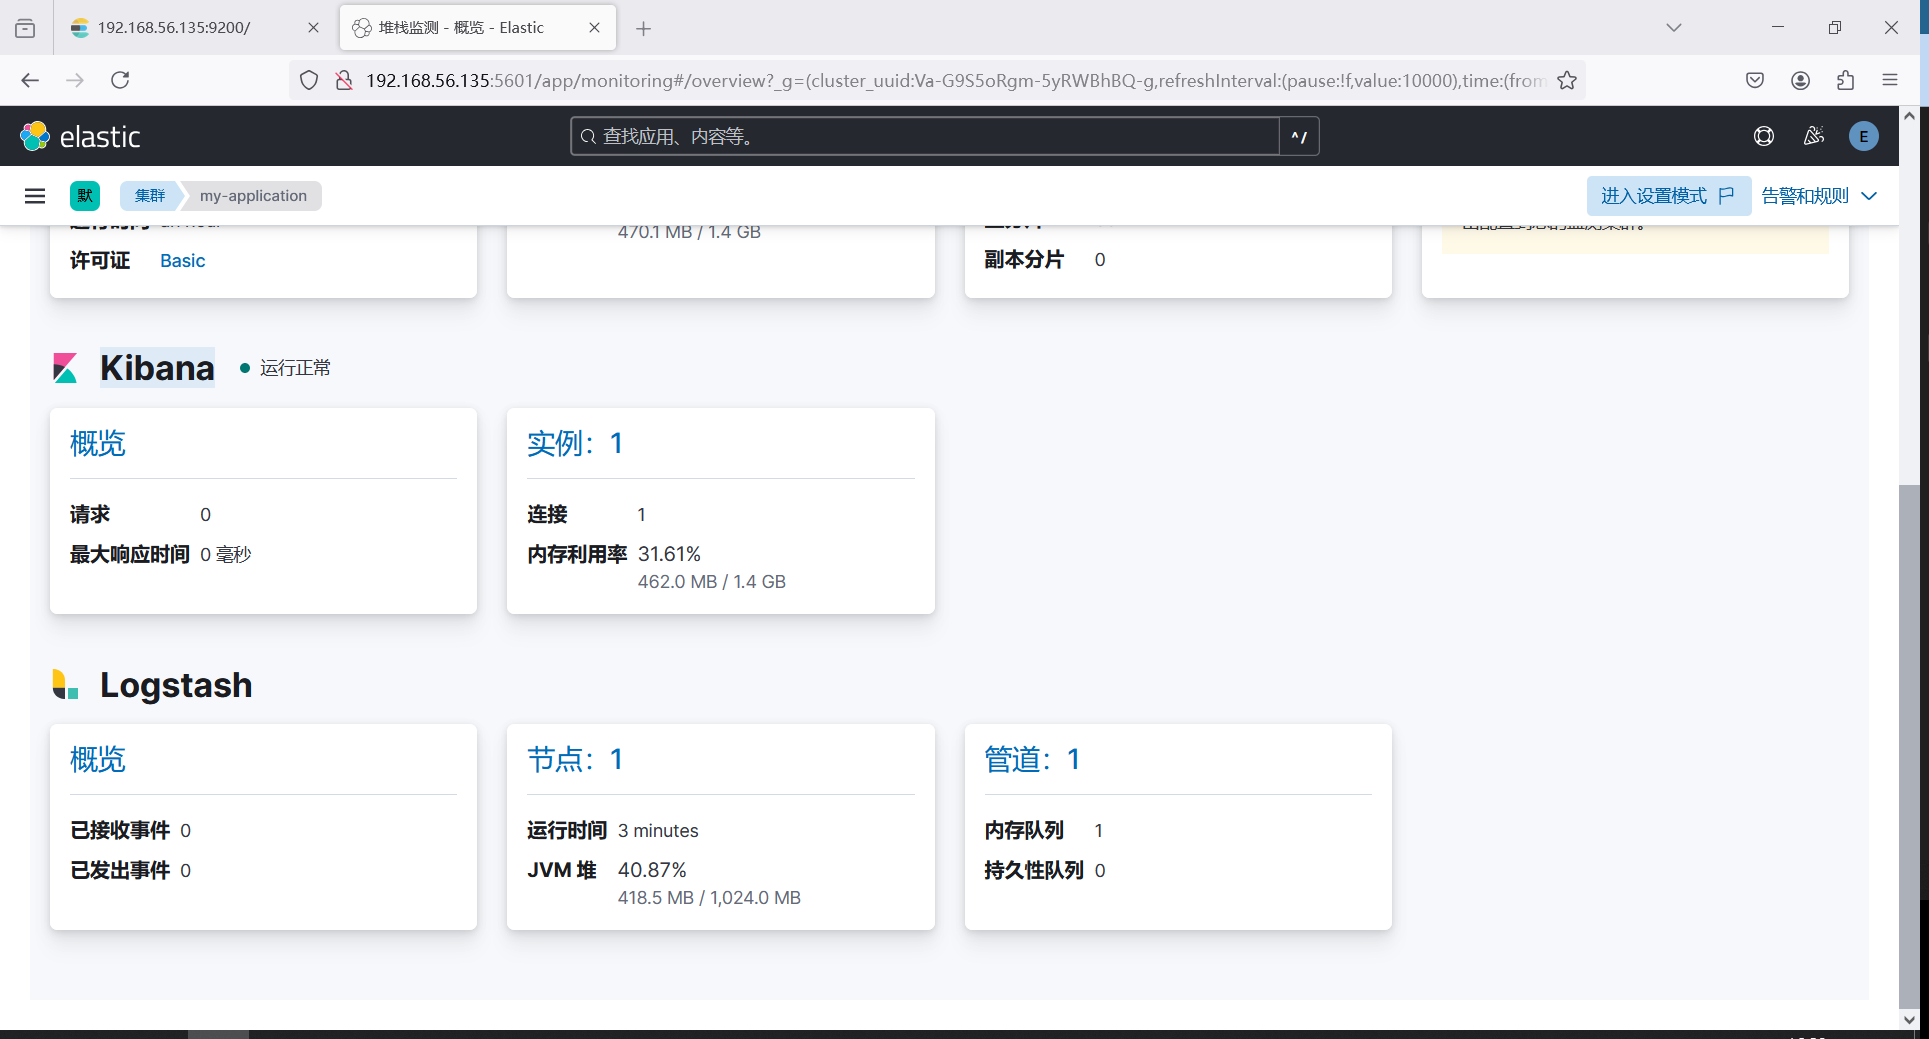
nohup ../bin/logstash -f logstash.conf &启动成功之后可以在Kibana中看到logstash
安装filebeat
filebeat用于采集日志,吐给logstash去做数据清洗
修改配置文件
bash
[root@server ~]# cd /elk/filebeat-8.15.4-linux-x86_64/

[root@server filebeat-8.15.4-linux-x86_64]# vim filebeat.yml

filebeat.inputs:
- type: log
  enabled: true
  # 获取日志的文件
  paths:
    - /var/log/test.log
output.logstash:
  enabled: true
  hosts: ["192.168.56.135:5044"]
启动服务
bash
[root@server filebeat-8.15.4-linux-x86_64]# ./filebeat -e -c filebeat.yml


# 后台启动
nohup ./filebeat -e -c filebeat.yml &
数据测试
bash
# 将系统message日志输入到
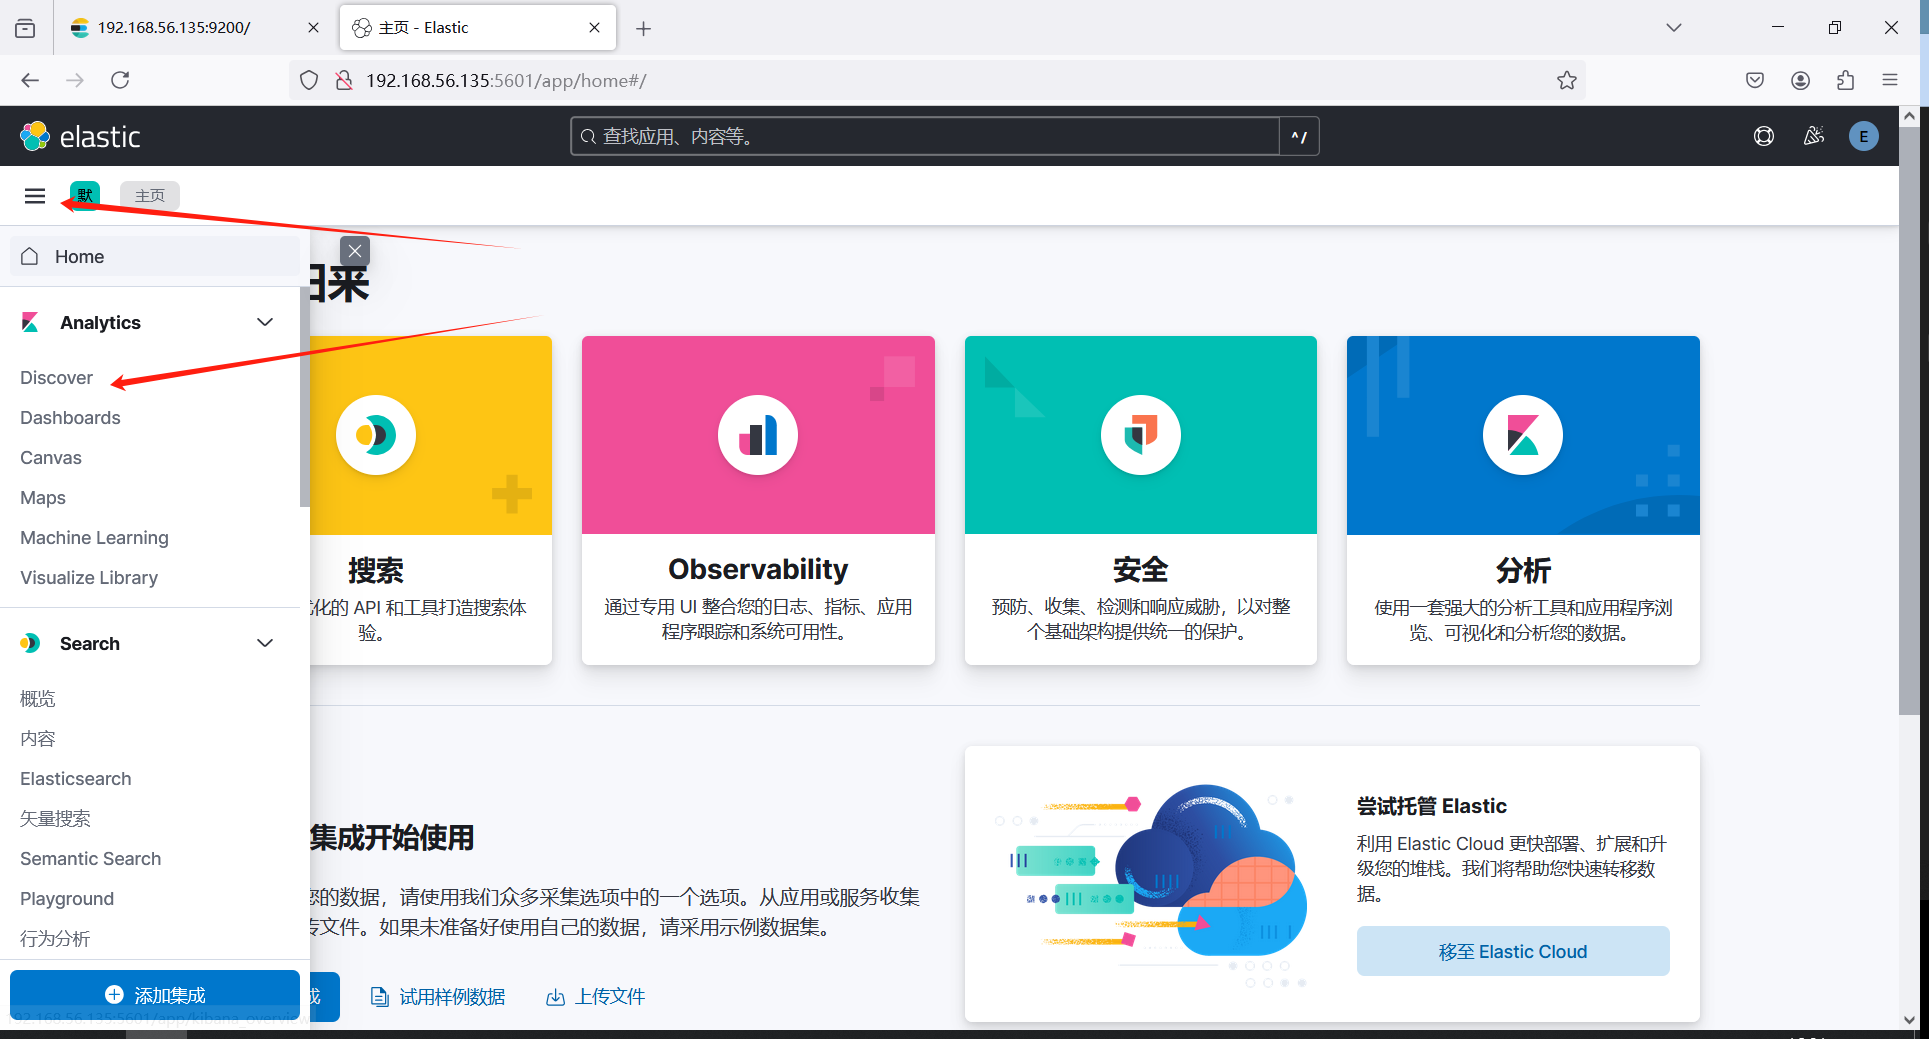
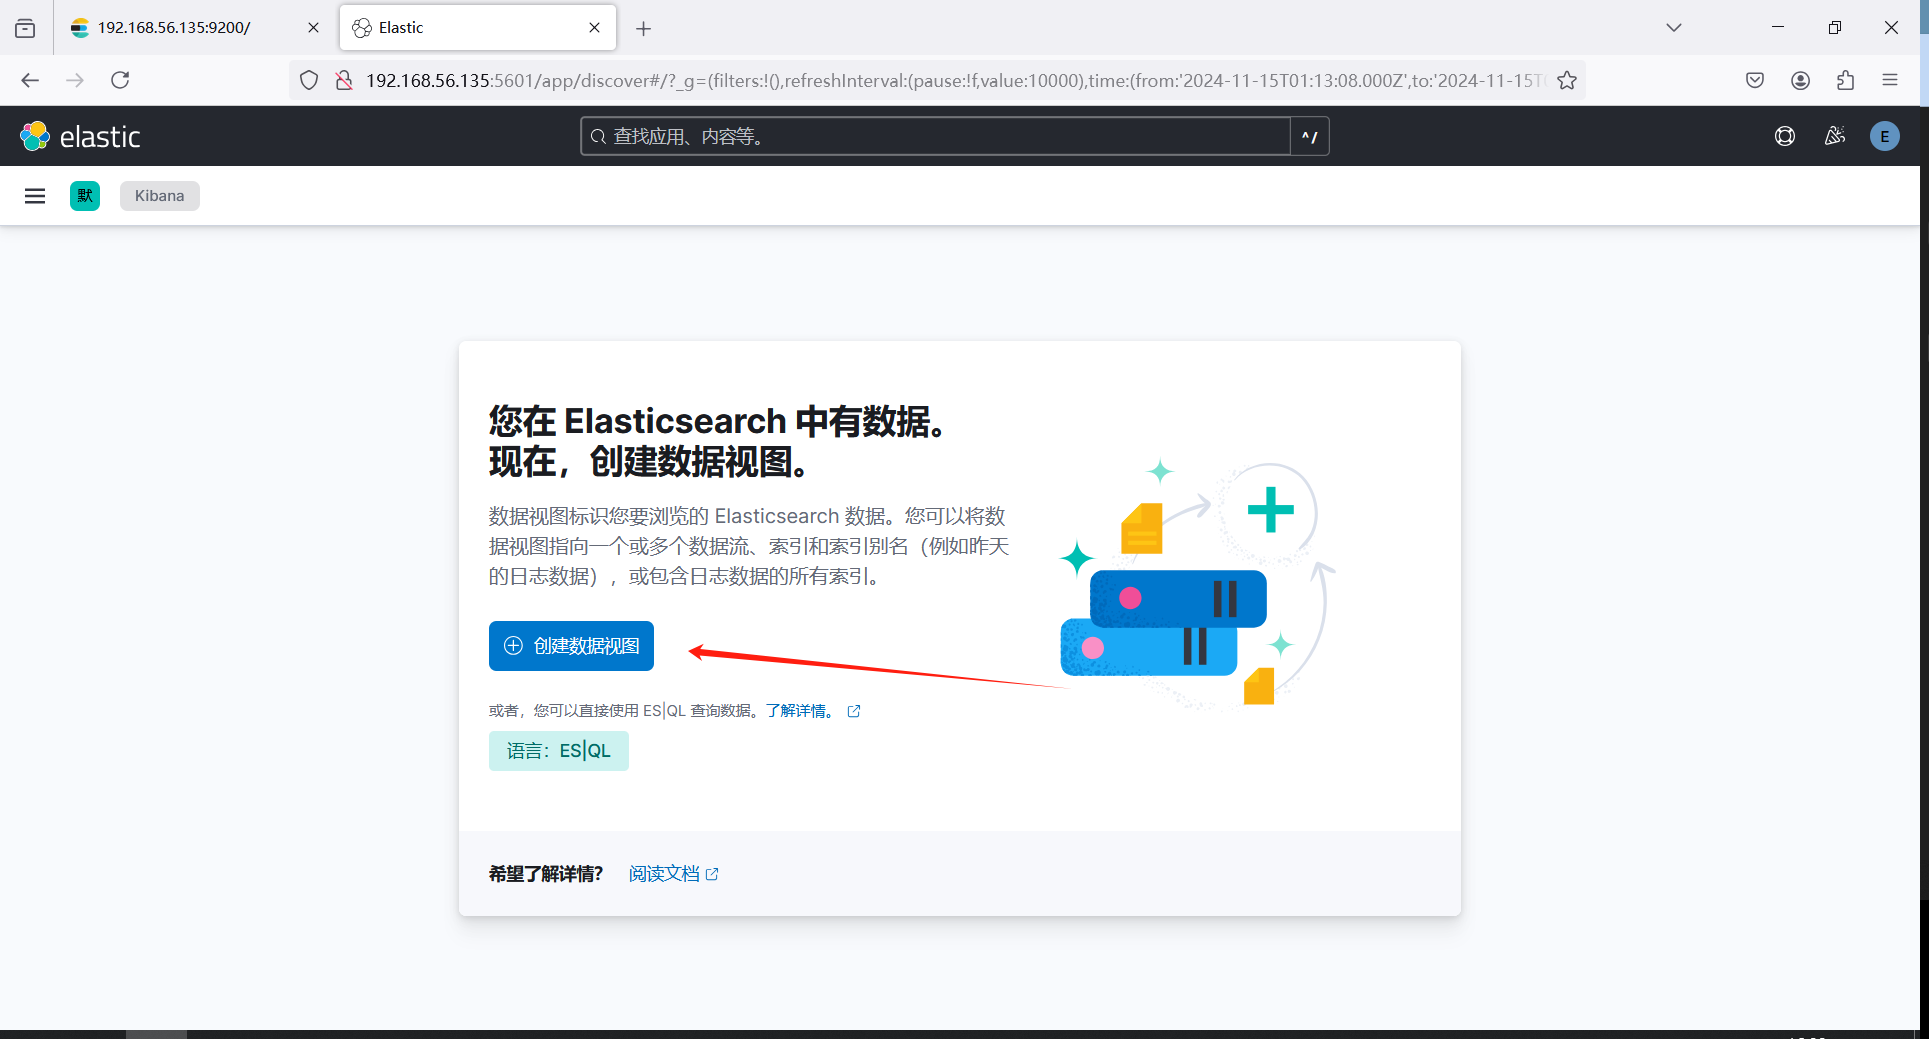
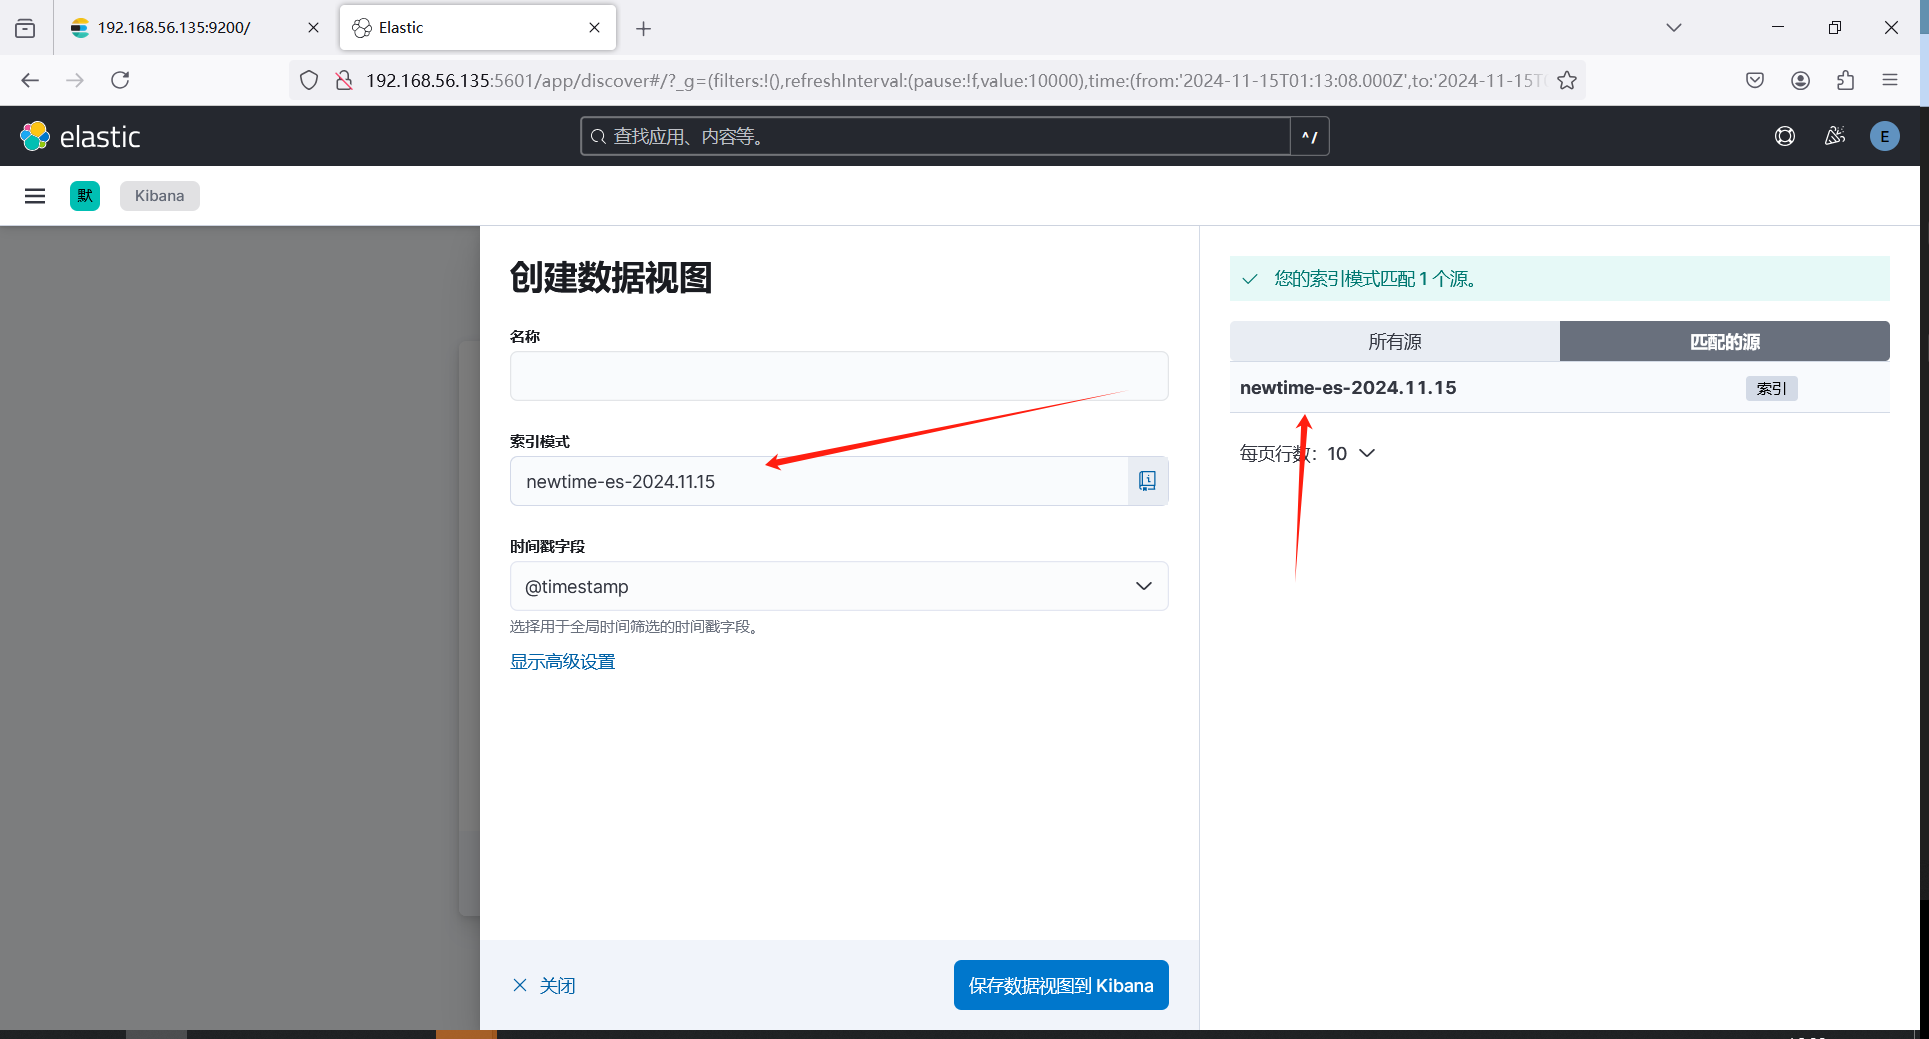
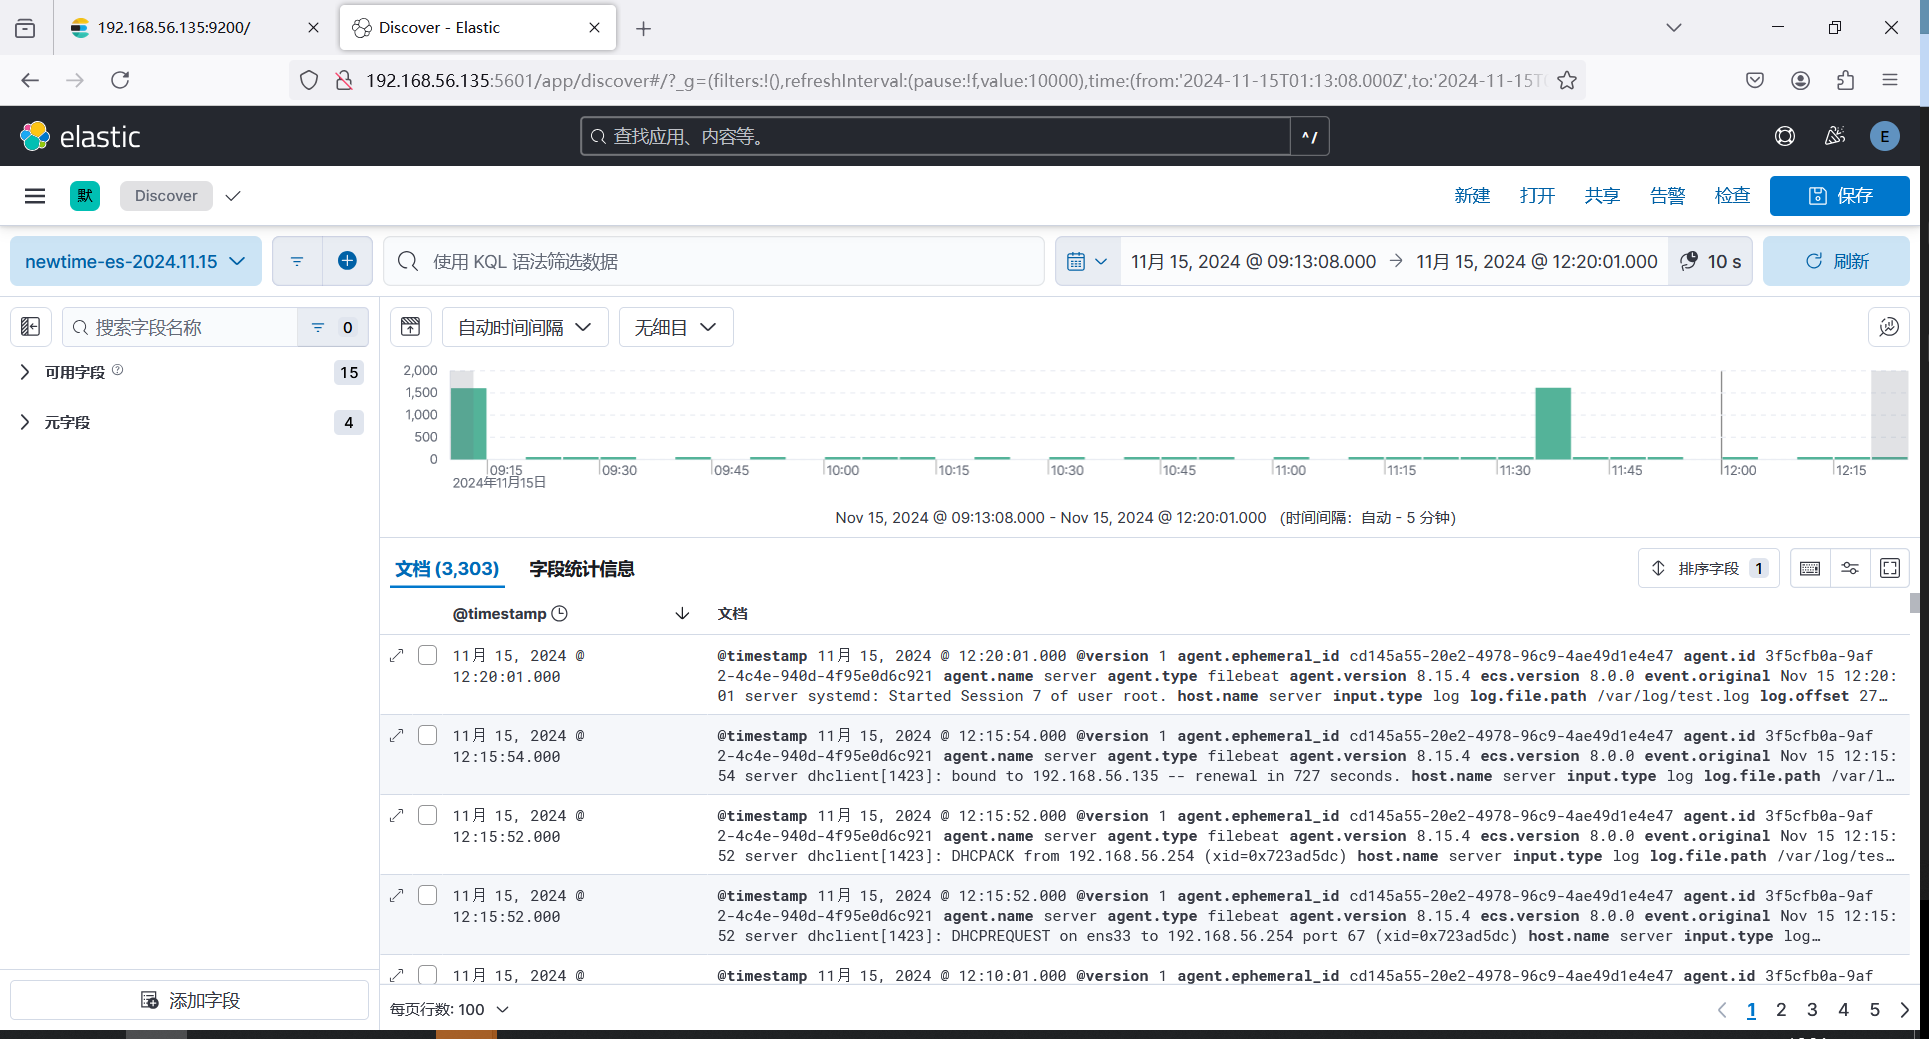
[root@server log]# cat /var/log/messages > /var/log/test.log 进入Kibana页面 菜单 - Discover;创建一个数据视图,索引模式是在logstash.conf中配置的名称,填写完毕后保存即可看到日志信息