
✨✨ Rqtz 个人主页 : ****************点击************✨✨
🌈 Qt系列专栏:点击****

软件介绍
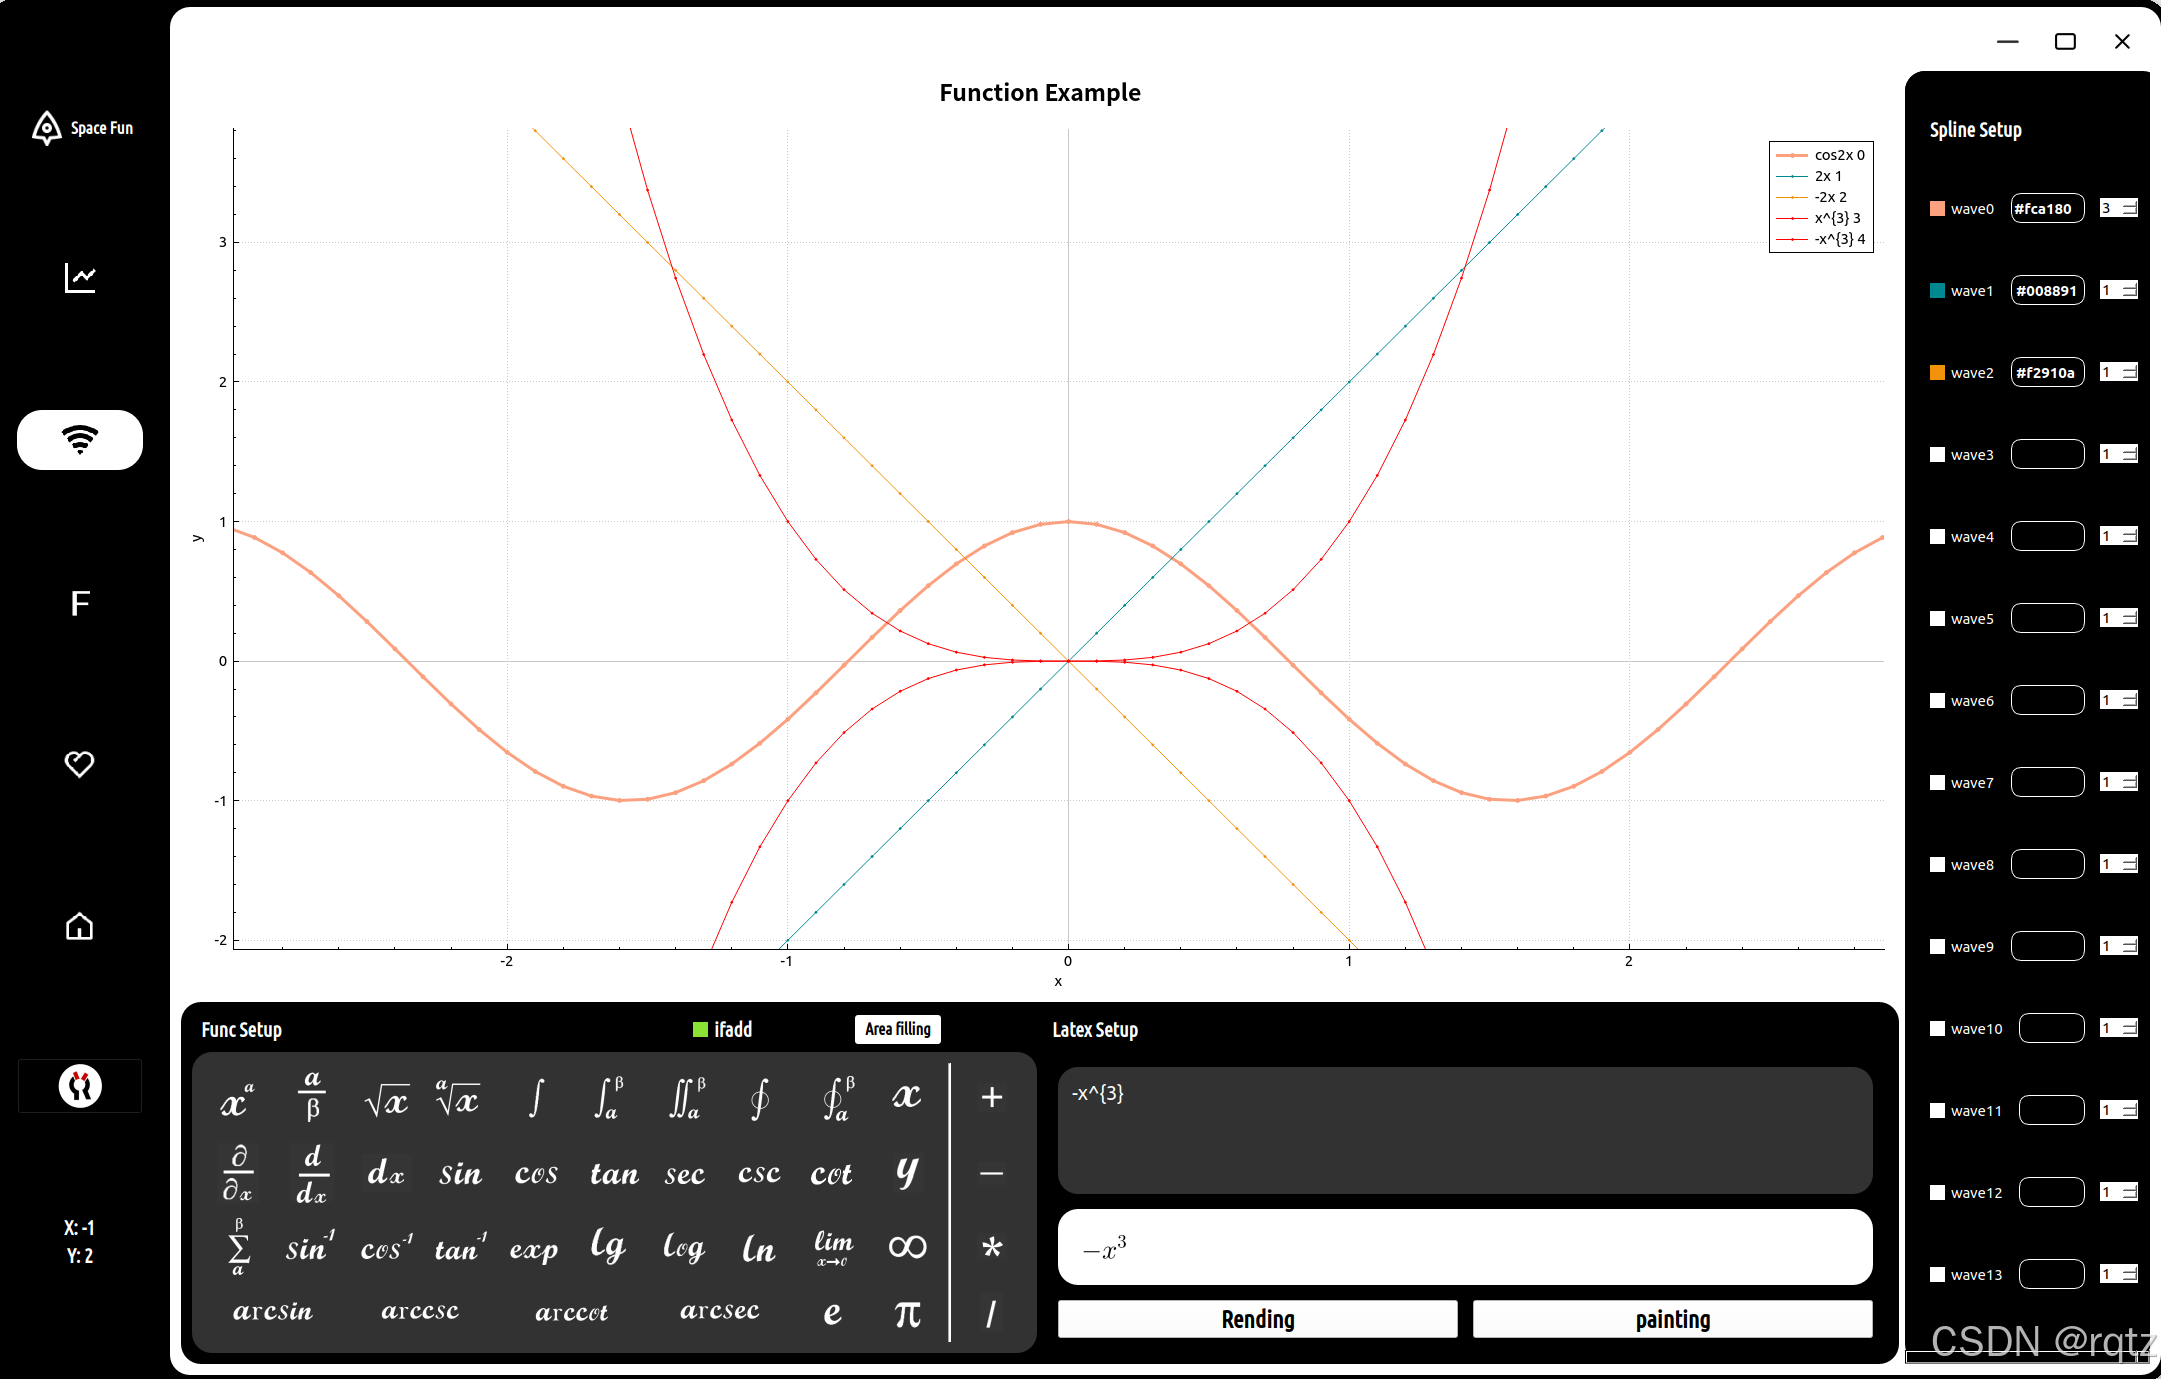
基于Qt的开源项目QCustomplot 类的一款在线的数学函数图像生成工具,涉及到了数学的latex公式渲染,如何将latex语法转换为Python的函数,和如何在Qt中使用QCustomplot类进行画图。
目前已经开发了数学函数图像生成的部分, 后面还有的是串口数据图像可视化和网口数据图像可视化功能。
数学函数图像生成主要涉及的功能:
实用性功能
- 支持三角函数,幂函数,对数函数,分式函数,组成的单项式,多项式函数图像生成。
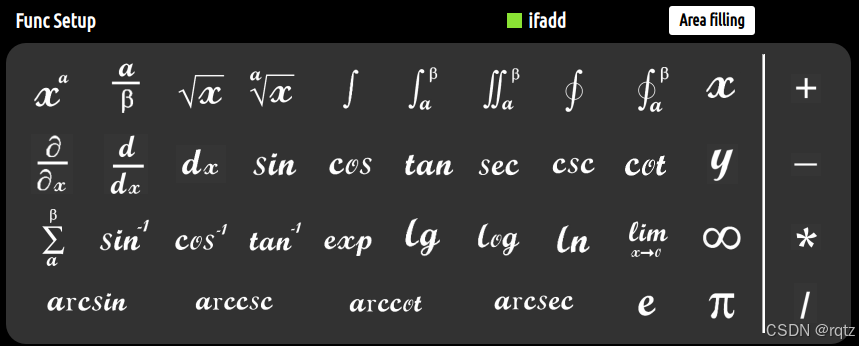
- 支持三角函数,幂函数,对数函数,微积分,曲线积分,二重积分,极限的Latex语法渲染
个性化功能
- 支持最多同时显示14条曲线,也支持每次只显示一条曲线。
- 支持设置每一条曲线的颜色,粗细,填充的设置
- 删除指定曲线和删除所有曲线。
- 支持鼠标的拖动,放大,图像中坐标的实时显示。
图片展示


QCustomplot类介绍使用及部分函数介绍
QCustomPlot是一个功能强大的 C++ 绘图库,专门用于在 Qt 应用程序中创建高质量的二维图表和绘图。它提供了丰富的功能来绘制各种类型的图表,包括但不限于折线图、散点图、柱状图、极坐标图等,并且支持高度的定制化,能够满足复杂的绘图需求。
Qt中嵌入QCustomplot控件
QCustomplot官网地址:Qt Plotting Widget QCustomPlot - Introduction
首先需要在Qt的项目中的**.pro** 文件中加入printsupport 
然后将在官网下载的两个文件,分别是qcustomplot.cpp和qcustomplot.h加入到项目中
通过"添加现有文件",接着需要在ui的控件中添加一个Qcustomplot控件,但是qt的空间中并没有提供,所以我们新建一个QFrame控件,右键点击"提升为",然后将QCustomplot类填入即可。


QCustomplot相关函数介绍
设置标题为"function Example"
cpp
 ui->customplot->plotLayout()->insertRow(0);
 QCPTextElement *title = new QCPTextElement(ui->customplot, "Function Example", QFont("sans", 17, QFont::Bold));
    ui->plot2->plotLayout()->addElement(0, 0, title);
添加图例
cpp
ui->customplot->addGraph();清除图像
cpp
ui->customplot->clearGraphs();所选的曲线
cpp
ui->customplot->selectedGraphs();所选的曲线的大小(几条)
cpp
ui->customplot->selectedGraphs().size() 移除所选的第一个曲线
cpp
ui->customplot->removeGraph(ui->customplot->selectedGraphs().first());添加x,y数据,其中x_list和y_list是Qvector类型
cpp
ui->customplot->graph(0)->setData(x_list,y_list);设置曲线的图表名称
cpp
ui->customplot->graph(0)->setName("New Graph");设置曲线的画笔
cpp
QPen pen;
//画笔颜色
pen.setColor(Qt::red);
//画笔宽度
pen.setWidth(1);
//设置曲线画笔
ui->customplot->graph(0)->setPen(pen);
设置曲线的填充区域颜色
cpp
ui->customplot->graph(0)->setBrush(QBrush(QColor(0,0,255,20));设置曲线的无填充区域
cpp
ui->customplot->graph(0)->setBrush(Qt::NoBrush);设置曲线x,y轴的标签
cpp
ui->customplot->xAxis->setLabel("x");
ui->customplot->yAxis->setLabel("y");
设置曲线的图表可见
cpp
ui->customplot->legend->setVisible(true);设置线条样式为直线
cpp
ui->customplot->graph(count)->setLineStyle((QCPGraph::LineStyle)QCPGraph::lsLine);设置线条散点为大小为2的圆形
cpp
ui->customplot->graph(count)>setScatterStyle(QCPScatterStyle(QCPScatterStyle::ssDisc, 2));ssDisc:圆形
ssPlus:十字
ssSquare:正方形
ssDiamond:菱形
ssStar:五角星
ssTriangle:三角形
开启曲线交互
cpp
ui->customplot->setInteractions(QCP::iRangeDrag | QCP::iRangeZoom | QCP::iSelectAxes | QCP::iSelectLegend | QCP::iSelectPlottables);QCP::iRangeDrag:允许用户通过鼠标拖动来改变坐标轴的范围。例如,在一个二维坐标图中,用户可以按住鼠标左键并拖动来改变 x 轴或 y 轴所显示的数据范围。
QCP::iRangeZoom:启用通过鼠标滚轮或其他指定方式对绘图区域进行缩放操作,以便用户能够更仔细地查看图表的特定区域或者获取更宏观的视图。
QCP::iSelectAxes:使得用户可以通过鼠标点击等操作选中坐标轴,可能用于后续对选中坐标轴进行属性修改(如改变坐标轴的颜色、标签格式等)。
QCP::iSelectLegend:允许用户选中图例(通常用于标识不同数据系列的标记、颜色等信息的说明区域),以便进行诸如隐藏 / 显示特定数据系列、修改图例文本等操作。
QCP::iSelectPlottables:使 用 户 能 够 选 中 具 体 的 绘 图 元 素(如 折 线、柱 状 图 的 柱 子、散 点 等),同样可用于进一步的操作,比如删除某个数据系列、修改其样式等。
重新绘制图像
cpp
ui->customplot->replot();QcustomPlot实时显示鼠标在图像位置
在构造函数连接信号和槽函数mouse_move
cpp
connect(ui->customplot,&QCustomPlot::mouseMove,this,&MainWindow::mouse_move);槽函数**mouse_move,**可以用label标签显示
cpp
//显示鼠标位置
void MainWindow::mouse_move(QMouseEvent *event)
{
    int xx = int(ui->plot2->xAxis->pixelToCoord(event->x()));
    int yy = int(ui->plot2->yAxis->pixelToCoord(event->y()));
    QString coordx("X: %1");
    QString coordy("Y: %1");
    coordx = coordx.arg(xx);
    coordy = coordy.arg(yy);
    ui->label->setText(coordy);
    ui->label_2->setText(coordx);
}
Latex语法介绍和开源项目cLaTeXMath库渲染的使用及qt项目嵌入
LaTeX 是一种基于 TeX 的排版系统,主要用于高质量的科技和数学文献排版。本文主要介绍LaTex语法在数学公式渲染的内容。(其中CSDN官方的文章创作中心的数学公式输入就是采用的LaTex语法)。
|-------|---------------------------------|------------------------------------------------------------|
| 名称 | LaTex语法 | 函数 |
| 幂函数 | x^{2} | |
| 分式 | \frac{1}{2} | |
| 根号 | \sqrt{2} | |
| 根号 | \sqrt[2]{4} | |
| 不定积分 | \int | |
| 定积分 | \int_{1}^{6} | |
| 二重积分 | \iint_{1}^{6} | |
| 曲线积分 | \oint | |
| 定曲线积分 | \oint_{1}^{6} | |
| 微分 | \frac{d}{dx} | |
| 偏微分 | \frac{\partial }{\partial x} | |
| 对数 | \log_{10}{2} | |
| 对数 | \ln{2} | |
| 极限 | \lim_{x\to 0} | |
| 乘 | \times | |
| 无穷 | \infty | |
| 圆周率 | \pi | |
Qt项目嵌入
相关函数及运算符(可点击)
公式渲染

嵌入方法:开源项目cLaTeXMath库渲染
平台:ubuntu 20.04
项目连接:GitCode - 全球开发者的开源社区,开源代码托管平台
下载后,将MicroTeX-master放入主目录
安装GTKMM
bash
sudo apt-get install libgtkmm-3.0-dev安装GSVMM
bash
sudo apt-get install libglibmm-2.4-dev
bash
cd MicroTeX-master
mkdir build
cd build
cmake ..
make
编译完成后
bash
cd build
./LaTex
打开之后是一个图形化界面,可以在右侧输入latex语法,单击rending选然后,左侧可输出
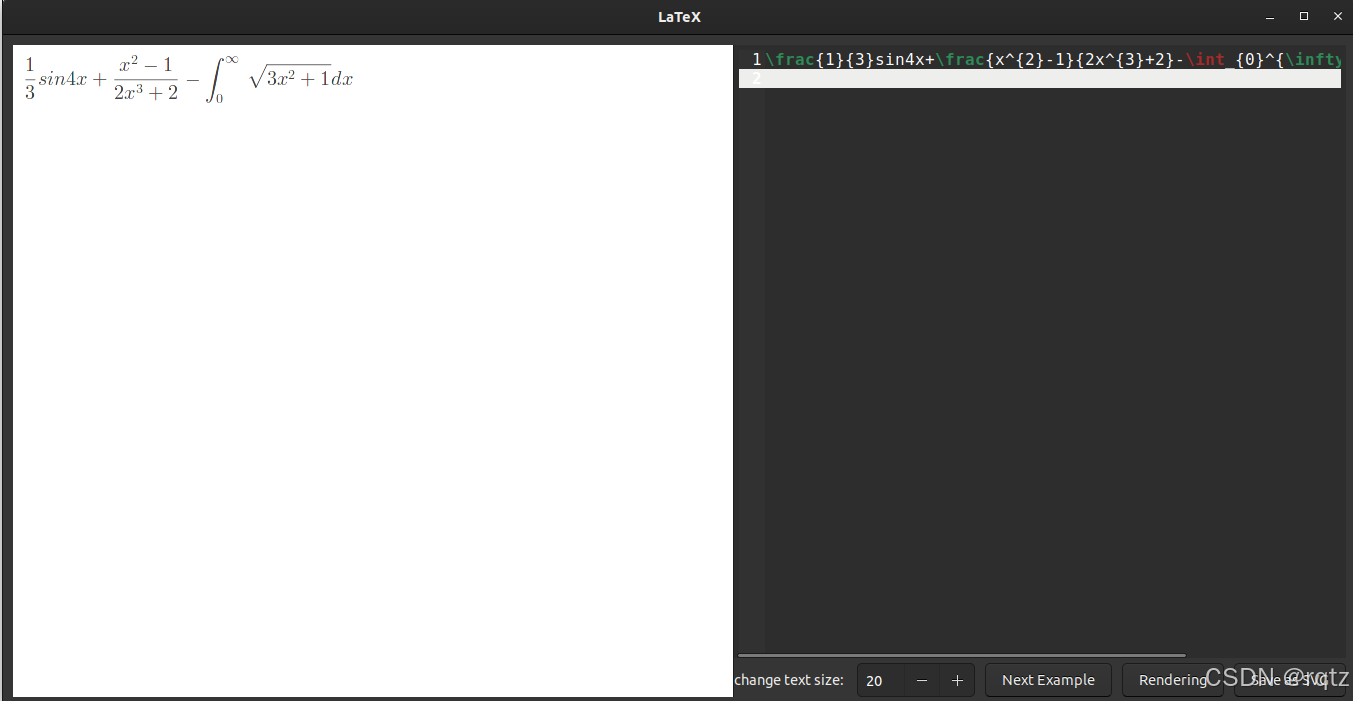
该项目有提供在Qt中的嵌入,但是自己没搞明白怎么弄的。
不过没关系,可以写一个脚本来解决。
该库支持在 Linux 操作系统上的无头模式(没有图形用户界面)
批处理模式:
./LaTeX -headless \
    -samples=res/SAMPLES.tex \
    -outputdir=samples \
    -prefix=sample_ \
    # 公共选项
    -textsize=14 \
    -foreground=black \
    -background=white \
    -padding=0 \
    -maxwidth=720
单个模式:
./LaTeX -headless \
    "-input=\sqrt[3]{(x-y)^3}=x-y" \
    -output=an_example.svg
    # 其他选项...
公共选项
-
-h: 显示用法并退出 -
-headless: 告诉应用以无头模式运行,将输入的 LaTeX 代码转换为 SVG 图像 -
-textsize: 配置显示公式的字体大小(以点为单位),默认为 20 -
-foreground: 配置公式显示的前景色;值可以是颜色名称或形式为 #AARRGGBB 的十六进制颜色;默认为黑色 -
-background: 配置公式显示的背景色;值可以是颜色名称或形式为 #AARRGGBB 的十六进制颜色;默认为透明 -
-padding: 配置添加到 SVG 图像的间距,默认为 10 -
-maxwidth: 配置图形上下文的最大宽度,默认为 720 像素;此选项对 SVG 图像的宽度限制较弱,因此 SVG 图像的宽度可能大于由此选项定义的值
批处理模式选项
程序会从指定文件(通过 -samples 选项提供)解析出的 LaTeX 代码保存生成的 SVG 图像到指定目录。
-
-outputdir: 指定保存 SVG 图像的目录 -
-samples: 指定包含多个由仅包含字符%的单独行分隔的 LaTeX 代码的文件,默认为 './res/SAMPLES.tex';详情参见 这个文件 -
-prefix: 指定 SVG 图像文件名前缀,默认为空;例如,如果使用-prefix=a_提供了两段代码,SVG 图像文件名为 'a_0.svg' 和 'a_1.svg'
单个模式选项
-
-input: 写在 LaTeX 中的源代码 -
-output: 指定保存生成的 SVG 图像的位置,只有当指定了-input时才有效
latex脚本(用于生成latex渲染后的svg格式图片)
bash
#!/bin/bash

path=/home/$USER/MicroTeX-master/build/

cd $path

if [ "$#" -ne 1 ];then
    echo "Usage: $0 <Latex_code> "
    exit 1
fi
Latex_code="$1"

$path/LaTeX -headless -input="$Latex_code" -output=/home/$USER/output.svg

/usr/bin/python3 $path/svgtopng.py
svg转png的python程序svgtopng.py
用到的库是cairosvg,没有的pip安装
python
#!/usr/bin/python3
import cairosvg
def svg_to_png(svg_path, png_path):
    try:
        cairosvg.svg2png(url=svg_path, write_to=png_path)
        print("转换成功")
    except Exception as e:
        print("转换失败,原因:", e)


svg_file = "/home/user/output.svg"
png_file = "/home/user/output.png"
svg_to_png(svg_file, png_file)
将上述的sh脚本和python脚本放入路径/home/$USER/MicroTeX-master/build/
执行方法(其后跟上任何latex语法即可)
bash
/home/$USER/MicroTeX-master/build/latex.sh "\frac{x^{2}+1}{x^{3}-1}"执行成功后会在主目录生成两个文件
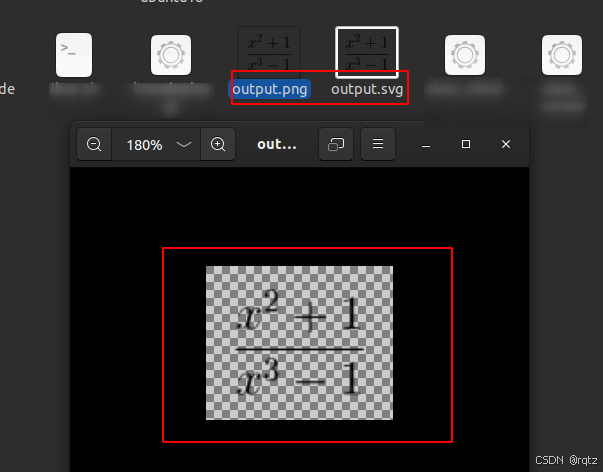
我们将输出的png文件直接在qt中用一个label通过其setpixmap方法设置即可。
Python调用Ai大模型转换latex语法转换为Python函数,来绘图
由于软件的最终目的是将输入的latex语法转换为函数图像
但是输入的公式千变万化,而且不仅仅是单项式的函数,包含多种函数组成的多项式,其中自己也尝试通过解析latex语法的字符串形式来进行函数的提取,但是后续发现复杂程度过大。于是根据最终目的时要得到一个函数的x,y轴的数据,因此,想要借助AI大模型的方法来帮助我解析latex语法,并将其转换为python的函数。
下面介绍讯飞AI大模型的调用方法。
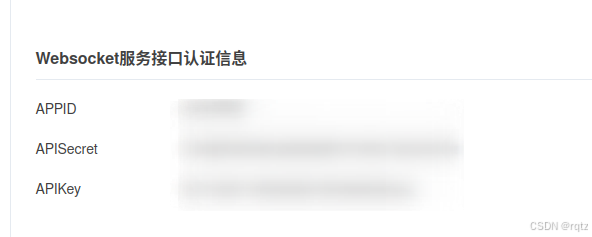
在 讯飞的官网注册之后,会得到一个有关于api调用的websocket的三个数据
API通信的python程序
python
# coding: utf-8
import _thread as thread
import os
import time
import base64

import base64
import datetime
import hashlib
import hmac
import json
from urllib.parse import urlparse
import ssl
import math
from datetime import datetime
from time import mktime
from urllib.parse import urlencode
from wsgiref.handlers import format_date_time
from optparse import OptionParser
import websocket
import openpyxl
from concurrent.futures import ThreadPoolExecutor, as_completed
import os
import numpy as np
aim_content = ''
x = []
y = []
class Ws_Param(object):
    # 初始化
    def __init__(self, APPID, APIKey, APISecret, gpt_url):
        self.APPID = APPID
        self.APIKey = APIKey
        self.APISecret = APISecret
        self.host = urlparse(gpt_url).netloc
        self.path = urlparse(gpt_url).path
        self.gpt_url = gpt_url

    # 生成url
    def create_url(self):
        # 生成RFC1123格式的时间戳
        now = datetime.now()
        date = format_date_time(mktime(now.timetuple()))

        # 拼接字符串
        signature_origin = "host: " + self.host + "\n"
        signature_origin += "date: " + date + "\n"
        signature_origin += "GET " + self.path + " HTTP/1.1"

        # 进行hmac-sha256进行加密
        signature_sha = hmac.new(self.APISecret.encode('utf-8'), signature_origin.encode('utf-8'),
                                 digestmod=hashlib.sha256).digest()

        signature_sha_base64 = base64.b64encode(signature_sha).decode(encoding='utf-8')

        authorization_origin = f'api_key="{self.APIKey}", algorithm="hmac-sha256", headers="host date request-line", signature="{signature_sha_base64}"'

        authorization = base64.b64encode(authorization_origin.encode('utf-8')).decode(encoding='utf-8')

        # 将请求的鉴权参数组合为字典
        v = {
            "authorization": authorization,
            "date": date,
            "host": self.host
        }
        # 拼接鉴权参数,生成url
        url = self.gpt_url + '?' + urlencode(v)
        # 此处打印出建立连接时候的url,参考本demo的时候可取消上方打印的注释,比对相同参数时生成的url与自己代码生成的url是否一致
        return url


# 收到websocket错误的处理
def on_error(ws, error):
    print("### error:", error)


# 收到websocket关闭的处理
def on_close(ws):
    print("### closed ###")


# 收到websocket连接建立的处理
def on_open(ws):
    thread.start_new_thread(run, (ws,))


def run(ws, *args):
    data = json.dumps(gen_params(appid=ws.appid, query=ws.query, domain=ws.domain))
    ws.send(data)


# 收到websocket消息的处理
def on_message(ws, message):
    # print(message)
    data = json.loads(message)
    code = data['header']['code']
    if code != 0:
        print(f'请求错误: {code}, {data}')
        ws.close()
    else:
        choices = data["payload"]["choices"]
        status = choices["status"]
        content = choices["text"][0]["content"]
        global aim_content
        aim_content += str(content)

        if status == 2:
            print("关闭会话")
            ws.close()
            for k in aim_content.split('\n'):
                if k.find("return") !=-1:
                    func = k.split('return ')[1]
            print(func)
            global x,y
            filex = open("/home/qtz-robot/桌面/qt 项目/plot_2/plot/x.txt","w")
            filey = open("/home/qtz-robot/桌面/qt 项目/plot_2/plot/y.txt","w")
            for i in np.arange(-10,10,0.1):
                formula_str = func.replace('x',str(i))
                result = eval(formula_str)
                filex.write(str(i)+"\n")
                filey.write(str(result)+"\n")

            # print(result)
            filex.close()
            filey.close()


def gen_params(appid, query, domain):
    """
    通过appid和用户的提问来生成请参数
    """

    data = {
        "header": {
            "app_id": appid,
            "uid": "1234",
            # "patch_id": []    #接入微调模型,对应服务发布后的resourceid
        },
        "parameter": {
            "chat": {
                "domain": domain,
                "temperature": 0.5,
                "max_tokens": 4096,
                "auditing": "default",
            }
        },
        "payload": {
            "message": {
                "text": [{"role": "user", "content": query}]
            }
        }
    }
    return data


def main(appid, api_secret, api_key, Spark_url, domain, query):

    wsParam = Ws_Param(appid, api_key, api_secret, Spark_url)
    websocket.enableTrace(False)
    wsUrl = wsParam.create_url()

    ws = websocket.WebSocketApp(wsUrl, on_message=on_message, on_error=on_error, on_close=on_close, on_open=on_open)
    parser = OptionParser()
    parser.add_option("-i","--question",dest = "question",help = "input your question",
                      default = "")
    (options,args) = parser.parse_args()
    if options.question:
        ws.query = options.question
    ws.appid = appid
    # ws.query = query
    ws.domain = domain
    ws.run_forever(sslopt={"cert_reqs": ssl.CERT_NONE})


if __name__ == "__main__":
    main(
        appid="xxx",
        api_secret="xxx",
        api_key="xxx",
        #appid、api_secret、api_key三个服务认证信息请前往开放平台控制台查看(https://console.xfyun.cn/services/bm35)
        # Spark_url="wss://spark-api.xf-yun.com/v3.5/chat",      # Max环境的地址
		Spark_url = "wss://spark-api.xf-yun.com/v4.0/chat", # 4.0Ultra环境的地址
        # Spark_url = "wss://spark-api.xf-yun.com/v3.1/chat"  # Pro环境的地址
        # Spark_url = "wss://spark-api.xf-yun.com/v1.1/chat"  # Lite环境的地址
        # domain="generalv3.5",     # Max版本
		domain = "4.0Ultra" ,    # 4.0Ultra 版本
        # domain = "generalv3"    # Pro版本
        # domain = "lite"      # Lite版本址
        query=""
    )
这个程序可以直接在讯飞官方下载。通过修改主函数的appid,api_secret,api_key为自己注册时生成的即可,然后模型的话我的是4.0Ultra。
但是该程序有三处被我修改的地方,以适配我的项目。
1.在main函数中
python
parser = OptionParser()
    parser.add_option("-i","--question",dest = "question",help = "input your question",
                      default = "")
    (options,args) = parser.parse_args()
    if options.question:
        ws.query = options.question
使用optparse 的 OptionParser来读取命令行参数。参数为给ai大模型输入的问题。
2.在onmessage函数中
python
global aim_content
aim_content += str(content)
if status == 2:
      print("关闭会话")
      ws.close()
      for k in aim_content.split('\n'):
          if k.find("return") !=-1:
            func = k.split('return ')[1]
      print(func)
      global x,y
      filex = open("/home/user/桌面/qt 项目/plot_2/plot/x.txt","w")
      filey = open("/home/user/桌面/qt 项目/plot_2/plot/y.txt","w")
      for i in np.arange(1,10,0.1):
          formula_str = func.replace('x',str(i))
          result = eval(formula_str)
          filex.write(str(i)+"\n")
          filey.write(str(result)+"\n")
          # print(result)
          filex.close()
          filey.close()
这里改动的是在模型通过websocket返回给我们问题的回答时,由于回答时候会多次调用omessage函数,所以就用aim_content拼接所有回答的字符串。
然后进行对字符串的处理,只截取到返回的程序中return后的语句。
最后使用一个1-10的浮点型数据,将返回的python函数中含有x的字符都替换成1-10的浮点型数据,从而得到一个字符串形式的数学表达式.
再使用eval函数将用字符串组成的数学公式进行转换,得到1-10中每个浮点型数据x下函数的函数值y。
其中向ai大模型询问的格式是
"latex语法+将这个latex语法格式的数据转换为python函数,用math库,不要回答文字语言"最后将循环中的x,y数据,也就是生成的数学表达式在1-10,步幅0.1的所有x,y数据保存到x.txt和y.txt.
获取函数x,y轴数据进行函数图像生成并嵌入Qt的Qcustomplot控件
在生成x,y的文件后,我们就得到的函数的数据。
在qt中可以通过读取这两个文件,并将读到的数据加入QVecor容器中。
painting按钮点击后的代码:
cpp
//显示函数图像
void MainWindow::on_painting_clicked()
{
    x_list.clear();
    y_list.clear();
    std::stringstream str;
    str<<"/home/user/桌面/'qt 项目'/plot_2/plot/spark.sh "<<ui->funtextEdit->toPlainText().toStdString()<<"将这个latex语法格式的数据转换为python函数,用math库,不要回答文字语言";
    system(str.str().c_str());
    std::cout<<str.str()<<std::endl;
    //读取x轴数据
    std::ifstream filex("/home/user/桌面/qt 项目/plot_2/plot/x.txt");
    if(!filex)
        QMessageBox::warning(this,"警告","函数x轴数据不存在");
    else {
        std::string line;
        while(std::getline(filex,line))
        {
            x_list.push_back(std::stod(line));
        }
        filex.close();
    }
    std::ifstream filey("/home/user/桌面/qt 项目/plot_2/plot/y.txt");
    if(!filey)
        QMessageBox::warning(this,"警告","函数y轴数据不存在");
    else {
        std::string line;
        while(std::getline(filey,line))
        {
            y_list.push_back(std::stod(line));
        }
        filey.close();
    }

    //清除绘图
    if(ui->ifadd->isChecked()==0)
    {
        ui->plot2->clearGraphs();
        count = -1;
    }
    count++;
    ui->plot2->addGraph();
    //设置数据
    ui->plot2->graph(count)->setData(x_list,y_list);
    QString str1 = ui->funtextEdit->toPlainText()+" %1";
    //设置名称
    ui->plot2->graph(count)->setName(str1.arg(count));
    QPen pen;
    //画笔颜色
    pen.setColor(Qt::red);
    //画笔宽度
    pen.setWidth(1);
    //设置曲线画笔
    ui->plot2->graph(count)->setPen(pen);
    //设置标签
    ui->plot2->xAxis->setLabel("x");
    ui->plot2->yAxis->setLabel("y");

    //设置曲线可见
    ui->plot2->legend->setVisible(true);
    //设置线条样式为直线
    ui->plot2->graph(count)->setLineStyle((QCPGraph::LineStyle)QCPGraph::lsLine);
    //设置线条散点为大小为2的圆形
    ui->plot2->graph(count)->setScatterStyle(QCPScatterStyle(QCPScatterStyle::ssDisc, 2));
    //开启曲线交互
    ui->plot2->setInteractions(QCP::iRangeDrag | QCP::iRangeZoom | QCP::iSelectAxes | QCP::iSelectLegend | QCP::iSelectPlottables);
    //重新绘制图像
    ui->plot2->replot();
}
如有错误,请大佬指正批评!