文章目录
-
-
- [1 程序目标](#1 程序目标)
- [2 代码实现](#2 代码实现)
- [3 关键步骤解释](#3 关键步骤解释)
- [4 示例输出](#4 示例输出)
- [5 注意事项](#5 注意事项)
- 结语
-
以下是一个使用 scikit-learn、pandas和 matplotlib 实现线性回归的完整程序示例。程序包含数据加载、模型训练、预测和可视化。
1 程序目标
- 加载数据 (使用
pandas) - 数据预处理(划分训练集和测试集)
- 训练线性回归模型 (
scikit-learn) - 模型评估(计算误差指标)
- 可视化结果 (
matplotlib)
2 代码实现
python
复制
python
# 导入必要的库
import matplotlib
import pandas as pd
import matplotlib.pyplot as plt
from sklearn.model_selection import train_test_split
from sklearn.linear_model import LinearRegression
from sklearn.metrics import mean_squared_error, r2_score


matplotlib.use('TkAgg')

# 设置 Matplotlib 使用支持中文的字体
plt.rcParams['font.sans-serif'] = ['Noto Sans CJK SC']  # 根据字体名称调整
plt.rcParams['axes.unicode_minus'] = False  # 解决负号显示问题
# ======================
# 1. 加载数据
# ======================
# 示例数据集(可以替换为你的 CSV 文件路径)
# 假设数据文件包含特征列 'AT', 'V', 'AP', 'RH' 和目标列 'PE'
data = pd.read_csv('./ccpp.csv')  # 替换为你的文件路径

# 或者使用 scikit-learn 内置数据集(例如波士顿房价)
# from sklearn.datasets import load_boston
# boston = load_boston()
# data = pd.DataFrame(boston.data, columns=boston.feature_names)
# data['PRICE'] = boston.target

# ======================
# 2. 数据预处理
# ======================
# 提取特征 X 和目标 y
X = data[['AT', 'V', 'AP', 'RH']]  # 特征列
y = data['PE']                     # 目标列

# 划分训练集和测试集(80% 训练,20% 测试)
X_train, X_test, y_train, y_test = train_test_split(
    X, y, test_size=0.2, random_state=42
)

# ======================
# 3. 训练线性回归模型
# ======================
model = LinearRegression()       # 创建模型
model.fit(X_train, y_train)      # 训练模型

# ======================
# 4. 预测与评估
# ======================
y_pred = model.predict(X_test)   # 预测测试集

# 计算误差指标
mse = mean_squared_error(y_test, y_pred)
r2 = r2_score(y_test, y_pred)

print(f"模型系数: {model.coef_}")    # 特征权重
print(f"截距项: {model.intercept_}") # 截距
print(f"均方误差 (MSE): {mse:.2f}")  # 误差越小越好
print(f"R² 分数: {r2:.2f}")         # 越接近1越好

# ======================
# 5. 可视化结果
# ======================
# 绘制真实值与预测值对比图
plt.figure(figsize=(10, 6))
plt.scatter(y_test, y_pred, alpha=0.5)
plt.plot([y.min(), y.max()], [y.min(), y.max()], 'r--')  # 理想对角线
plt.xlabel("真实值")
plt.ylabel("预测值")
plt.title("真实值 vs 预测值")
plt.show()

# 绘制残差图(误差分布)
residuals = y_test - y_pred
plt.figure(figsize=(10, 6))
plt.scatter(y_pred, residuals, alpha=0.5)
plt.hlines(0, y_pred.min(), y_pred.max(), colors='r', linestyles='dashed')
plt.xlabel("预测值")
plt.ylabel("残差")
plt.title("残差分析")
plt.show()
3 关键步骤解释
- 数据加载 :
- 使用
pandas读取 CSV 文件,或直接加载内置数据集。 - 确保特征列 (
X) 和目标列 (y) 正确分离。
- 使用
- 数据划分 :
train_test_split将数据随机分为训练集和测试集,random_state确保可重复性。
- 模型训练 :
LinearRegression()创建模型,.fit()方法用训练数据拟合模型。
- 模型评估 :
- 均方误差 (MSE):预测值与真实值的平均平方误差,越小越好。
- R² 分数:模型解释数据变异的比例,1 表示完美拟合。
- 可视化 :
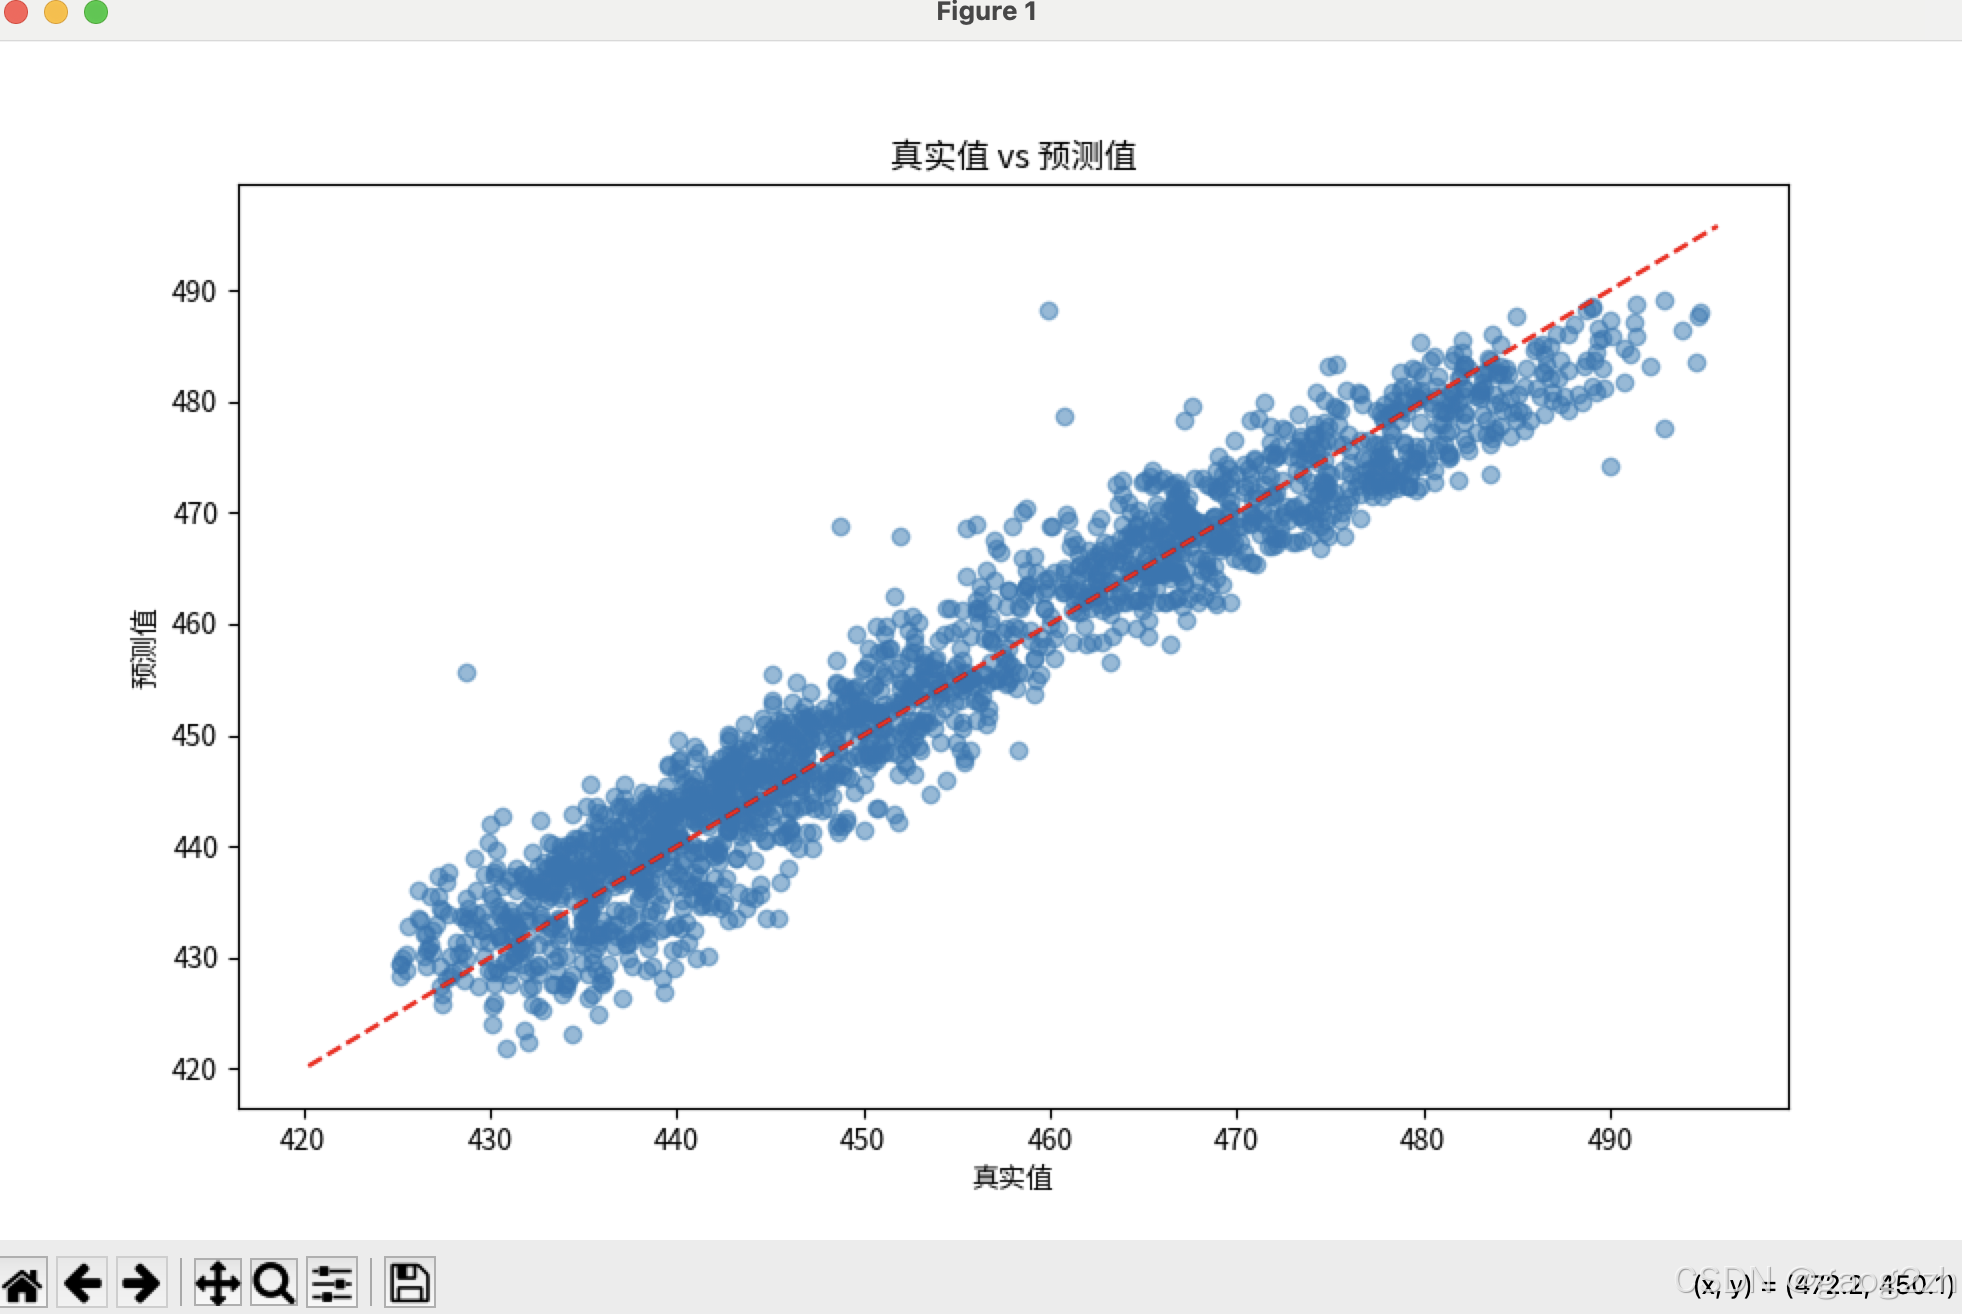
- 真实值 vs 预测值:理想情况下点应沿红色对角线分布。
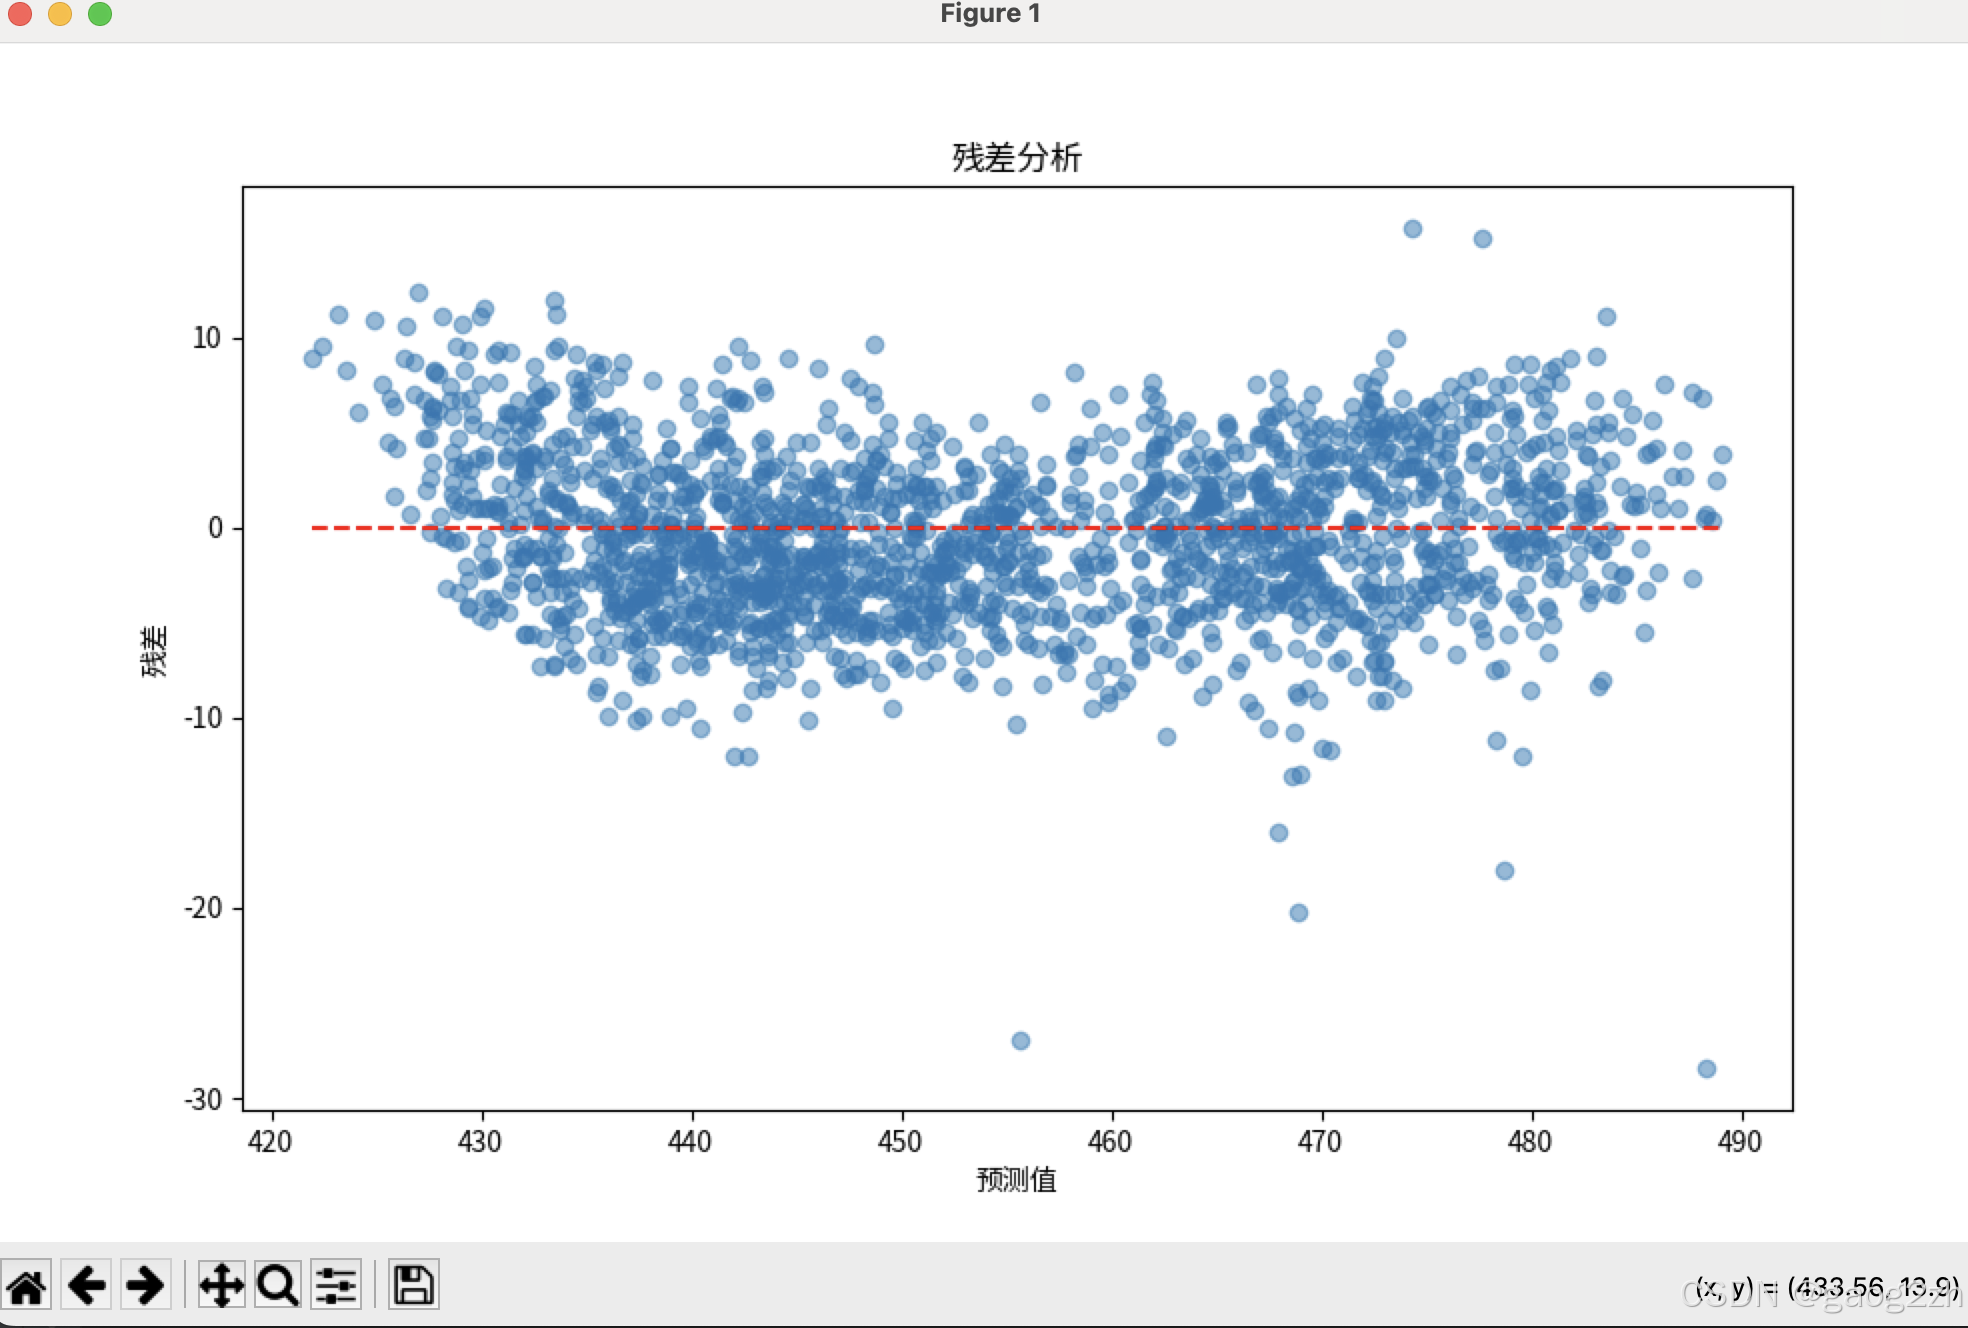
- 残差图:残差应随机分布在 0 附近,无明显模式。
4 示例输出
复制
模型系数: [-1.97 -0.23  0.06 -0.15]
截距项: 454.42
均方误差 (MSE): 18.32
R² 分数: 0.93
5 注意事项
- 数据预处理 :
- 如果数据存在缺失值,需使用
data.dropna()或填充方法(如均值填充)。 - 如果特征量纲差异大,建议标准化(
StandardScaler)。
- 如果数据存在缺失值,需使用
- 模型改进 :
- 若线性回归效果不佳,可尝试多项式回归或正则化(Ridge/Lasso)。
- 检查特征之间的多重共线性(使用
data.corr())。
- 替换数据 :
- 将代码中的
ccpp.csv替换为你的实际数据路径,并调整特征列名。 - 示例中数据参考下面链接1
- 将代码中的
效果如下图所示:


结语
❓QQ:806797785
⭐️仓库地址:https://gitee.com/gaogzhen
⭐️仓库地址:https://github.com/gaogzhen
1\][](https://www.cnblogs.com/pinard/p/6016029.html)[用scikit-learn和pandas学习线性回归](https://www.cnblogs.com/pinard/p/6016029.html)\[CP/OL\].