环境说明:
现在有一套redis cluster,部署是3主机6实例架构部署。需要采集对应的指标,满足异常监控告警,性能分析所需。
环境准备
以下环境需要提前部署完成。
redis cluser
prometheus
alertmanager
grafna
redis_exporter部署
我们部署采用docker composer 进行安装。
采用的redis_exporter为:https://github.com/oliver006/redis_exporter
bash
  redis-exporter:
    image: docker.m.daocloud.io/oliver006/redis_exporter:v1.74.0-alpine
    command:
      - '--redis.addr=redis://redisIP:7001'
      - '--redis.password=redisPassword'
      - '--is-cluster'
    ports:
- "9121:9121"上面参数,只需要指定--is-cluster,然后指明集群中一个节点,即可获取所有节点的数据。
prometheus采集配置:
添加prometheus的监控项:
yml
  - job_name: 'redis_sjzt_prod'
    http_sd_configs:
      - url: http://redisExporterIP:9121/discover-cluster-nodes
        refresh_interval: 10m
    metrics_path: /scrape
    relabel_configs:
      - source_labels: [__address__]
        target_label: __param_target
      - source_labels: [__param_target]
        target_label: instance
      - target_label: __address__
        replacement: redisExporter:9121
指标查看:
可以看到 prometheus的target中已经存在对应的采集项,并且有集群的所有节点。

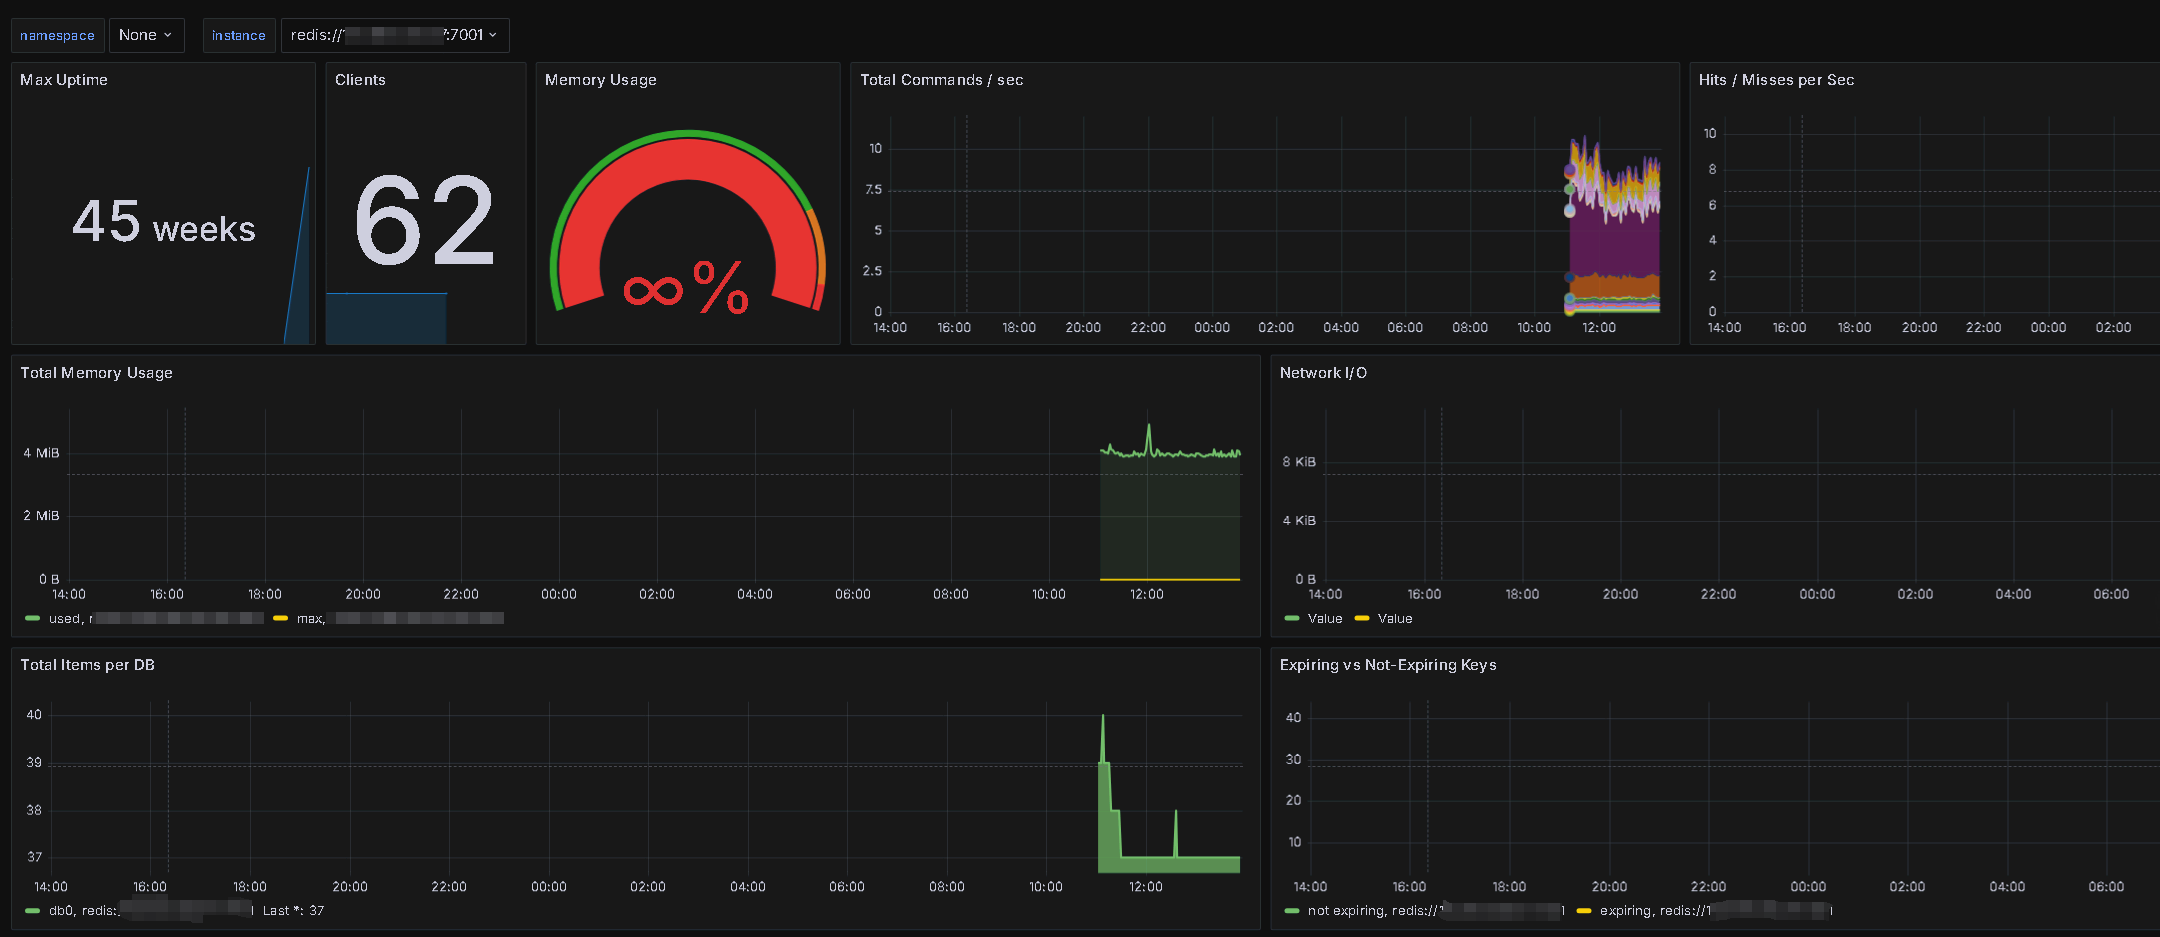
大屏展示:
监控模板:https://grafana.com/grafana/dashboards/763-redis-dashboard-for-prometheus-redis-exporter-1-x/
下载后直接导入,选择对应的数据源即可。
告警:
现在创建对应的报警规则,实现异常时通知到alertmanager。
下载后,加入到prometheus中。
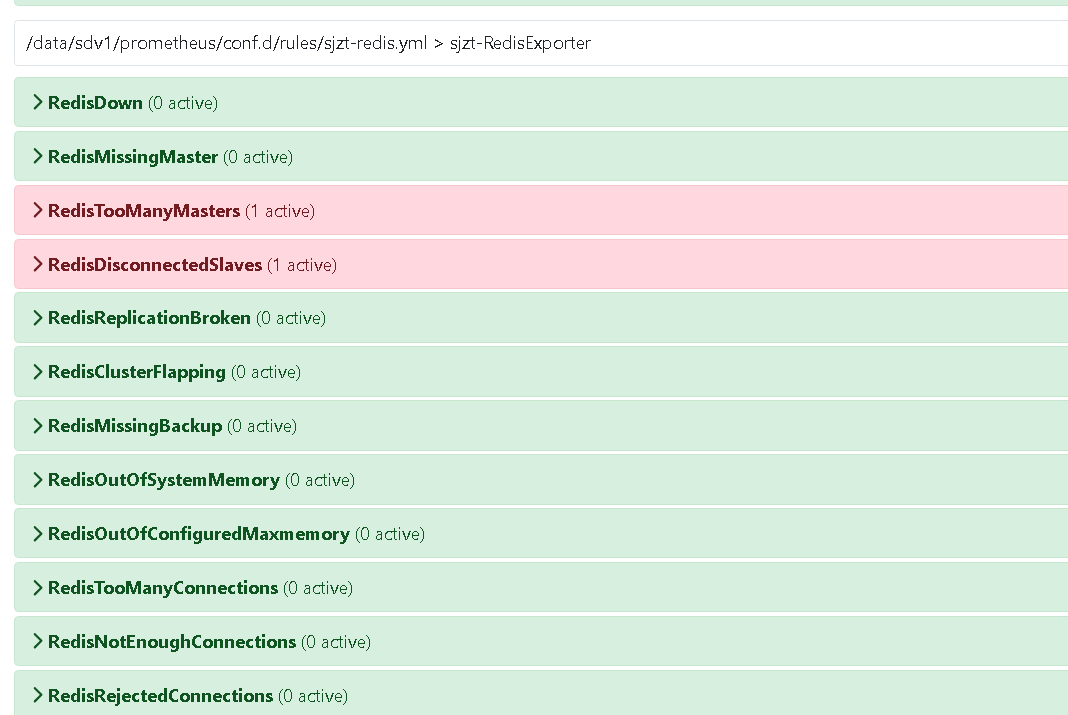
但是因为我们是集群,所以需要修改一些报警规则实现。删除两个不适用的报警规则RedisTooManyMasters和RedisDisconnectedSlaves 。修改后内容如下:
vim redis.yml
yml
groups:
- name: Oliver006RedisExporter
  rules:
    - alert: RedisDown
      expr: 'redis_up == 0'
      for: 0m
      labels:
        severity: critical
      annotations:
        summary: Redis down (instance {{ $labels.instance }})
        description: "Redis instance is down\n  VALUE = {{ $value }}\n  LABELS = {{ $labels }}"
    - alert: RedisMissingMaster
      expr: '(count(redis_instance_info{role="master"}) or vector(0)) < 1'
      for: 0m
      labels:
        severity: critical
      annotations:
        summary: Redis missing master (instance {{ $labels.instance }})
        description: "Redis cluster has no node marked as master.\n  VALUE = {{ $value }}\n  LABELS = {{ $labels }}"
    - alert: RedisReplicationBroken
      expr: 'delta(redis_connected_slaves[1m]) < 0'
      for: 0m
      labels:
        severity: critical
      annotations:
        summary: Redis replication broken (instance {{ $labels.instance }})
        description: "Redis instance lost a slave\n  VALUE = {{ $value }}\n  LABELS = {{ $labels }}"
    - alert: RedisClusterFlapping
      expr: 'changes(redis_connected_slaves[1m]) > 1'
      for: 2m
      labels:
        severity: critical
      annotations:
        summary: Redis cluster flapping (instance {{ $labels.instance }})
        description: "Changes have been detected in Redis replica connection. This can occur when replica nodes lose connection to the master and reconnect (a.k.a flapping).\n  VALUE = {{ $value }}\n  LABELS = {{ $labels }}"
    - alert: RedisMissingBackup
      expr: 'time() - redis_rdb_last_save_timestamp_seconds > 60 * 60 * 24'
      for: 0m
      labels:
        severity: critical
      annotations:
        summary: Redis missing backup (instance {{ $labels.instance }})
        description: "Redis has not been backuped for 24 hours\n  VALUE = {{ $value }}\n  LABELS = {{ $labels }}"
    - alert: RedisOutOfSystemMemory
      expr: 'redis_memory_used_bytes / redis_total_system_memory_bytes * 100 > 90'
      for: 2m
      labels:
        severity: warning
      annotations:
        summary: Redis out of system memory (instance {{ $labels.instance }})
        description: "Redis is running out of system memory (> 90%)\n  VALUE = {{ $value }}\n  LABELS = {{ $labels }}"
    - alert: RedisOutOfConfiguredMaxmemory
      expr: 'redis_memory_used_bytes / redis_memory_max_bytes * 100 > 90 and on(instance) redis_memory_max_bytes > 0'
      for: 2m
      labels:
        severity: warning
      annotations:
        summary: Redis out of configured maxmemory (instance {{ $labels.instance }})
        description: "Redis is running out of configured maxmemory (> 90%)\n  VALUE = {{ $value }}\n  LABELS = {{ $labels }}"
    - alert: RedisTooManyConnections
      expr: 'redis_connected_clients / redis_config_maxclients * 100 > 90'
      for: 2m
      labels:
        severity: warning
      annotations:
        summary: Redis too many connections (instance {{ $labels.instance }})
        description: "Redis is running out of connections (> 90% used)\n  VALUE = {{ $value }}\n  LABELS = {{ $labels }}"
    - alert: RedisNotEnoughConnections
      expr: 'redis_connected_clients < 5'
      for: 2m
      labels:
        severity: warning
      annotations:
        summary: Redis not enough connections (instance {{ $labels.instance }})
        description: "Redis instance should have more connections (> 5)\n  VALUE = {{ $value }}\n  LABELS = {{ $labels }}"
    - alert: RedisRejectedConnections
      expr: 'increase(redis_rejected_connections_total[1m]) > 0'
      for: 0m
      labels:
        severity: critical
      annotations:
        summary: Redis rejected connections (instance {{ $labels.instance }})
        description: "Some connections to Redis has been rejected\n  VALUE = {{ $value }}\n  LABELS = {{ $labels }}"
重新加载prometheus的配置
curl -X POST http://localhost:9090/-/reload
检查对应的报警项是否已经添加进去了。访问prometheus 点击Alerts。进行查看如下所示:
说明:监控指标需要按照实际项目需要进行仔细考虑。以上只是参考。