✨作者主页 :IT研究室✨
个人简介:曾从事计算机专业培训教学,擅长Java、Python、微信小程序、Golang、安卓Android等项目实战。接项目定制开发、代码讲解、答辩教学、文档编写、降重等。
文章目录
一、前言
系统介绍
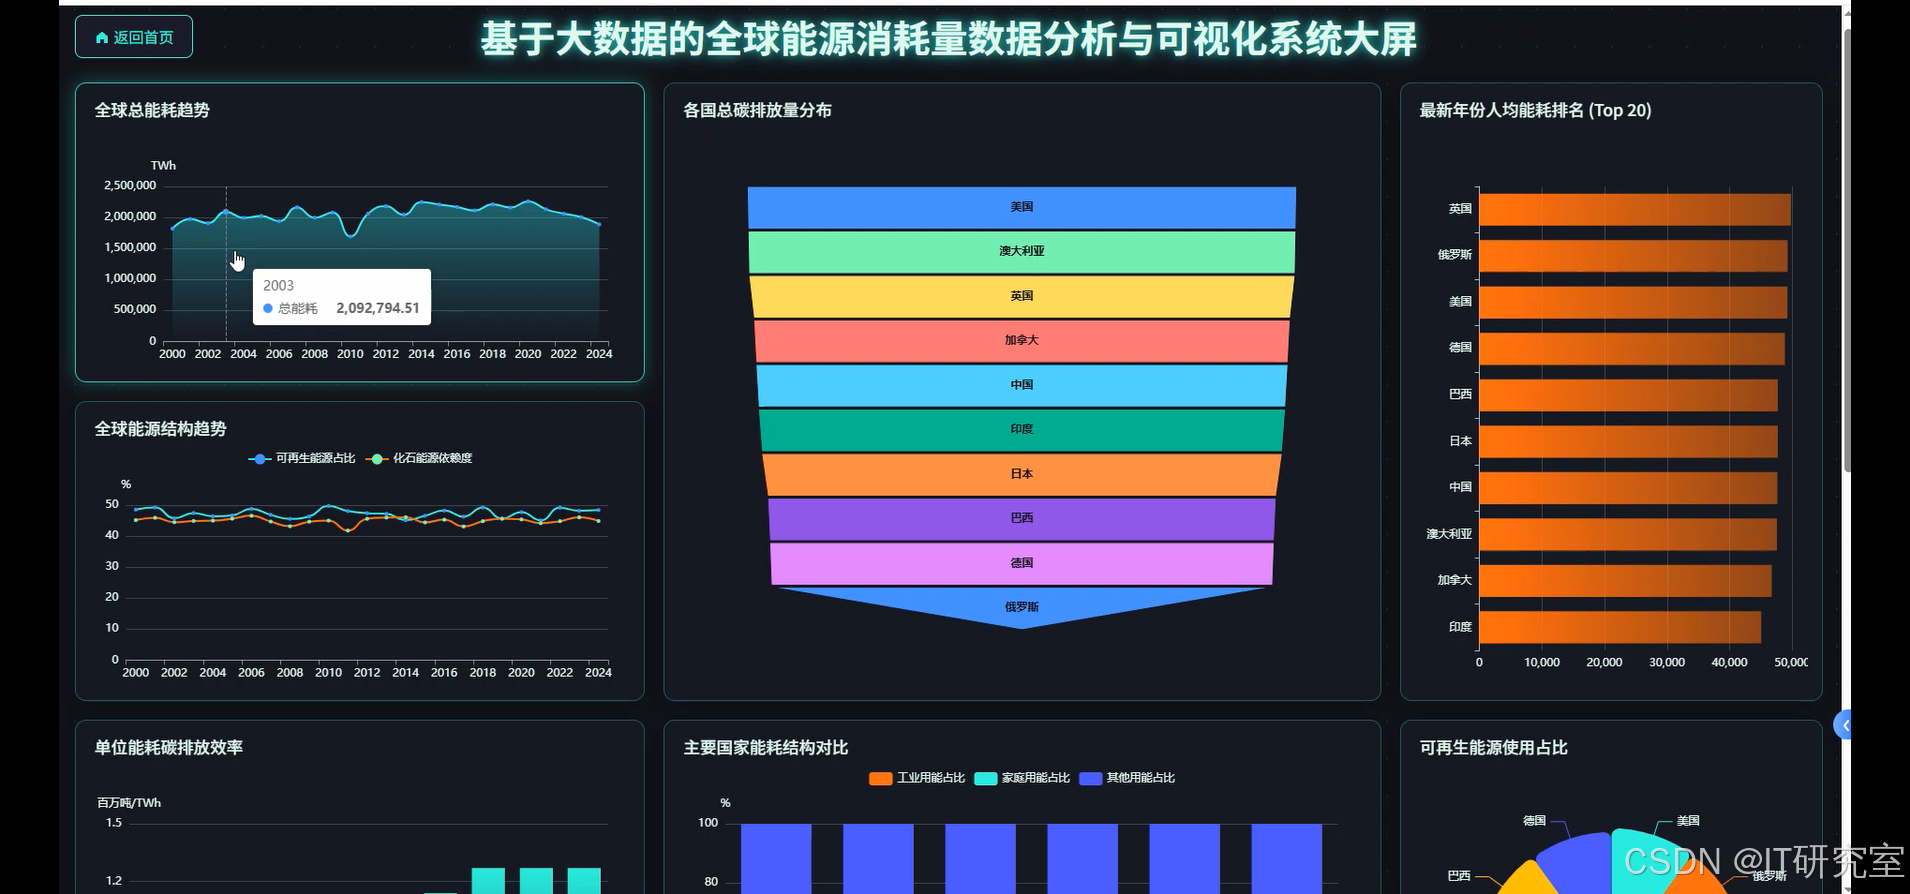
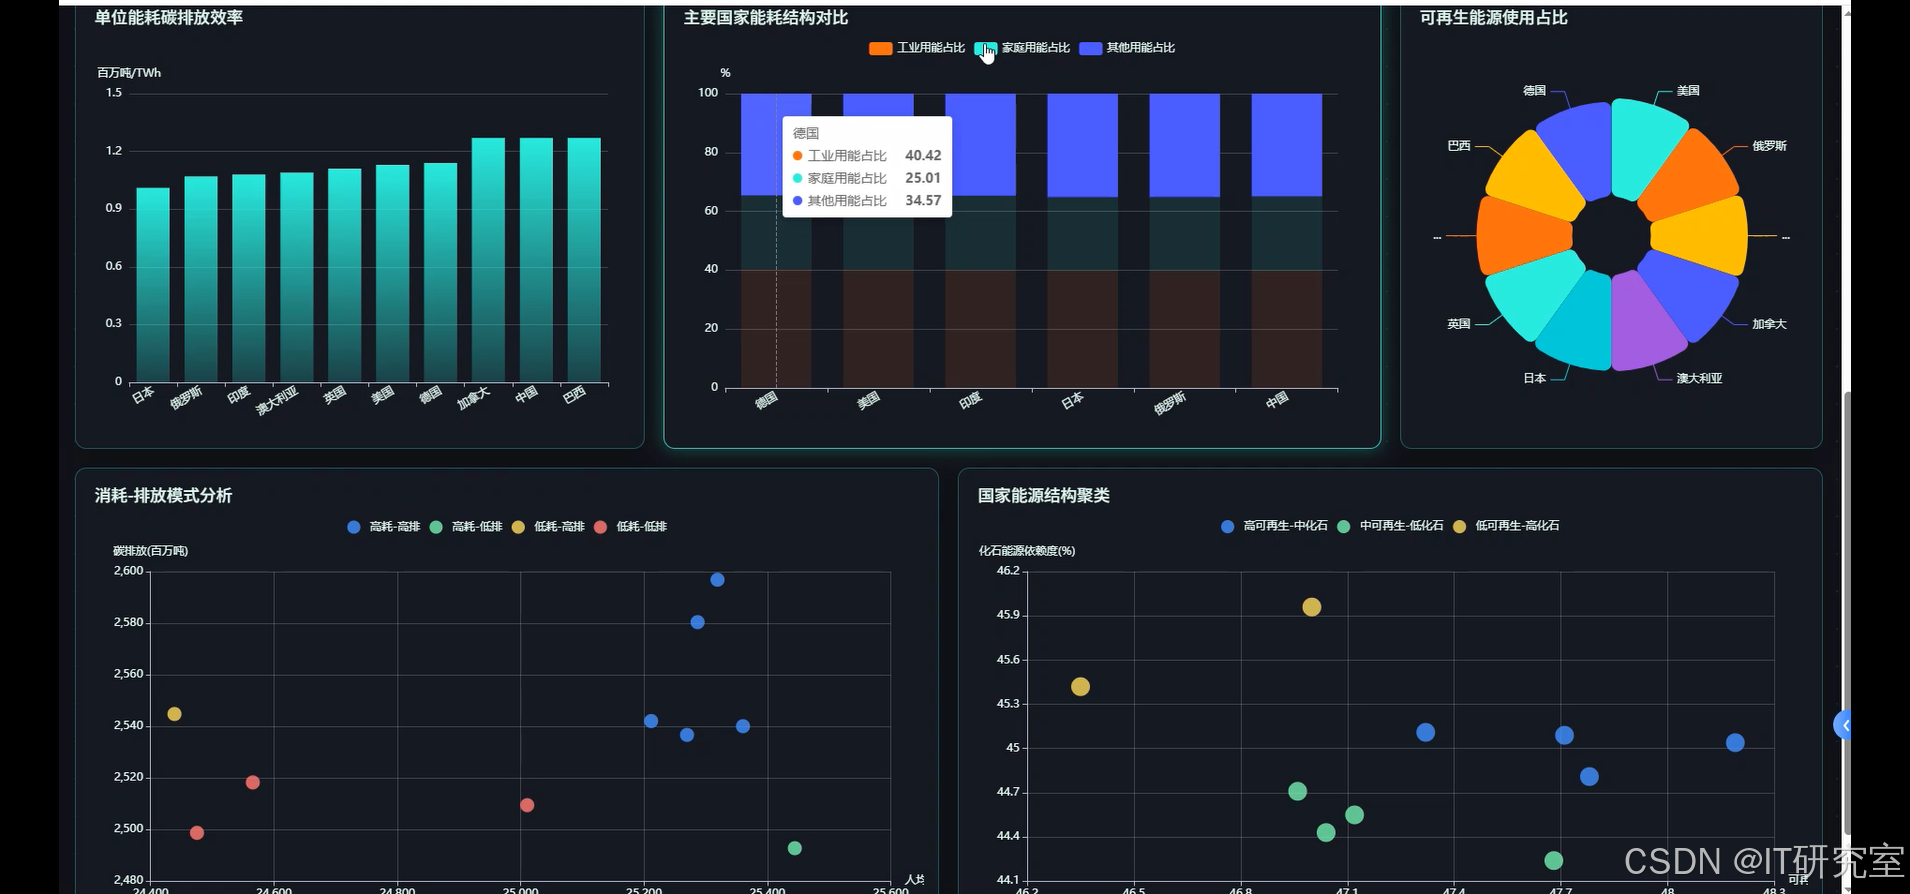
本系统是一个基于大数据技术栈的全球能源消耗量数据分析与可视化平台,采用Hadoop+Spark作为大数据处理框架,支持Python/Java语言开发模式。系统后端采用Django/Spring Boot框架架构,前端基于Vue+ElementUI+Echarts技术栈构建交互式数据可视化界面。系统核心功能包括全球能源消耗宏观趋势分析、国家维度能源状况对比、能源结构与可持续发展专题分析以及能源效率与消耗模式分析四大模块。通过HDFS分布式存储海量能源数据,利用Spark SQL进行高效数据处理和分析,结合Pandas、NumPy等数据科学库实现复杂的统计计算和关联分析。系统提供多维度的数据可视化大屏,支持动态图表展示、实时数据更新和交互式查询,能够直观呈现全球各国能源消耗趋势、碳排放变化、可再生能源占比等关键指标,为能源政策制定、环境保护决策和可持续发展研究提供数据支撑和决策依据。
选题背景
当今世界正面临着前所未有的能源挑战和环境压力,全球气候变化问题日益严峻,各国对清洁能源转型的需求愈发迫切。随着工业化进程的不断推进和人口增长,全球能源消耗量呈现持续上升趋势,传统化石燃料的大量使用导致碳排放量激增,给地球生态环境带来了巨大威胁。与此同时,可再生能源技术快速发展,风能、太阳能、水能等清洁能源在全球能源结构中的比重逐步提升,但不同国家和地区在能源转型速度和效果上存在显著差异。面对如此复杂的全球能源格局,迫切需要一个能够整合海量数据、深入分析能源消耗模式、直观展示发展趋势的综合性平台。传统的数据分析方法已无法满足对大规模、多维度能源数据的处理需求,而大数据技术的成熟为解决这一问题提供了新的技术路径,使得对全球能源消耗数据的深度挖掘和可视化分析成为可能。
选题意义
从实际应用角度来看,这个系统能够为政府部门、研究机构和能源企业提供有价值的决策参考。政策制定者可以通过系统了解本国在全球能源消耗格局中的地位,识别与先进国家的差距,从而制定更加科学合理的能源发展战略。对于学术研究而言,系统提供的多维度数据分析功能有助于研究人员深入探索能源消耗与经济发展、环境保护之间的内在关联,为相关理论研究提供数据支撑。从技术层面看,本系统将大数据处理技术与能源领域的实际需求相结合,为大数据技术在垂直行业的应用提供了实践案例,同时也为类似的数据分析系统开发积累了经验。虽然作为毕业设计项目,系统在规模和复杂度上有一定局限性,但其涵盖的技术栈和分析维度基本覆盖了能源数据分析的核心需求。通过这个项目的实施,不仅能够提升个人在大数据技术应用方面的实践能力,也为今后从事相关领域的工作奠定了基础,具有一定的学习价值和实用意义。
二、开发环境
- 大数据框架:Hadoop+Spark(本次没用Hive,支持定制)
- 开发语言:Python+Java(两个版本都支持)
- 后端框架:Django+Spring Boot(Spring+SpringMVC+Mybatis)(两个版本都支持)
- 前端:Vue+ElementUI+Echarts+HTML+CSS+JavaScript+jQuery
- 详细技术点:Hadoop、HDFS、Spark、Spark SQL、Pandas、NumPy
- 数据库:MySQL
三、系统界面展示
- 基于大数据的全球能源消耗量数据分析与可视化系统界面展示:
四、代码参考
- 项目实战代码参考:
java(贴上部分代码)
from pyspark.sql import SparkSession
from pyspark.sql.functions import sum, avg, desc, asc, col, when, count
import pandas as pd
import numpy as np
from django.http import JsonResponse
from django.views.decorators.csrf import csrf_exempt
import json
spark = SparkSession.builder.appName("GlobalEnergyAnalysis").config("spark.sql.adaptive.enabled", "true").config("spark.sql.adaptive.coalescePartitions.enabled", "true").getOrCreate()
@csrf_exempt
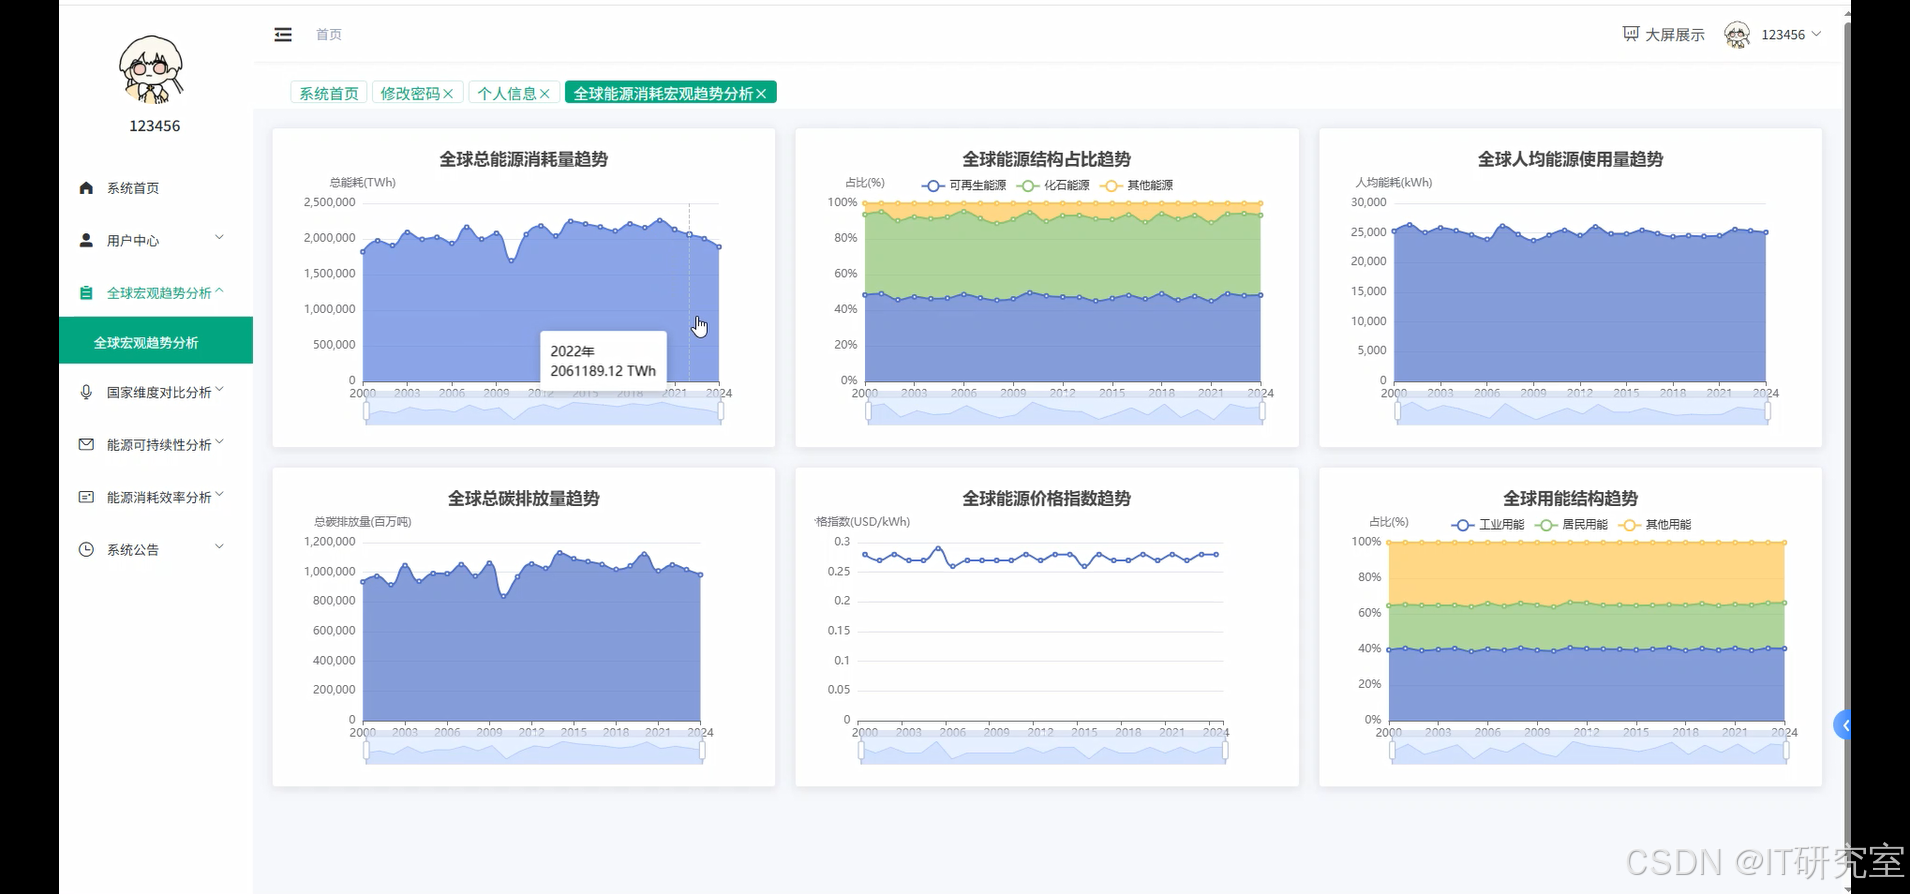
def global_energy_trend_analysis(request):
df = spark.read.option("header", "true").option("inferSchema", "true").csv("hdfs://localhost:9000/energy_data/global_energy_consumption.csv")
yearly_total_consumption = df.groupBy("Year").agg(sum("Total Energy Consumption (TWh)").alias("total_consumption")).orderBy("Year")
yearly_renewable_share = df.groupBy("Year").agg(avg("Renewable Energy Share (%)").alias("avg_renewable_share")).orderBy("Year")
yearly_carbon_emissions = df.groupBy("Year").agg(sum("Carbon Emissions (Million Tons)").alias("total_emissions")).orderBy("Year")
yearly_per_capita = df.groupBy("Year").agg(avg("Per Capita Energy Use (kWh)").alias("avg_per_capita")).orderBy("Year")
yearly_price_index = df.groupBy("Year").agg(avg("Energy Price Index (USD/kWh)").alias("avg_price_index")).orderBy("Year")
trend_data = yearly_total_consumption.join(yearly_renewable_share, "Year").join(yearly_carbon_emissions, "Year").join(yearly_per_capita, "Year").join(yearly_price_index, "Year")
pandas_result = trend_data.toPandas()
result_dict = {}
result_dict['years'] = pandas_result['Year'].tolist()
result_dict['total_consumption'] = pandas_result['total_consumption'].tolist()
result_dict['renewable_share'] = pandas_result['avg_renewable_share'].tolist()
result_dict['carbon_emissions'] = pandas_result['total_emissions'].tolist()
result_dict['per_capita_use'] = pandas_result['avg_per_capita'].tolist()
result_dict['price_index'] = pandas_result['avg_price_index'].tolist()
growth_rates = []
for i in range(1, len(result_dict['total_consumption'])):
current_year = result_dict['total_consumption'][i]
previous_year = result_dict['total_consumption'][i-1]
growth_rate = ((current_year - previous_year) / previous_year) * 100
growth_rates.append(round(growth_rate, 2))
result_dict['consumption_growth_rates'] = growth_rates
renewable_trend_slope = np.polyfit(result_dict['years'], result_dict['renewable_share'], 1)[0]
result_dict['renewable_trend_direction'] = "增长" if renewable_trend_slope > 0 else "下降"
result_dict['renewable_annual_change'] = round(renewable_trend_slope, 3)
return JsonResponse(result_dict)
@csrf_exempt
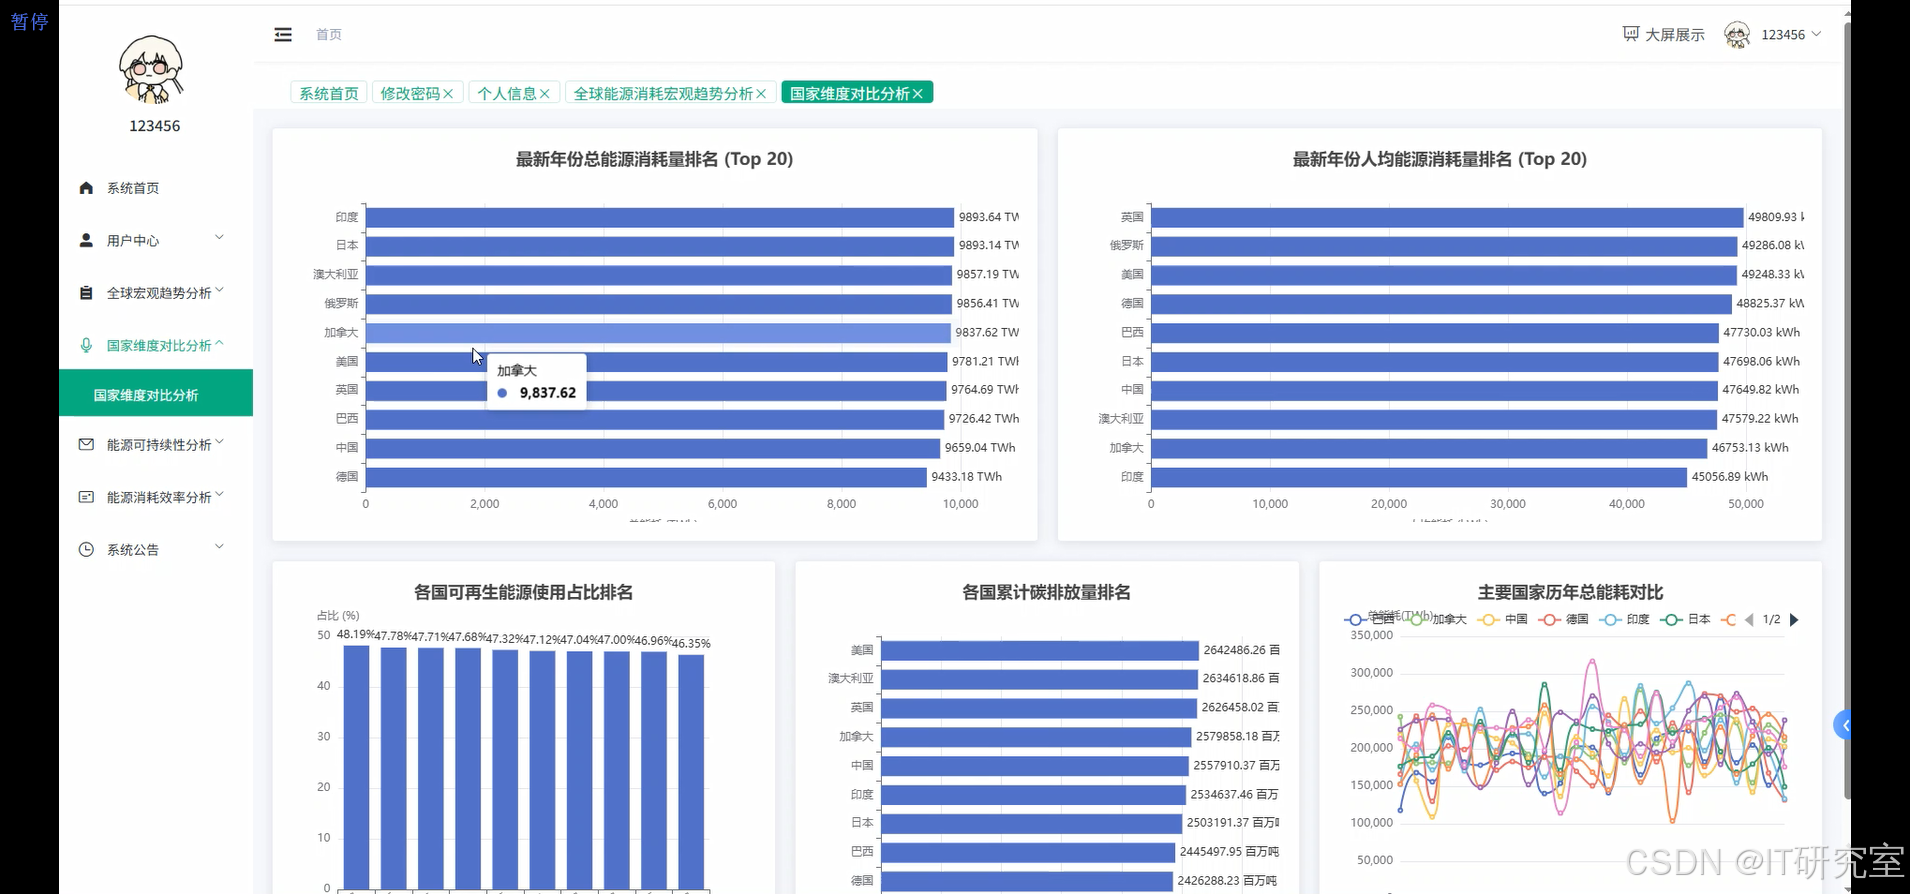
def country_dimension_comparison(request):
df = spark.read.option("header", "true").option("inferSchema", "true").csv("hdfs://localhost:9000/energy_data/global_energy_consumption.csv")
latest_year = df.agg({"Year": "max"}).collect()[0][0]
latest_data = df.filter(col("Year") == latest_year)
top_consumers = latest_data.select("Country", "Total Energy Consumption (TWh)").orderBy(desc("Total Energy Consumption (TWh)")).limit(20)
top_per_capita = latest_data.select("Country", "Per Capita Energy Use (kWh)").orderBy(desc("Per Capita Energy Use (kWh)")).limit(20)
country_renewable_avg = df.groupBy("Country").agg(avg("Renewable Energy Share (%)").alias("avg_renewable_share")).orderBy(desc("avg_renewable_share")).limit(15)
country_carbon_total = df.groupBy("Country").agg(sum("Carbon Emissions (Million Tons)").alias("total_carbon_emissions")).orderBy(desc("total_carbon_emissions")).limit(15)
major_countries = ["China", "United States", "India", "Russia", "Japan", "Germany"]
major_countries_data = df.filter(col("Country").isin(major_countries)).select("Country", "Year", "Total Energy Consumption (TWh)").orderBy("Country", "Year")
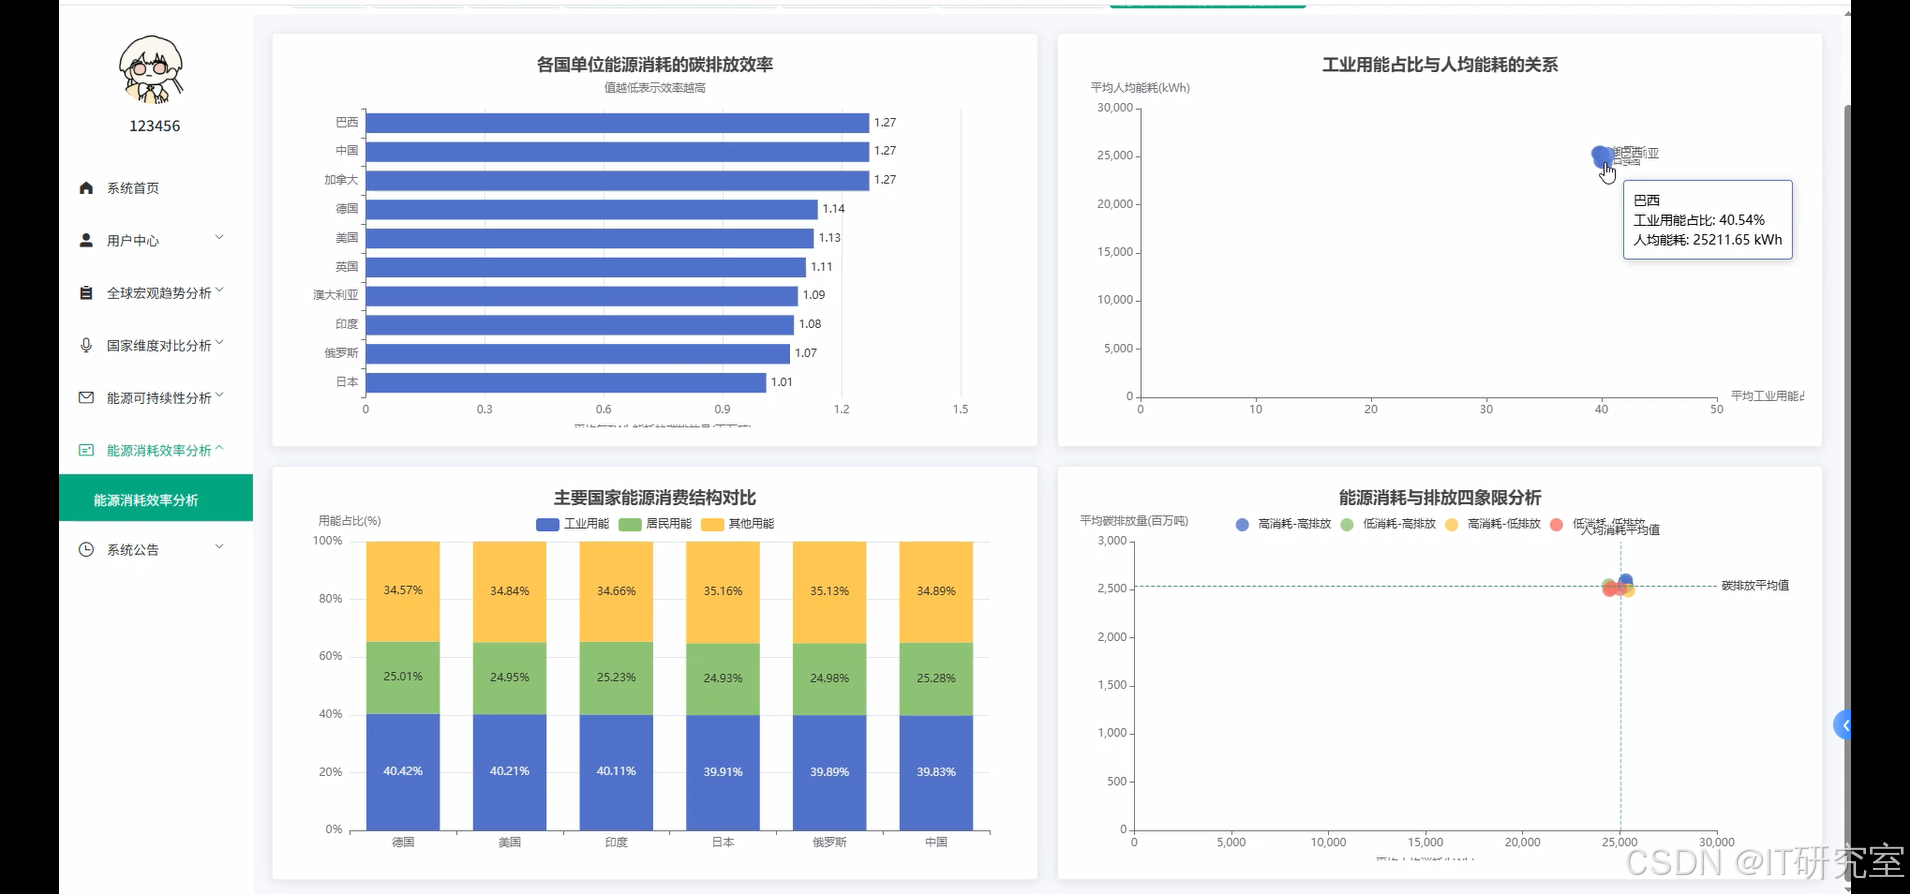
efficiency_metric = df.withColumn("carbon_per_energy", col("Carbon Emissions (Million Tons)") / col("Total Energy Consumption (TWh)"))
most_efficient = efficiency_metric.select("Country", "carbon_per_energy").groupBy("Country").agg(avg("carbon_per_energy").alias("avg_efficiency")).orderBy(asc("avg_efficiency")).limit(10)
result_data = {}
result_data['top_consumers'] = [{"country": row["Country"], "consumption": row["Total Energy Consumption (TWh)"]} for row in top_consumers.collect()]
result_data['top_per_capita'] = [{"country": row["Country"], "per_capita": row["Per Capita Energy Use (kWh)"]} for row in top_per_capita.collect()]
result_data['renewable_leaders'] = [{"country": row["Country"], "renewable_share": round(row["avg_renewable_share"], 2)} for row in country_renewable_avg.collect()]
result_data['carbon_emitters'] = [{"country": row["Country"], "carbon_emissions": row["total_carbon_emissions"]} for row in country_carbon_total.collect()]
major_countries_pandas = major_countries_data.toPandas()
result_data['major_countries_trends'] = {}
for country in major_countries:
country_data = major_countries_pandas[major_countries_pandas['Country'] == country]
result_data['major_countries_trends'][country] = {
'years': country_data['Year'].tolist(),
'consumption': country_data['Total Energy Consumption (TWh)'].tolist()
}
result_data['efficiency_ranking'] = [{"country": row["Country"], "efficiency_score": round(row["avg_efficiency"], 4)} for row in most_efficient.collect()]
return JsonResponse(result_data)
@csrf_exempt
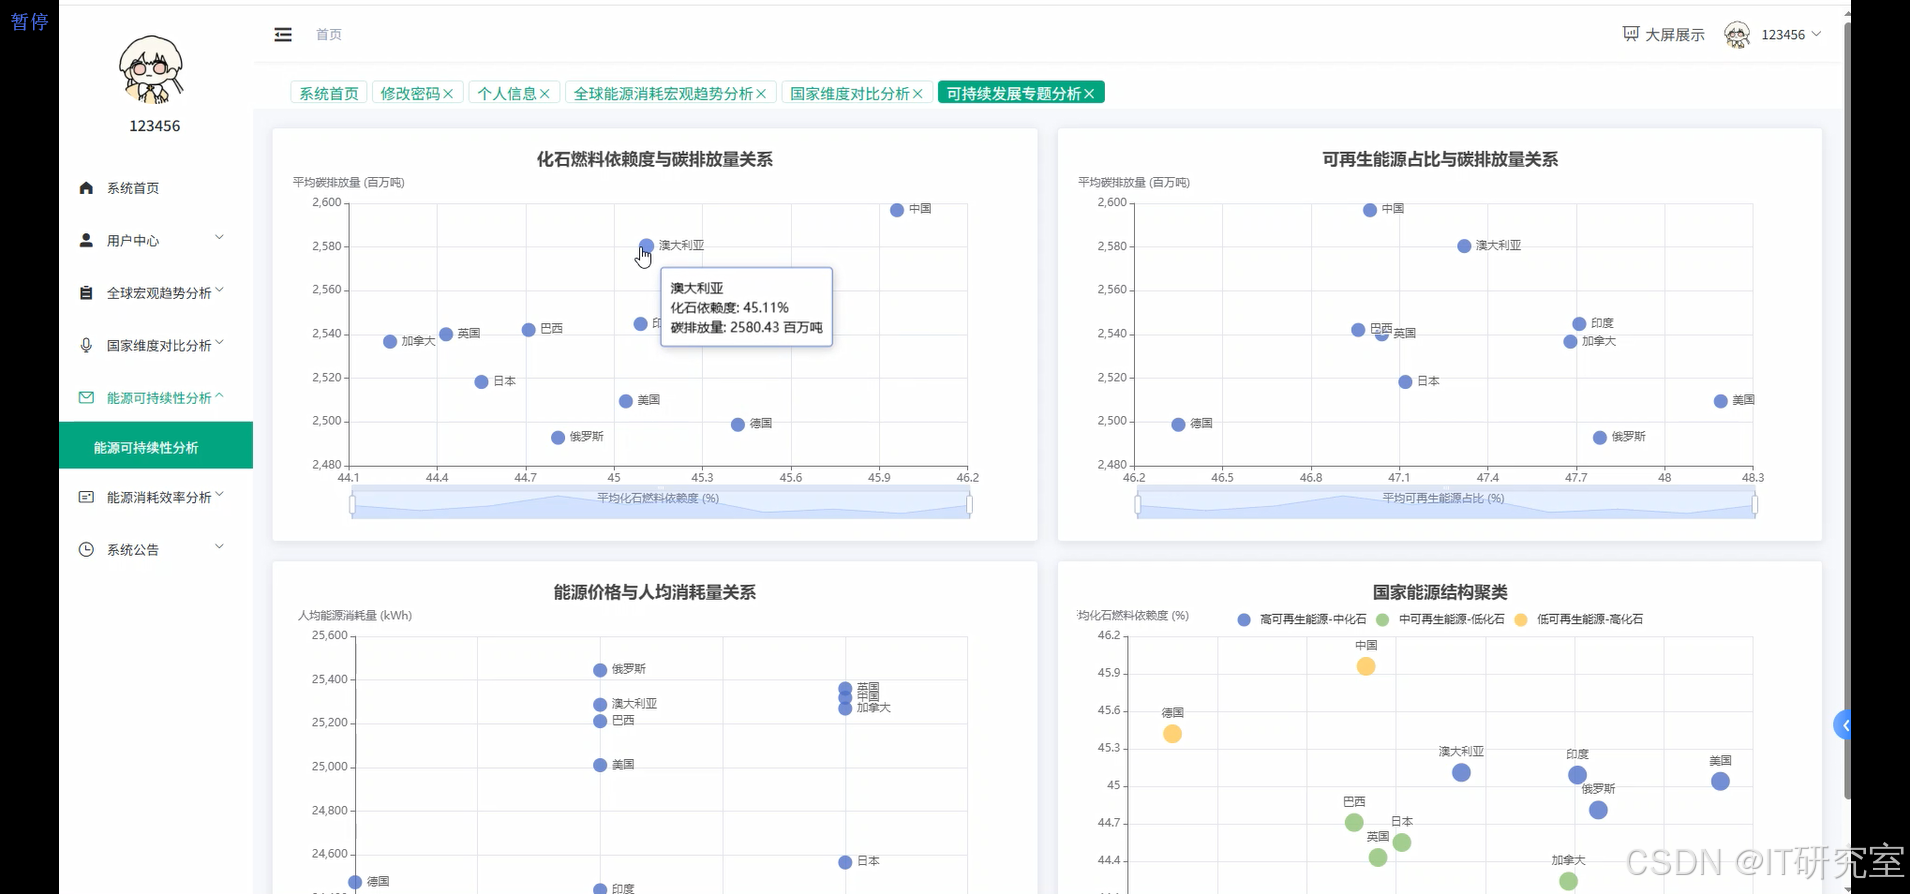
def energy_sustainability_analysis(request):
df = spark.read.option("header", "true").option("inferSchema", "true").csv("hdfs://localhost:9000/energy_data/global_energy_consumption.csv")
correlation_data = df.select("Country", "Fossil Fuel Dependency (%)", "Renewable Energy Share (%)", "Carbon Emissions (Million Tons)", "Energy Price Index (USD/kWh)", "Per Capita Energy Use (kWh)").groupBy("Country").agg(avg("Fossil Fuel Dependency (%)").alias("fossil_dependency"), avg("Renewable Energy Share (%)").alias("renewable_share"), avg("Carbon Emissions (Million Tons)").alias("avg_carbon"), avg("Energy Price Index (USD/kWh)").alias("avg_price"), avg("Per Capita Energy Use (kWh)").alias("avg_per_capita"))
pandas_corr = correlation_data.toPandas()
fossil_carbon_corr = pandas_corr['fossil_dependency'].corr(pandas_corr['avg_carbon'])
renewable_carbon_corr = pandas_corr['renewable_share'].corr(pandas_corr['avg_carbon'])
price_consumption_corr = pandas_corr['avg_price'].corr(pandas_corr['avg_per_capita'])
sustainability_score = df.withColumn("sustainability_score", (col("Renewable Energy Share (%)") * 0.4) + ((100 - col("Fossil Fuel Dependency (%)")) * 0.3) + ((1 / (col("Carbon Emissions (Million Tons)") + 1)) * 100 * 0.3))
country_sustainability = sustainability_score.groupBy("Country").agg(avg("sustainability_score").alias("avg_sustainability")).orderBy(desc("avg_sustainability"))
high_renewable_countries = correlation_data.filter(col("renewable_share") > 50).select("Country", "renewable_share", "avg_carbon").orderBy(desc("renewable_share"))
low_carbon_efficiency = correlation_data.withColumn("carbon_efficiency", col("avg_carbon") / col("avg_per_capita")).select("Country", "carbon_efficiency").orderBy(asc("carbon_efficiency")).limit(15)
energy_transition_potential = df.withColumn("transition_potential", when(col("Renewable Energy Share (%)") < 30, "高潜力").when(col("Renewable Energy Share (%)") < 60, "中等潜力").otherwise("低潜力"))
transition_stats = energy_transition_potential.groupBy("transition_potential").agg(count("Country").alias("country_count"))
result_analysis = {}
result_analysis['correlations'] = {
'fossil_carbon_correlation': round(fossil_carbon_corr, 3),
'renewable_carbon_correlation': round(renewable_carbon_corr, 3),
'price_consumption_correlation': round(price_consumption_corr, 3)
}
result_analysis['sustainability_ranking'] = [{"country": row["Country"], "sustainability_score": round(row["avg_sustainability"], 2)} for row in country_sustainability.limit(20).collect()]
result_analysis['high_renewable_leaders'] = [{"country": row["Country"], "renewable_percentage": round(row["renewable_share"], 1), "carbon_emissions": round(row["avg_carbon"], 1)} for row in high_renewable_countries.limit(10).collect()]
result_analysis['carbon_efficient_countries'] = [{"country": row["Country"], "efficiency_ratio": round(row["carbon_efficiency"], 4)} for row in low_carbon_efficiency.collect()]
result_analysis['transition_potential_distribution'] = {row["transition_potential"]: row["country_count"] for row in transition_stats.collect()}
scatter_data = []
for row in pandas_corr.itertuples():
scatter_data.append({
'country': row.Country,
'fossil_dependency': round(row.fossil_dependency, 1),
'renewable_share': round(row.renewable_share, 1),
'carbon_emissions': round(row.avg_carbon, 1),
'price_index': round(row.avg_price, 3),
'per_capita_use': round(row.avg_per_capita, 1)
})
result_analysis['scatter_plot_data'] = scatter_data
return JsonResponse(result_analysis)五、系统视频
基于大数据的全球能源消耗量数据分析与可视化系统项目视频:
大数据毕业设计选题推荐-基于大数据的全球能源消耗量数据分析与可视化系统-大数据-Spark-Hadoop-Bigdata
结语
大数据毕业设计选题推荐-基于大数据的全球能源消耗量数据分析与可视化系统-大数据-Spark-Hadoop-Bigdata
想看其他类型的计算机毕业设计作品也可以和我说~ 谢谢大家!
有技术这一块问题大家可以评论区交流或者私我~
大家可以帮忙点赞、收藏、关注、评论啦~
源码获取:⬇⬇⬇