今天给大家介绍下matplotlib如何保存单独的colorbar。
示例如下:
python
import matplotlib.pyplot as plt
import numpy as np
from scipy.io import savemat,loadmat
from PIL import Image
# 示例数据
data = np.random.rand(100, 100)

# 创建图形和轴
fig, ax = plt.subplots()

# 在轴上绘制图像
im = ax.imshow(data, cmap='viridis')
# ax.set_axis_off()
# plt.savefig('image.png', bbox_inches='tight', pad_inches=0) # bbox_inches='tight' 会尝试裁剪图像到内容的最小矩形区域,而 pad_inches=0 则确保没有额外的填充。)
# image = Image.open('image.png')
# # 注意:Pillow的resize方法接受一个元组,表示新的尺寸(宽度,高度)
# resized_image = image.resize(data.shape)
# # 保存调整大小后的图片
# resized_image.save('resized_image.png')

"""新建一个图层,用于绘制颜色条"""
fig2, ax2 = plt.subplots()
ax2.set_axis_off()
# 添加colorbar
cbar = fig2.colorbar(im, ax=ax2)
#  cbar.set_ticks(ticks=cticks)

# 去掉colorbar的边框(即Axes的边框)
cbar.ax.tick_params(which='both', size=0)  # 去掉刻度线
cbar.outline.set_visible(False)  # 如果直接可用,但通常不起作用,因为colorbar没有直接的outline属性

# 注意:Matplotlib的较新版本中,可能需要通过修改patches来去掉边框
# 但这通常不是必要的,因为上面的tick_params已经足够了
# 如果需要完全移除任何可能的边框痕迹,可以尝试以下(但通常不需要)
# for spine in cbar.ax.spines.values():
#     spine.set_visible(False)
保存colorbar的三种方式:
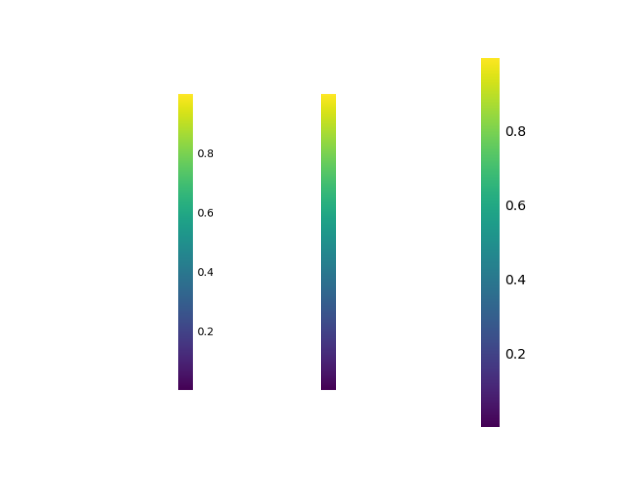
第一种方式:使用subplots_adjust调整子图
python
fig2.subplots_adjust(left=0.8, bottom=0, right=1, top=1)  # colorbar会自适应缩小,不美观
plt.savefig('cbar.png', bbox_inches='tight', pad_inches=0)
第二种方式:使用 get_window_extent() 获取当前颜色条的窗口,但其只保留颜色条,不保存标签之类的
python
fig2.subplots_adjust(left=0.8, bottom=0, right=1, top=1)
plt.savefig('cbar2.png', bbox_inches=cbar.ax.get_window_extent().transformed(fig2.dpi_scale_trans.inverted()), pad_inches=0)
第三种方式:使用 get_tightbbox() 获取当前颜色条,保留颜色条以及标签之类的
python
plt.savefig('cbar3.png', bbox_inches=cbar.ax.get_tightbbox(fig2.canvas.get_renderer()).transformed(fig2.dpi_scale_trans.inverted()), pad_inches=0) 最终结果展示:
python
# 关闭图形
plt.close(fig)
plt.close(fig2)

# 显示图形
plt.subplot(1,3,1)
plt.imshow(plt.imread('cbar.png'))
plt.axis('off')
plt.subplot(1,3,2)
plt.imshow(plt.imread('cbar2.png'))
plt.axis('off')
plt.subplot(1,3,3)
plt.imshow(plt.imread('cbar3.png'))
plt.axis('off')
plt.savefig('cbar4.png')