模糊神经网络从提出发展到今天,主要有三种形式:算术神经网络、逻辑模糊神经网络和混合模糊神经网络。算术神经网络是最基本的,它主要是对输入量进行模糊化,且网络结构中的权重也是模糊权重;逻辑模糊神经网络的主要特点是模糊权值可以进行逻辑运算操作;混合模糊神经网络是对于基本的模糊神经网络而言,其内的传统函数和模糊权值的运算都是随意的不同的。模糊神经网络发展到今天,已经从理论研究应用到工业生产和人们生活中的各个领域。模糊神经网络已经在模式识别、图像处理、工业控制生产等各个领域取得了不少成果。
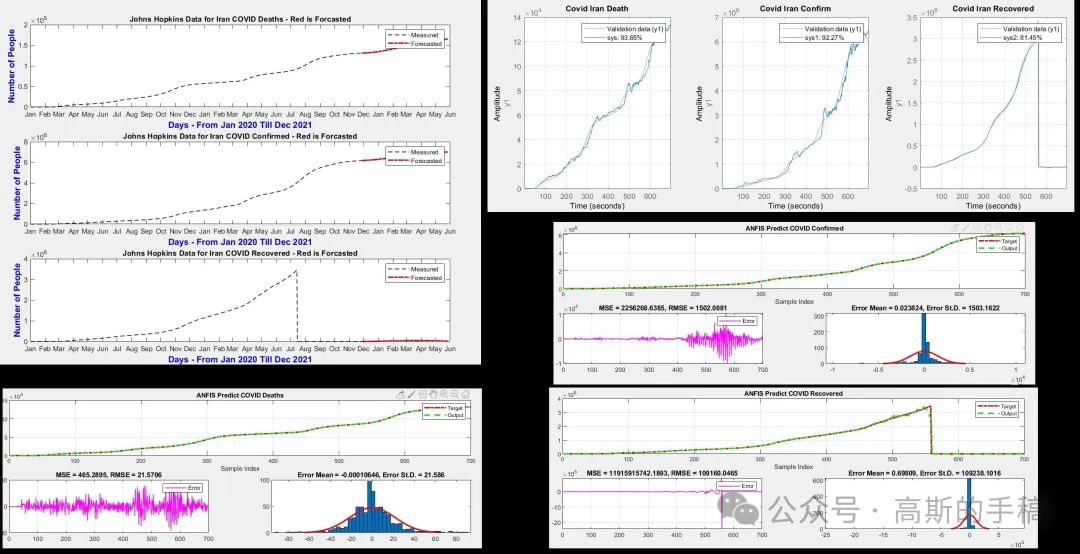
鉴于此,采用Takagi Sugeno Kang模糊神经网络对时间序列进行预测,以hopkinsirandeat数据为例进行说明,程序运行环境为MATLAB R2021B。主运行代码如下:
Matlab
close all;clc;clear all
dat=load('hopkinsirandeath.txt')';
dat1=load('hopkinsiranconfirmed.txt')';
dat2=load('hopkinsiranrecovered.txt')';

% Nonlinear ARX model to fit
sys = nlarx(dat,64);
sys1 = nlarx(dat1,64);
sys2 = nlarx(dat2,64);

% Compare the simulated output of sys with measured data to ensure it is a good fit.
nstep = 40;
figure;
set(gcf, 'Position',  [50, 200, 1300, 400])
subplot(1,3,1)
compare(dat,sys,nstep);title('Covid Iran Death');
grid on;
subplot(1,3,2)
compare(dat1,sys1,nstep);title('Covid Iran Confirm');
grid on;
subplot(1,3,3)
compare(dat2,sys2,2);title('Covid Iran Recovered');
grid on;
% Forecast the values into the future for a given time horizon K.
% K is number of days
K = 180;
opt = forecastOptions('InitialCondition','e');
[p,ForecastMSE] = forecast(sys,dat,K,opt);
[p1,ForecastMSE1] = forecast(sys1,dat1,K,opt);
[p2,ForecastMSE2] = forecast(sys2,dat2,K,opt);

datsize=size(dat);datsize=datsize(1,1);
ylbl=datsize+K;
t = linspace(datsize,ylbl,length(p));
figure;
set(gcf, 'Position',  [1, 1, 1000, 950])
subplot(3,1,1)
plot(dat,'--',...
    'LineWidth',1,...
    'MarkerSize',5,...
    'Color',[0,0,0]);
hold on;
plot(t,p,'-.',...
    'LineWidth',2,...
    'MarkerSize',10,...
    'MarkerEdgeColor','r',...
    'Color',[0.9,0,0]);
title('Johns Hopkins Data for Iran COVID Deaths - Red is Forcasted')
xlabel('Days - From Jan 2020 Till Dec 2021','FontSize',12,...
       'FontWeight','bold','Color','b');
ylabel('Number of People','FontSize',12,...
       'FontWeight','bold','Color','b');
   datetick('x','mmm');
legend({'Measured','Forecasted'});
    subplot(3,1,2)
plot(dat1,'--',...
    'LineWidth',1,...
    'MarkerSize',5,...
    'Color',[0,0,0]);
hold on;
plot(t,p1,'-.',...
    'LineWidth',2,...
    'MarkerSize',10,...
    'MarkerEdgeColor','r',...
    'Color',[0.9,0,0]);
title('Johns Hopkins Data for Iran COVID Confirmed - Red is Forcasted')
xlabel('Days - From Jan 2020 Till Dec 2021','FontSize',12,...
       'FontWeight','bold','Color','b');
ylabel('Number of People','FontSize',12,...
       'FontWeight','bold','Color','b');
   datetick('x','mmm');
legend({'Measured','Forecasted'});
subplot(3,1,3)
plot(dat2,'--',...
    'LineWidth',1,...
    'MarkerSize',5,...
    'Color',[0,0,0]);
hold on;
plot(t,p2,'-.',...
    'LineWidth',2,...
    'MarkerSize',10,...
    'MarkerEdgeColor','r',...
    'Color',[0.9,0,0]);
title('Johns Hopkins Data for Iran COVID Recovered - Red is Forcasted')
xlabel('Days - From Jan 2020 Till Dec 2021','FontSize',12,...
       'FontWeight','bold','Color','b');
ylabel('Number of People','FontSize',12,...
       'FontWeight','bold','Color','b');
   datetick('x','mmm');
legend({'Measured','Forecasted'});
%
finalpredict=[dat;p];
finalpredict1=[dat1;p1];
finalpredict2=[dat2;p2];

%% Predicting original and forcasted data using ANFIS (FCM)
[TrainTargets,TrainOutputs]=fuzzfcm(finalpredict);
figure;
set(gcf, 'Position',  [10, 50, 1100, 300])
Plotit(TrainTargets,TrainOutputs,'ANFIS Predict COVID Deaths');
%
[TrainTargets,TrainOutputs]=fuzzfcm(finalpredict1);
figure;
set(gcf, 'Position',  [50, 100, 1100, 300])
Plotit(TrainTargets,TrainOutputs,'ANFIS Predict COVID Confirmed');
%
[TrainTargets,TrainOutputs]=fuzzfcm(finalpredict2);
figure;
set(gcf, 'Position',  [70, 130, 1100, 300])
Plotit(TrainTargets,TrainOutputs,'ANFIS Predict COVID Recovered');

完整代码:https://mbd.pub/o/bread/mbd-ZJWWm5hv


擅长领域:现代信号处理,机器学习,深度学习,数字孪生,时间序列分析,设备缺陷检测、设备异常检测、设备智能故障诊断与健康管理PHM等。