🍊作者:计算机毕设匠心工作室
🍊简介:毕业后就一直专业从事计算机软件程序开发,至今也有8年工作经验。擅长Java、Python、微信小程序、安卓、大数据、PHP、.NET|C#、Golang等。
擅长:按照需求定制化开发项目、 源码、对代码进行完整讲解、文档撰写、ppt制作。
🍊心愿:点赞 👍 收藏 ⭐评论 📝
👇🏻 精彩专栏推荐订阅 👇🏻 不然下次找不到哟~
Java实战项目
Python实战项目
微信小程序|安卓实战项目
大数据实战项目
PHP|C#.NET|Golang实战项目🍅 ↓↓文末获取源码联系↓↓🍅
这里写目录标题
- 基于大数据的食物口味差异数据分析与可视化系统-功能介绍
- 基于大数据的食物口味差异数据分析与可视化系统-选题背景意义
- 基于大数据的食物口味差异数据分析与可视化系统-技术选型
- 基于大数据的食物口味差异数据分析与可视化系统-视频展示
- 基于大数据的食物口味差异数据分析与可视化系统-图片展示
- 基于大数据的食物口味差异数据分析与可视化系统-代码展示
- 基于大数据的食物口味差异数据分析与可视化系统-结语
基于大数据的食物口味差异数据分析与可视化系统-功能介绍
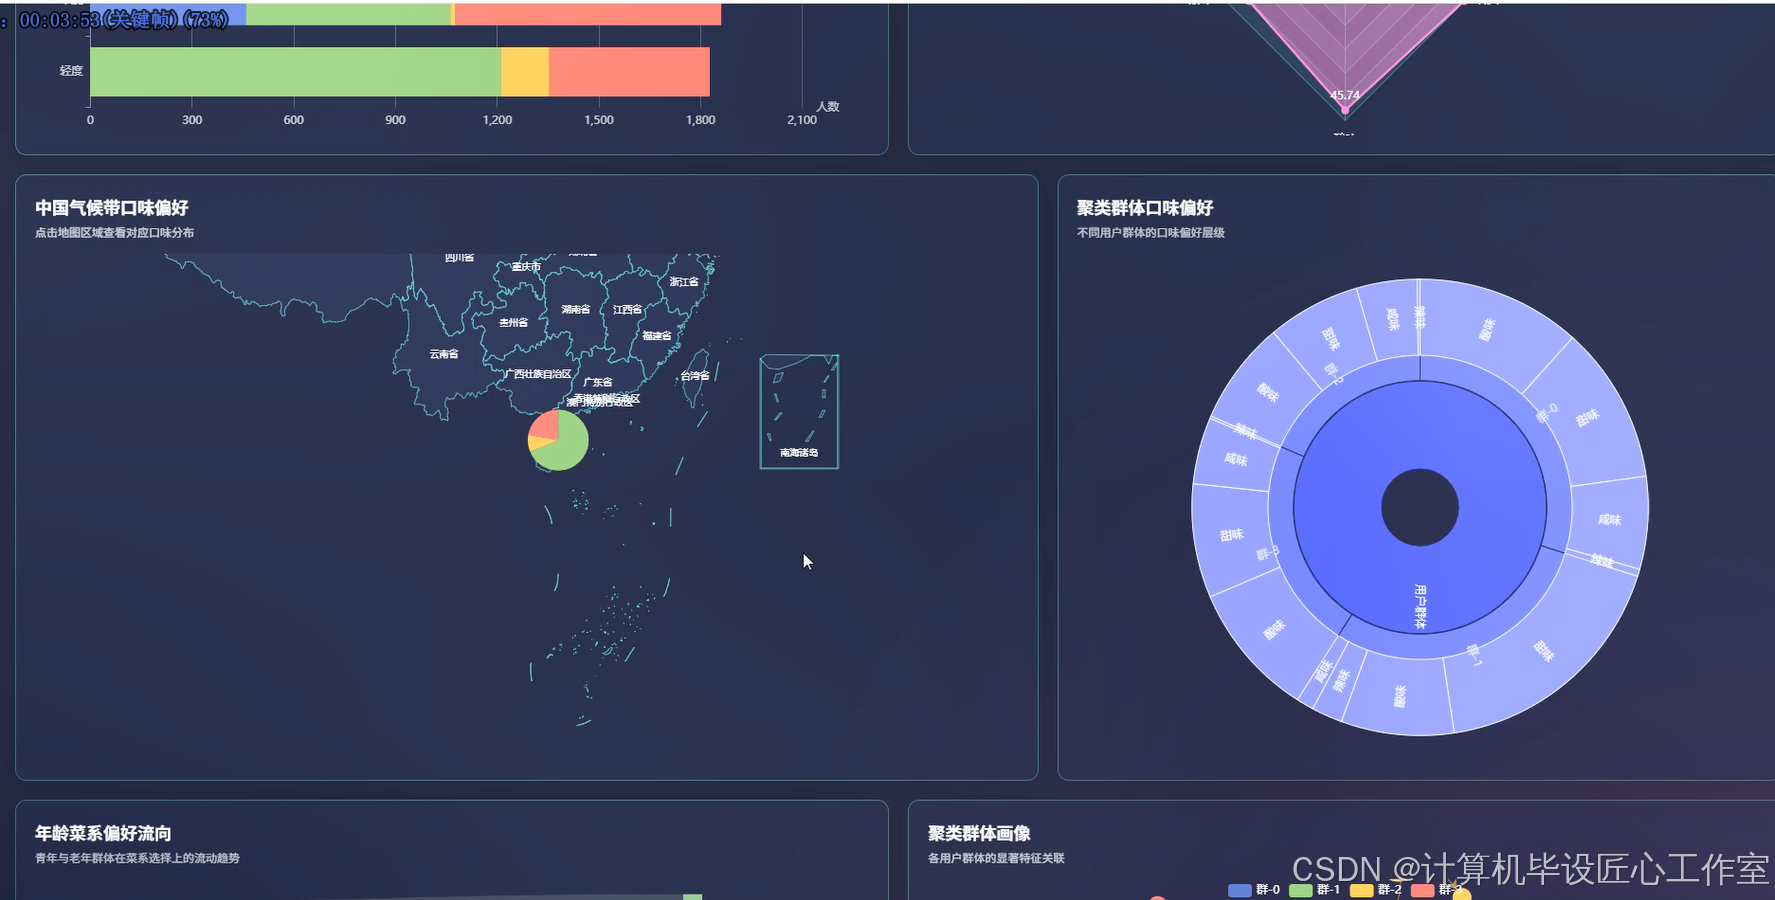
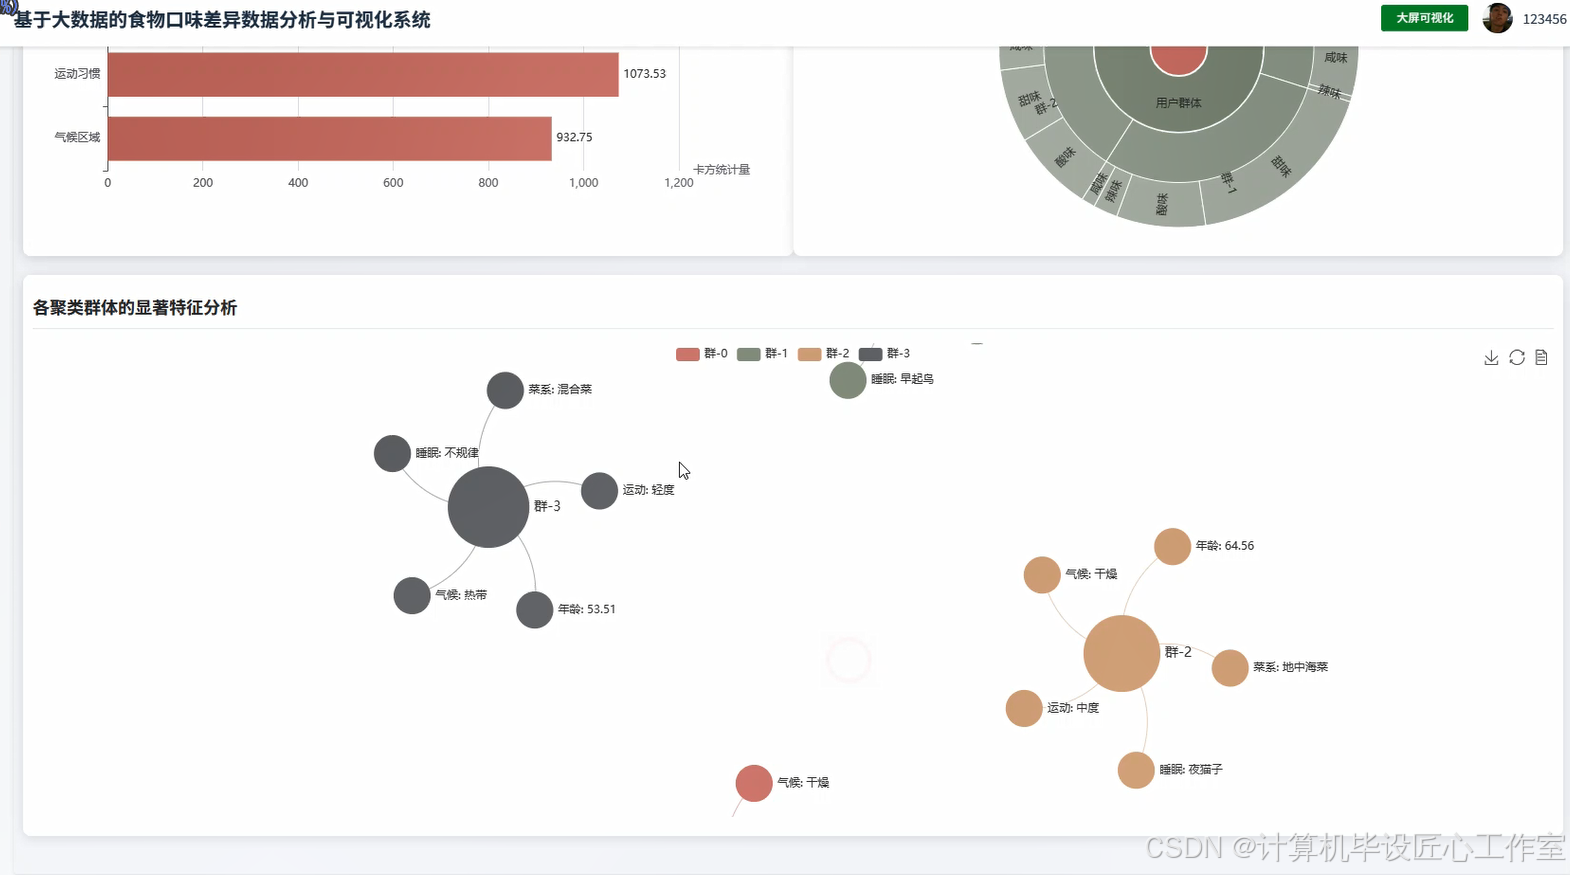
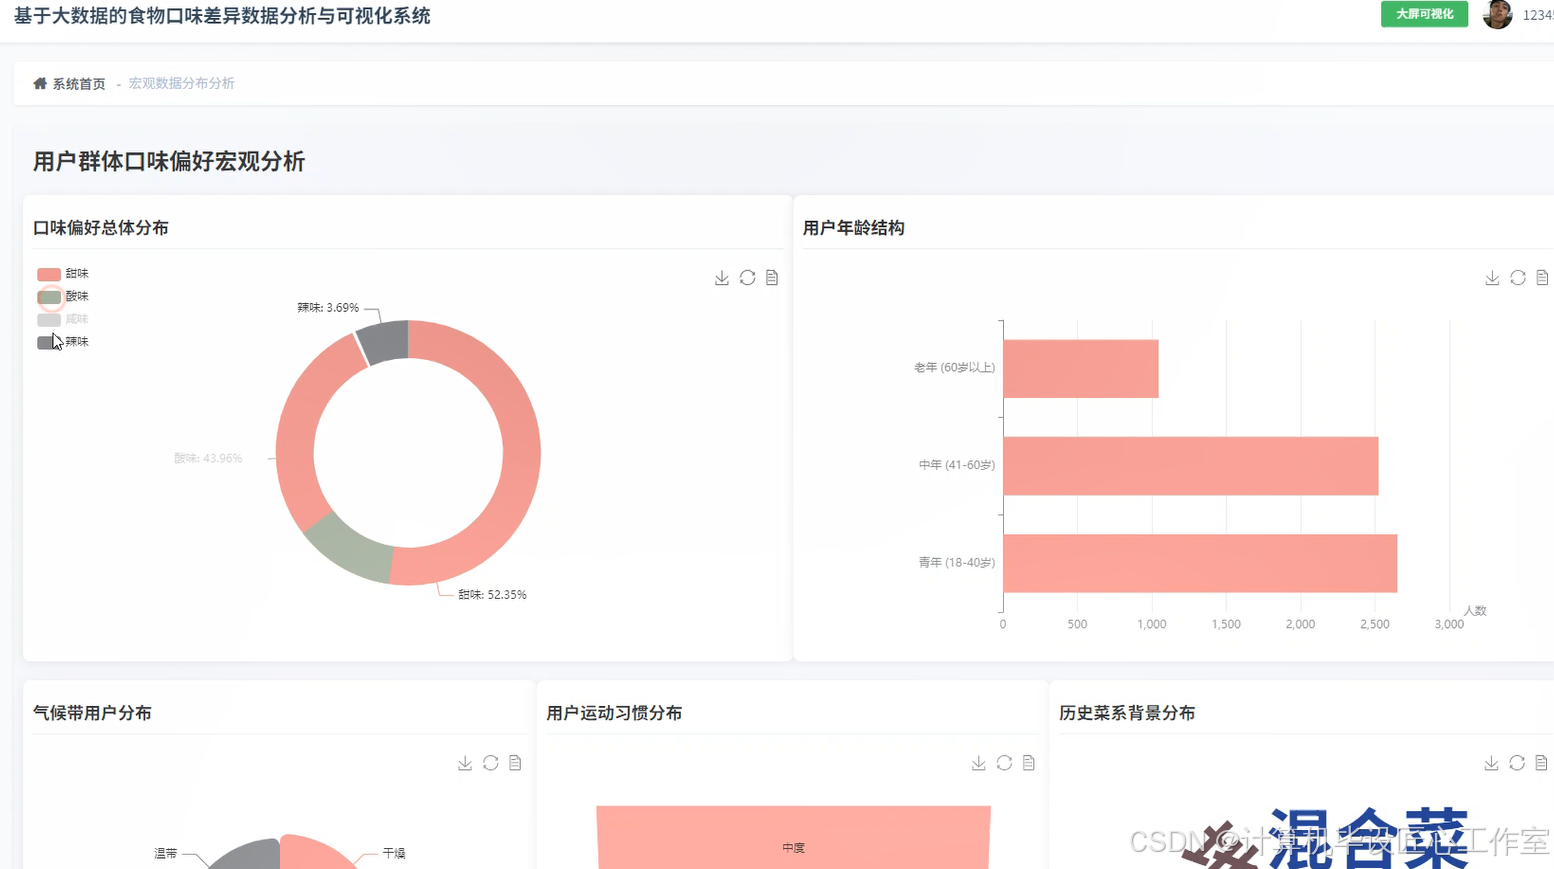
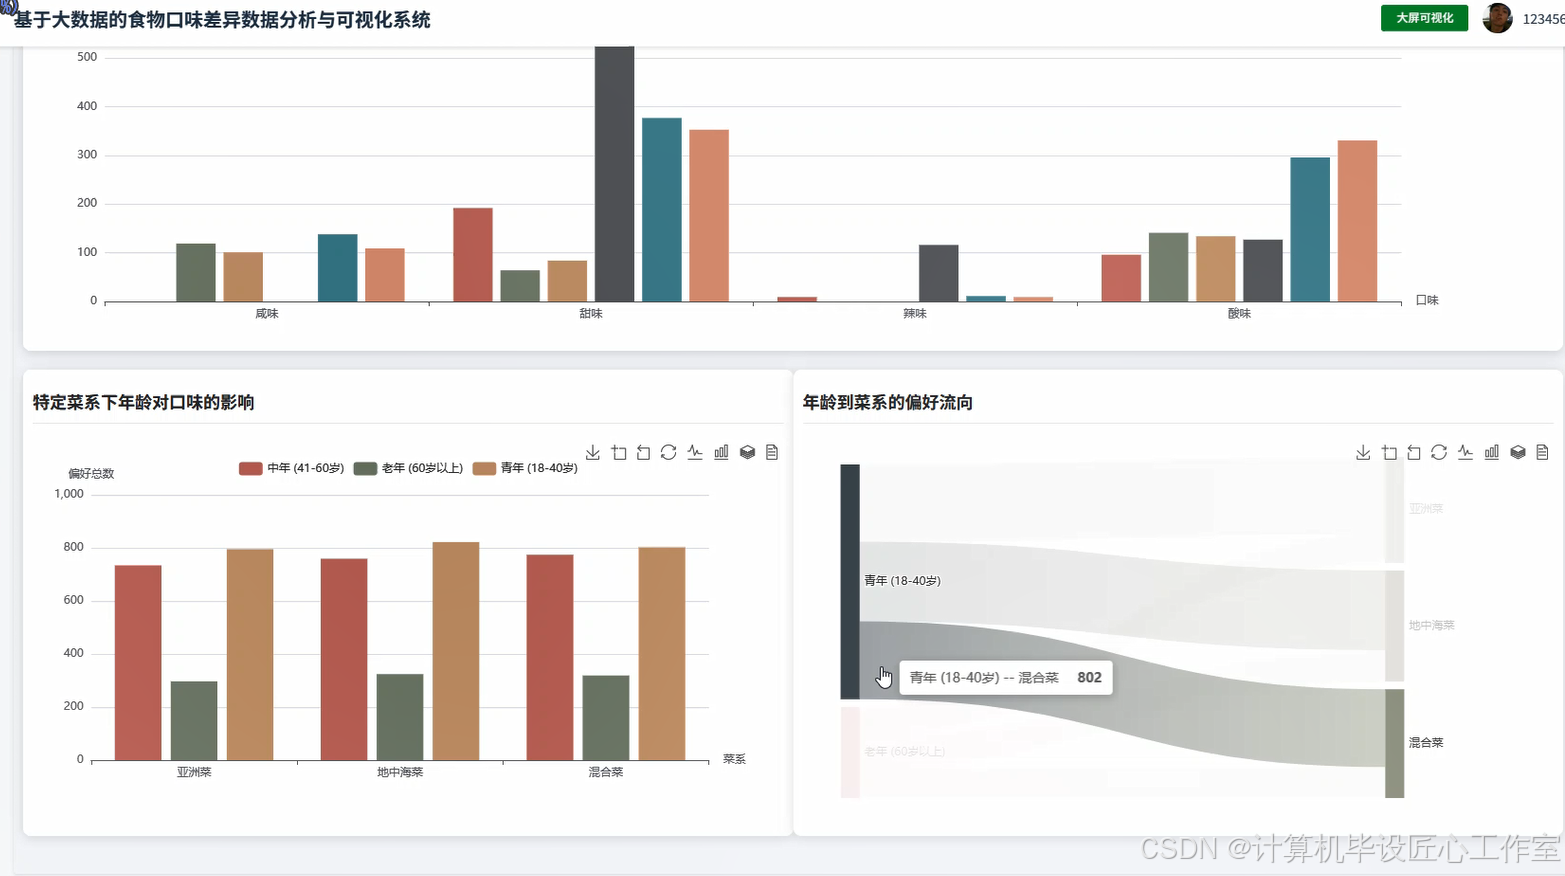
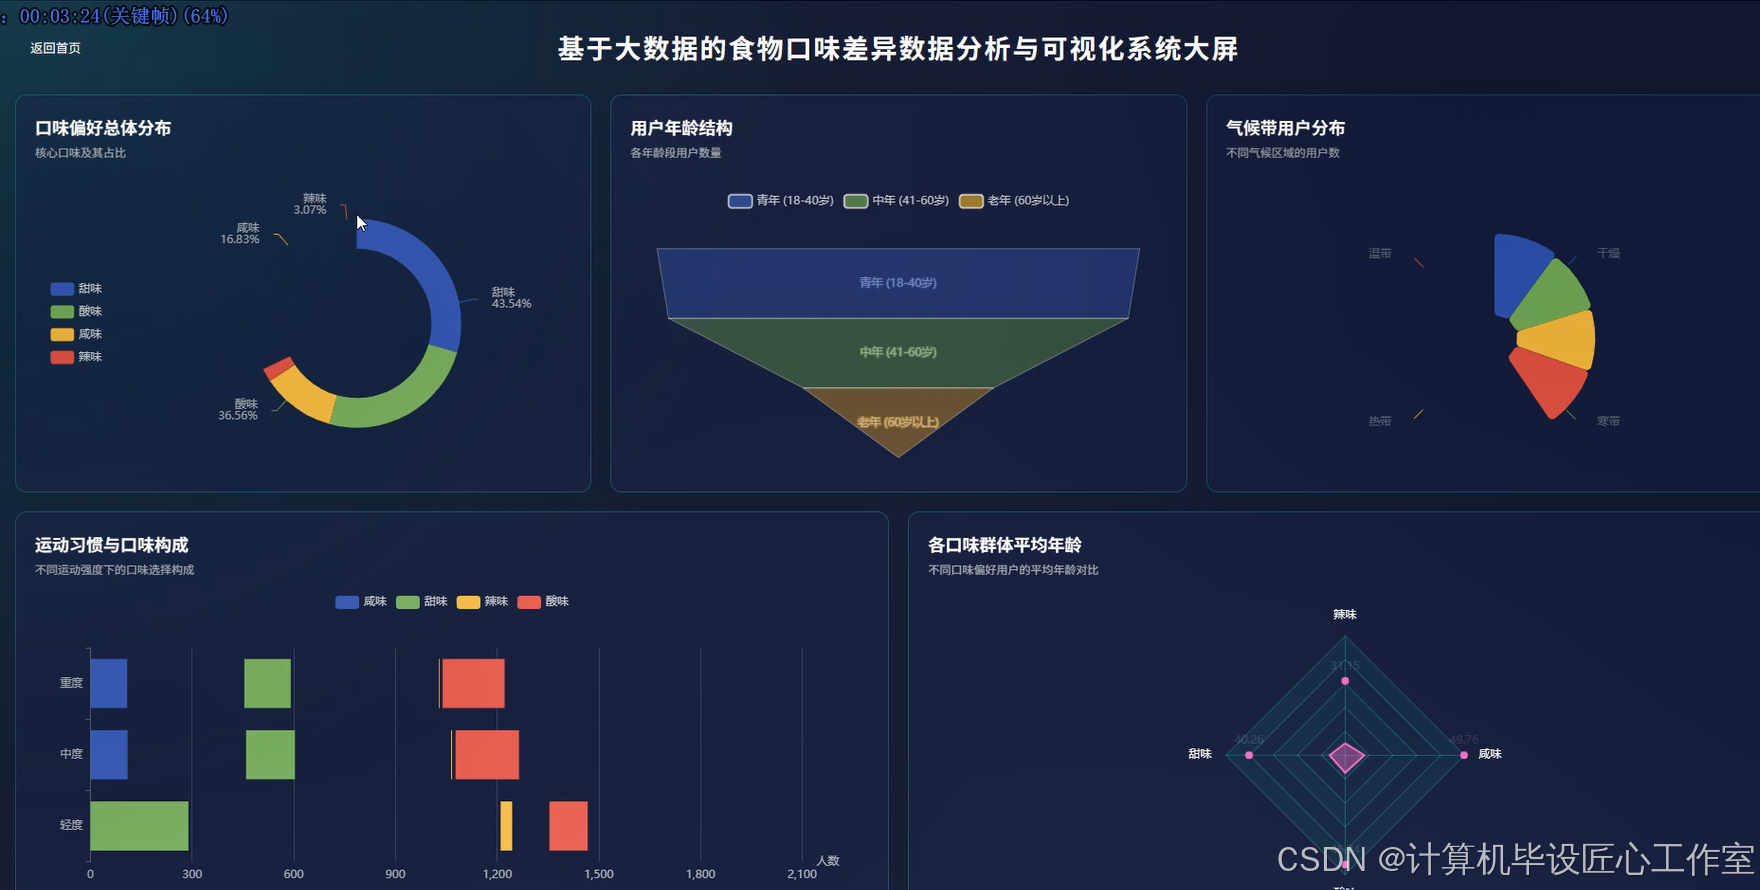
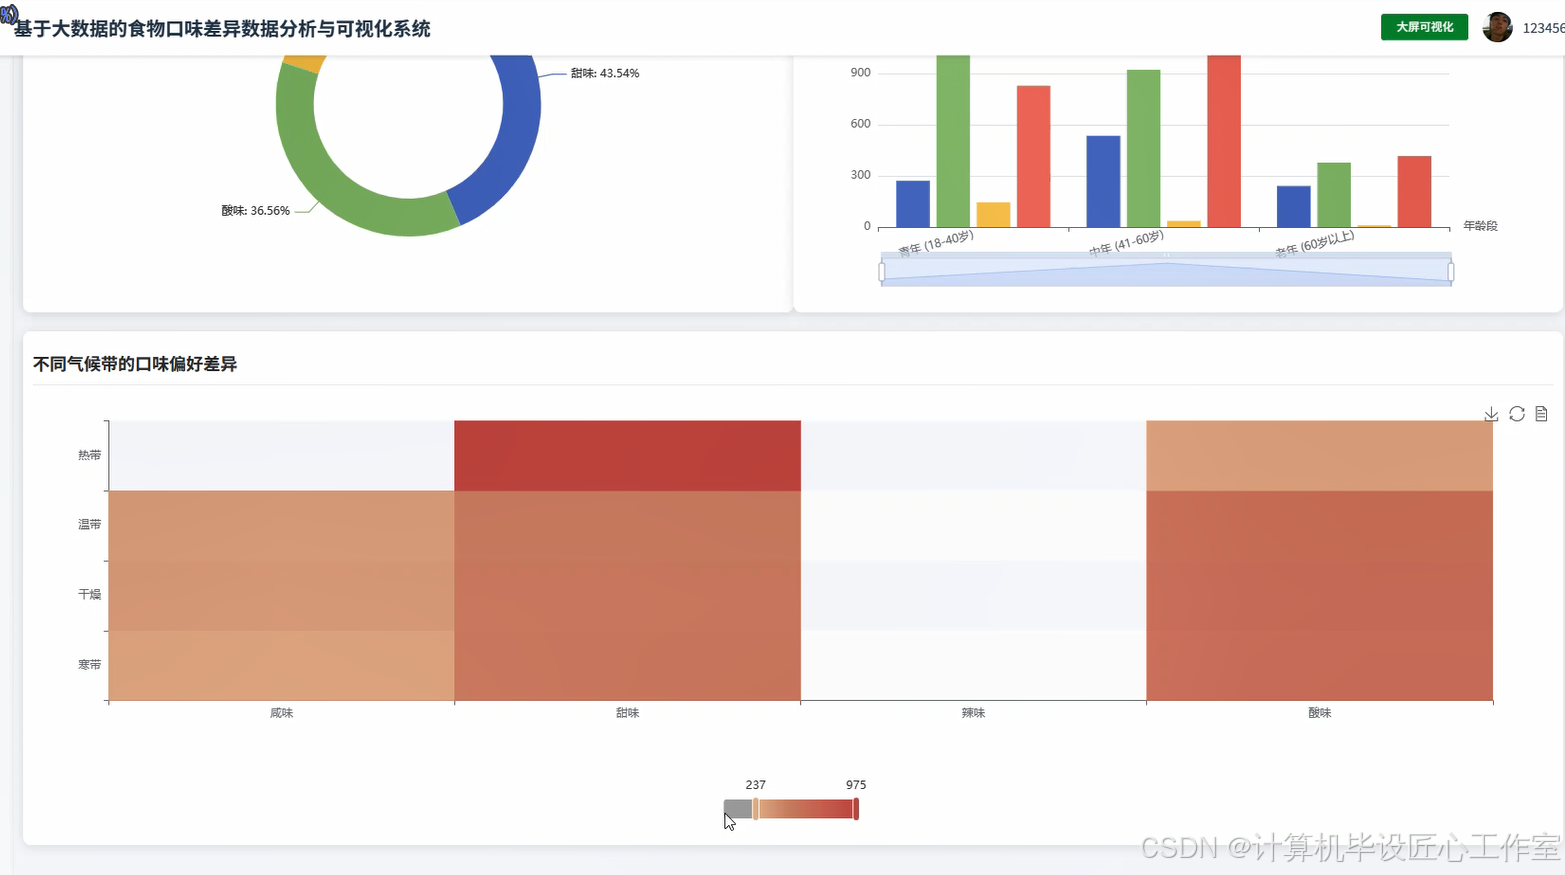
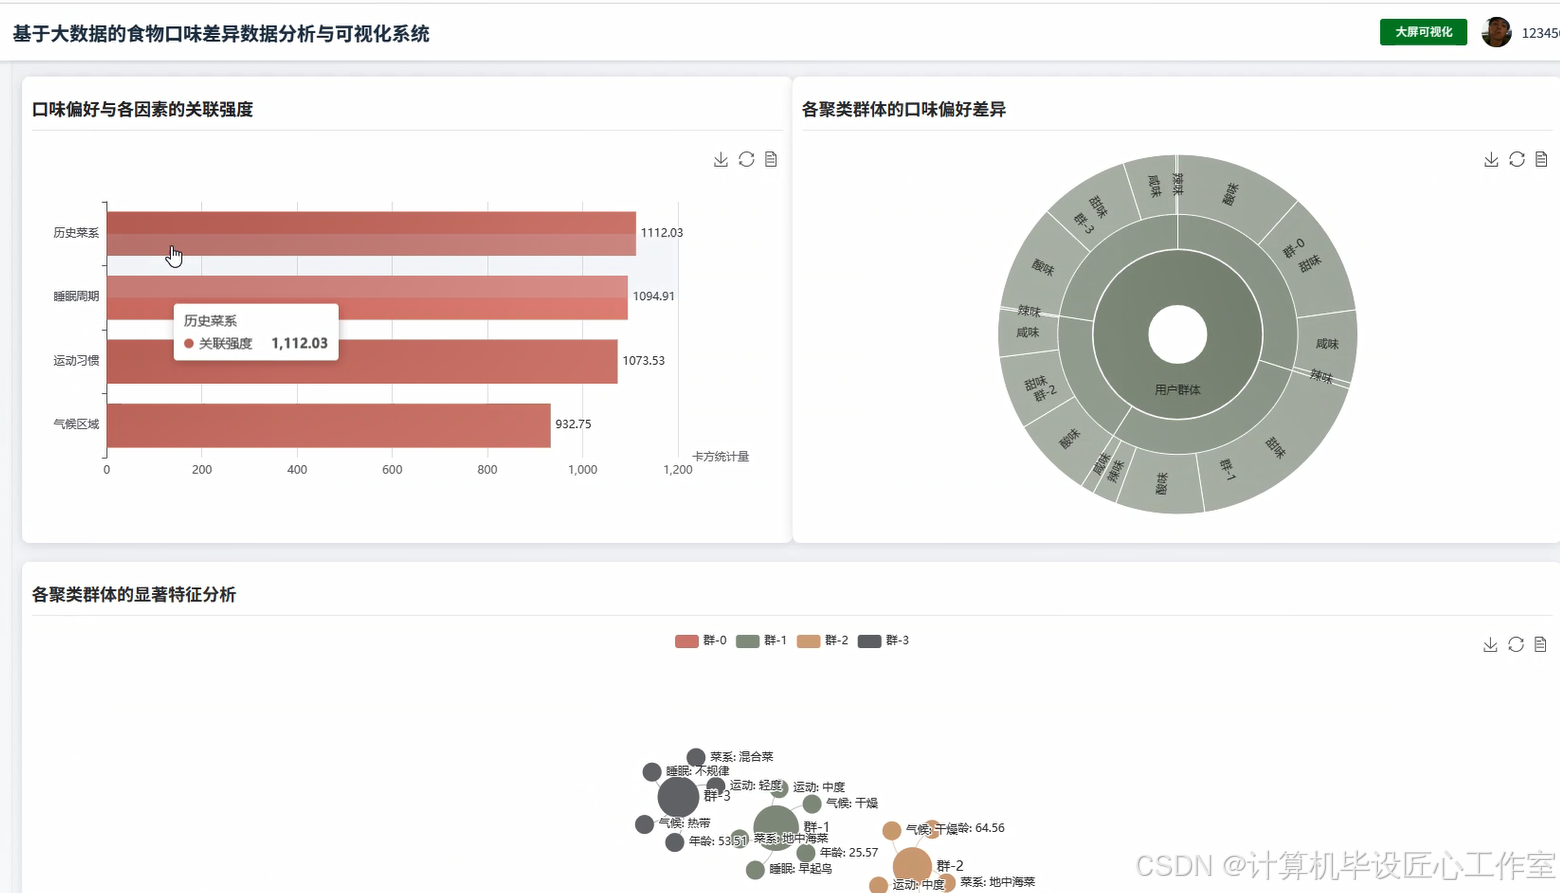
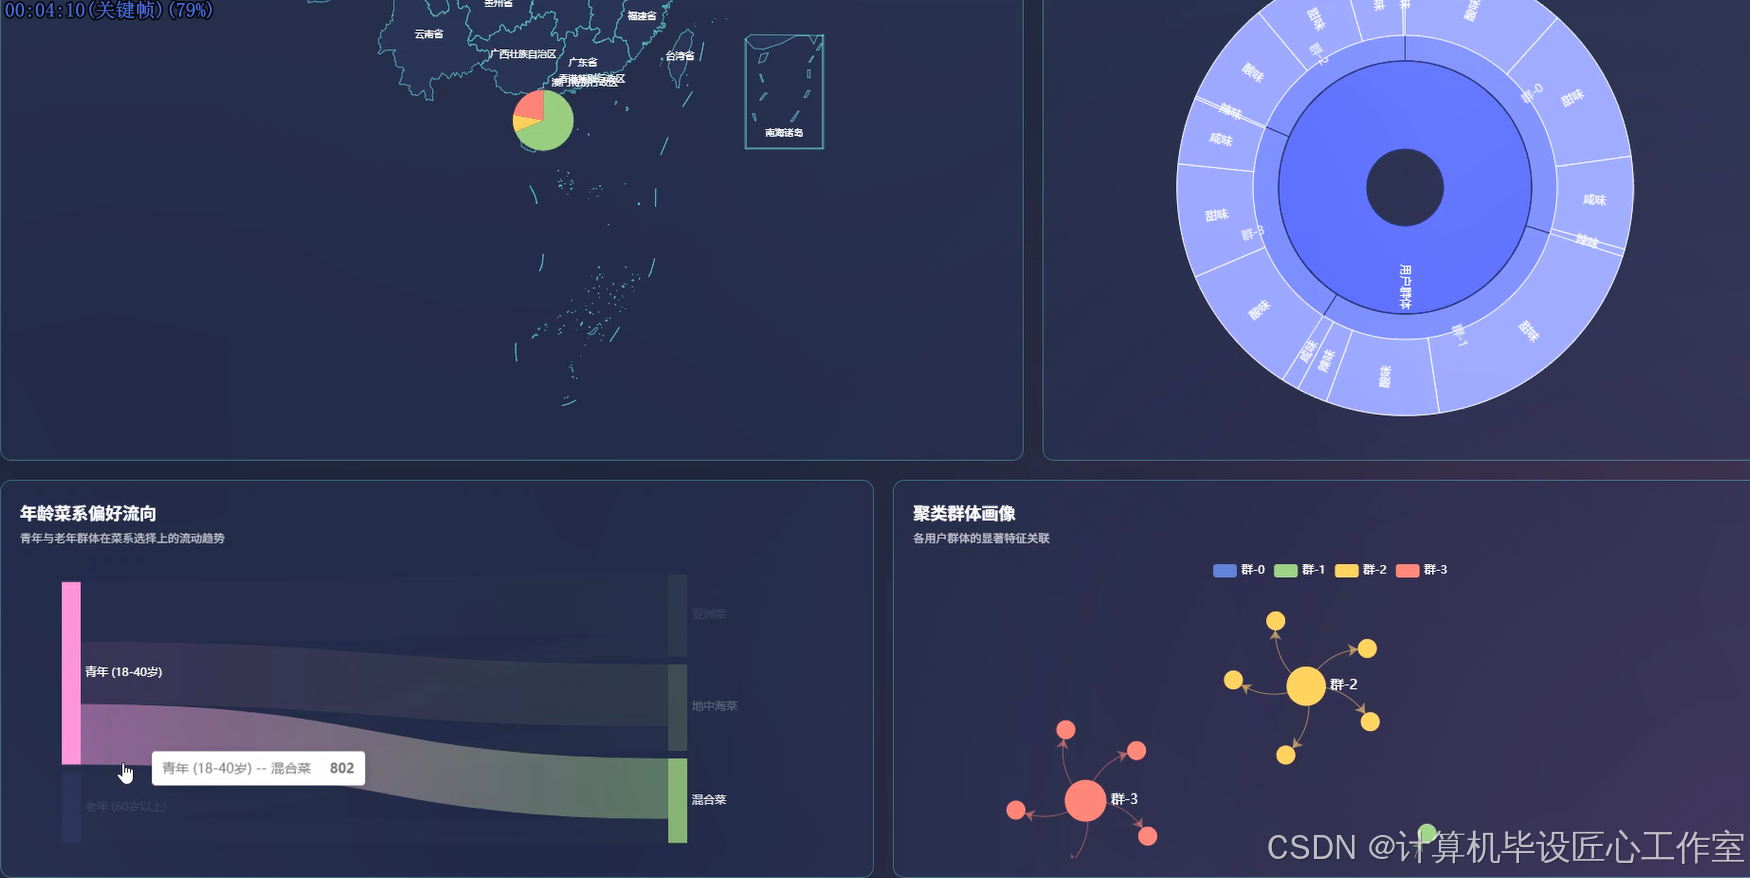
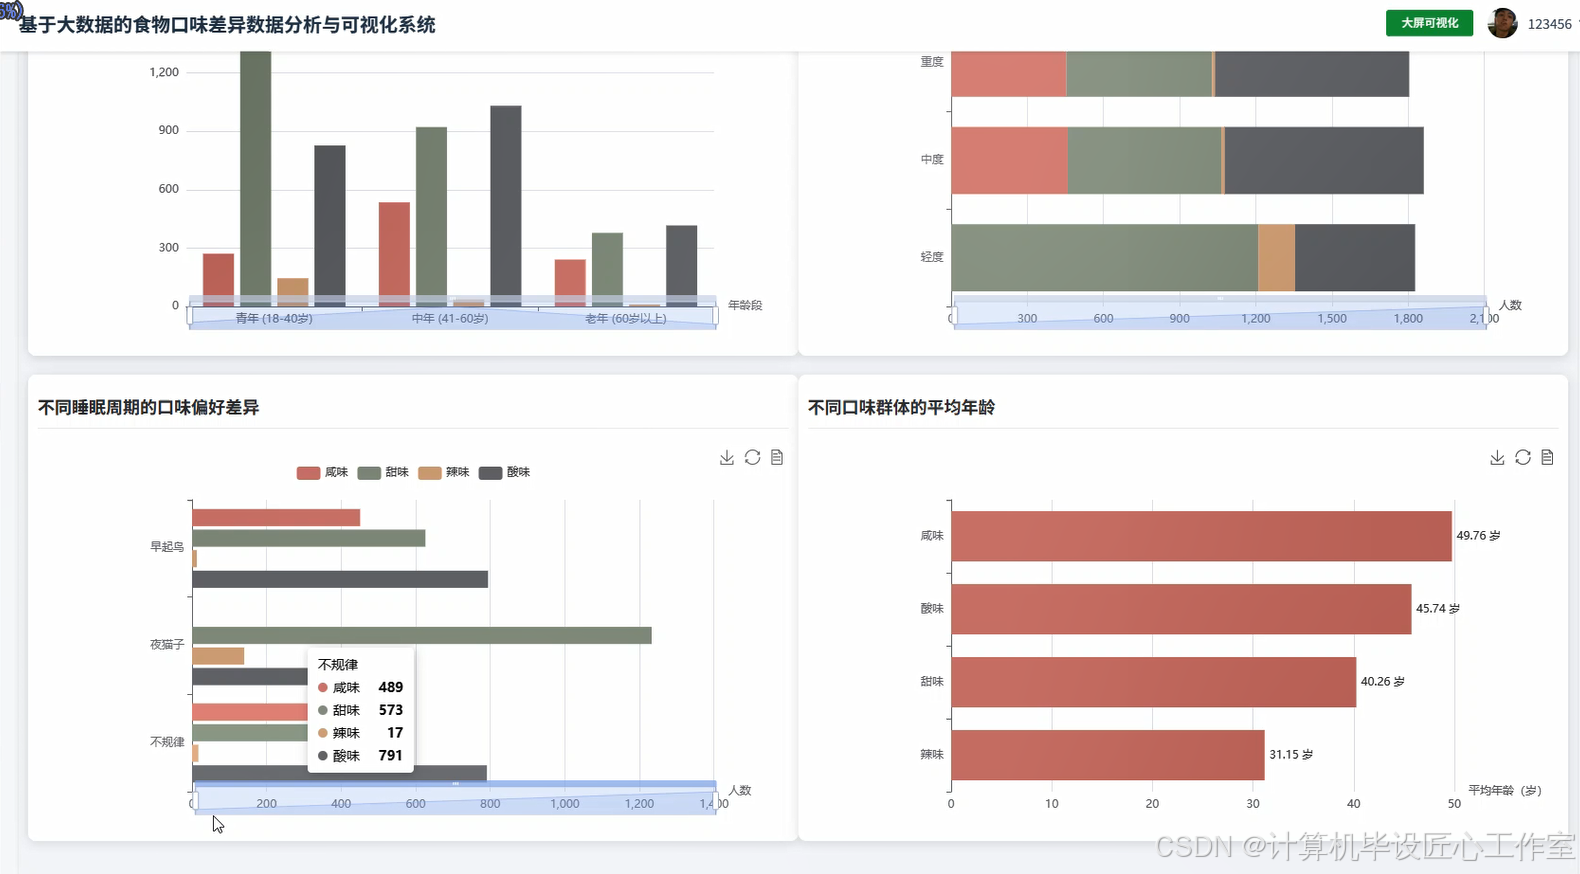
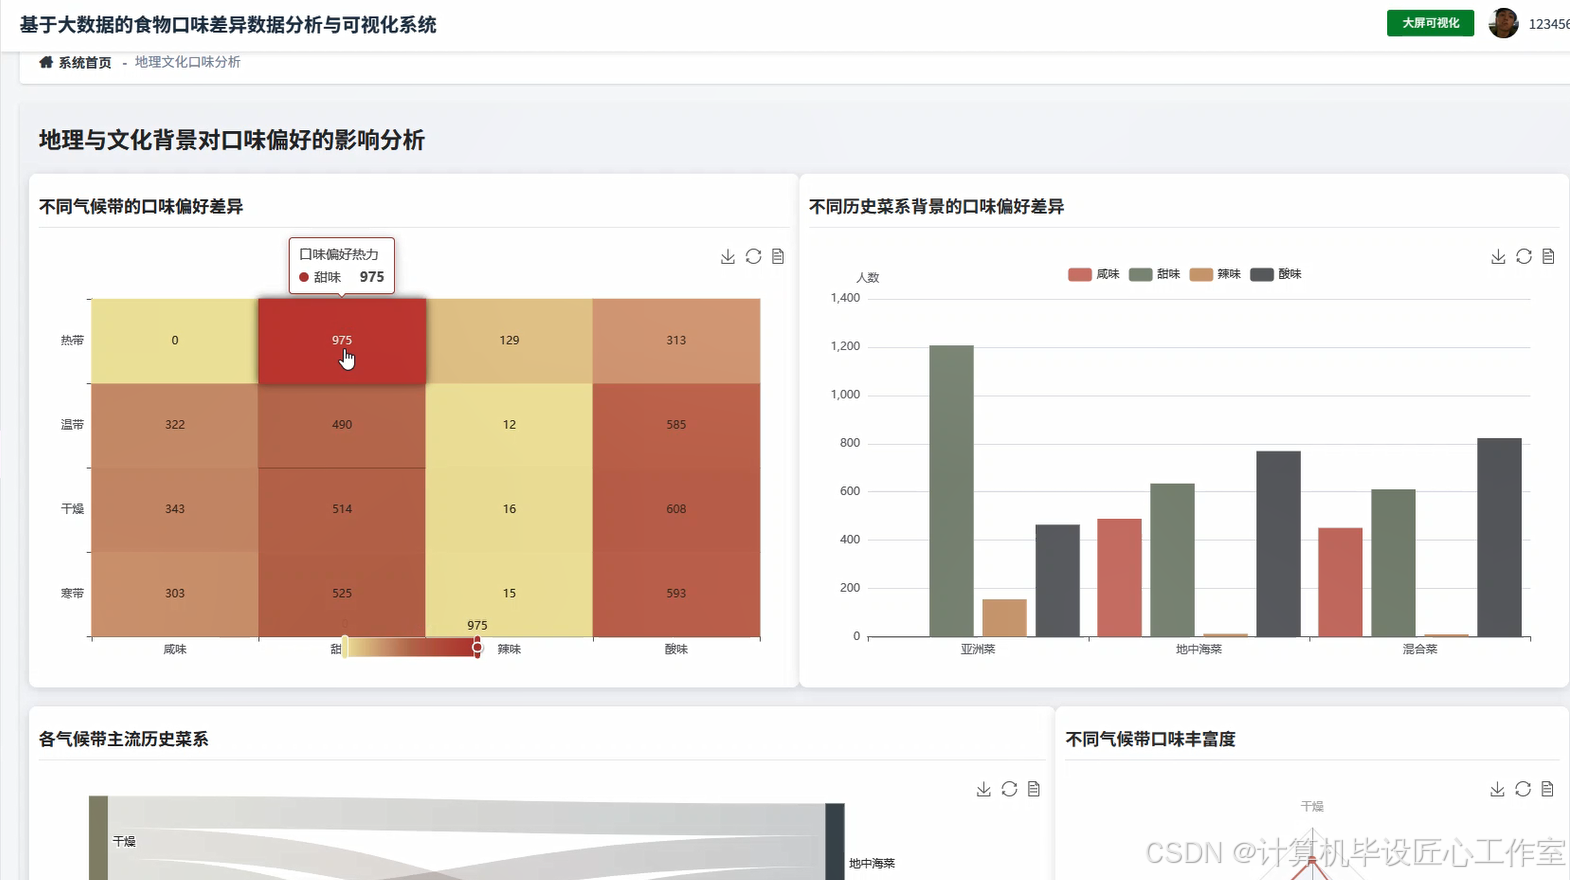
基于大数据的食物口味差异数据分析与可视化系统是一个综合运用Hadoop+Spark大数据技术栈的数据分析平台,专门针对用户口味偏好进行深度挖掘和可视化展示。系统采用HDFS作为分布式存储层,利用Spark SQL进行大规模数据处理和分析计算,通过Python数据科学库Pandas、NumPy配合Spark进行多维度口味差异分析。后端基于Django框架构建RESTful API接口,前端使用Vue+ElementUI搭建交互界面,集成Echarts图表库实现数据可视化展示。系统围绕用户群体口味偏好宏观分析、个体生活习惯与口味关联分析、地理文化背景影响分析、多维度交叉因素探索以及用户聚类特征分析五大核心维度,通过对年龄、运动习惯、睡眠周期、气候带、历史菜系背景等多个维度进行交叉分析,揭示不同人群的口味偏好差异规律,为个性化饮食推荐和食品行业决策提供数据支撑。
基于大数据的食物口味差异数据分析与可视化系统-选题背景意义
选题背景
随着人们生活水平的不断提高和饮食文化的日益丰富,个体化的口味偏好逐渐成为影响消费选择的重要因素。不同地域、年龄、生活习惯的人群在食物口味选择上表现出显著差异,这种差异背后蕴含着深层的文化、地理、生理和心理因素。传统的口味偏好研究多依赖小样本调研和经验判断,缺乏系统性的大规模数据分析支撑。随着大数据技术的成熟发展,特别是Hadoop生态系统和Spark计算引擎的广泛应用,为处理海量用户口味数据提供了强有力的技术基础。现代食品行业、餐饮企业以及个性化营养服务对精准的口味偏好分析需求日益迫切,需要通过科学的数据分析方法来挖掘用户口味偏好背后的规律和影响因素,为产品开发、市场定位和个性化推荐提供决策依据。
选题意义
本研究通过构建大数据驱动的食物口味差异分析系统,为理解和预测用户口味偏好提供了一个较为完整的技术解决方案。从技术角度来看,系统集成了当前主流的大数据处理技术栈,在一定程度上验证了Hadoop+Spark架构在用户行为分析领域的适用性,为类似的数据分析项目提供了参考案例。从应用价值来说,系统能够帮助食品企业和餐饮行业更好地了解目标用户群体的口味倾向,在产品研发和营销策略制定时提供一些数据参考。对于个人用户而言,基于科学数据分析的口味偏好洞察有助于个性化饮食规划和健康管理。从学术研究层面来看,多维度的口味差异分析丰富了食品科学和消费者行为研究的数据基础,为后续相关研究提供了方法论支持。作为一个毕业设计项目,该系统在技术实现和业务逻辑方面都有一定的复杂度,能够较好地展示大数据技术在实际场景中的应用能力。
基于大数据的食物口味差异数据分析与可视化系统-技术选型
大数据框架:Hadoop+Spark(本次没用Hive,支持定制)
开发语言:Python+Java(两个版本都支持)
后端框架:Django+Spring Boot(Spring+SpringMVC+Mybatis)(两个版本都支持)
前端:Vue+ElementUI+Echarts+HTML+CSS+JavaScript+jQuery
详细技术点:Hadoop、HDFS、Spark、Spark SQL、Pandas、NumPy
数据库:MySQL
基于大数据的食物口味差异数据分析与可视化系统-视频展示
紧跟大数据技术趋势:食物口味分析系统Spark SQL+HDFS最新架构实现
基于大数据的食物口味差异数据分析与可视化系统-图片展示

基于大数据的食物口味差异数据分析与可视化系统-代码展示
python
from pyspark.sql import SparkSession
from pyspark.sql.functions import col, count, avg, desc, asc, when
from pyspark.sql.types import IntegerType
import pandas as pd

def taste_preference_distribution_analysis(spark, hdfs_path):
    df = spark.read.option("header", "true").csv(hdfs_path)
    taste_distribution = df.groupBy("preferred_taste").agg(count("*").alias("user_count")).orderBy(desc("user_count"))
    total_users = df.count()
    taste_distribution_with_percentage = taste_distribution.withColumn("percentage", (col("user_count") / total_users * 100).cast("decimal(5,2)"))
    age_segments = df.withColumn("age_segment", when(col("age").cast(IntegerType()) < 18, "少年").when(col("age").cast(IntegerType()) <= 40, "青年").when(col("age").cast(IntegerType()) <= 60, "中年").otherwise("老年"))
    age_distribution = age_segments.groupBy("age_segment").agg(count("*").alias("count")).orderBy(desc("count"))
    climate_distribution = df.groupBy("climate_zone").agg(count("*").alias("count")).orderBy(desc("count"))
    exercise_distribution = df.groupBy("exercise_habits").agg(count("*").alias("count")).orderBy(desc("count"))
    cuisine_distribution = df.groupBy("historical_cuisine_exposure").agg(count("*").alias("count")).orderBy(desc("count"))
    taste_stats = taste_distribution_with_percentage.collect()
    age_stats = age_distribution.collect()
    climate_stats = climate_distribution.collect()
    exercise_stats = exercise_distribution.collect()
    cuisine_stats = cuisine_distribution.collect()
    result_data = {"taste_preference": [{"taste": row["preferred_taste"], "count": row["user_count"], "percentage": float(row["percentage"])} for row in taste_stats], "age_distribution": [{"segment": row["age_segment"], "count": row["count"]} for row in age_stats], "climate_distribution": [{"zone": row["climate_zone"], "count": row["count"]} for row in climate_stats], "exercise_distribution": [{"habit": row["exercise_habits"], "count": row["count"]} for row in exercise_stats], "cuisine_distribution": [{"cuisine": row["historical_cuisine_exposure"], "count": row["count"]} for row in cuisine_stats]}
    return result_data

def age_taste_correlation_analysis(spark, hdfs_path):
    df = spark.read.option("header", "true").csv(hdfs_path)
    age_segments = df.withColumn("age_segment", when(col("age").cast(IntegerType()) < 18, "少年").when(col("age").cast(IntegerType()) <= 40, "青年").when(col("age").cast(IntegerType()) <= 60, "中年").otherwise("老年"))
    age_taste_cross = age_segments.groupBy("age_segment", "preferred_taste").agg(count("*").alias("count")).orderBy("age_segment", desc("count"))
    exercise_taste_cross = df.groupBy("exercise_habits", "preferred_taste").agg(count("*").alias("count")).orderBy("exercise_habits", desc("count"))
    sleep_taste_cross = df.groupBy("sleep_cycle", "preferred_taste").agg(count("*").alias("count")).orderBy("sleep_cycle", desc("count"))
    taste_avg_age = df.groupBy("preferred_taste").agg(avg(col("age").cast(IntegerType())).alias("avg_age")).orderBy(desc("avg_age"))
    age_taste_matrix = {}
    for row in age_taste_cross.collect():
        segment = row["age_segment"]
        taste = row["preferred_taste"]
        count = row["count"]
        if segment not in age_taste_matrix:
            age_taste_matrix[segment] = {}
        age_taste_matrix[segment][taste] = count
    exercise_taste_matrix = {}
    for row in exercise_taste_cross.collect():
        exercise = row["exercise_habits"]
        taste = row["preferred_taste"]
        count = row["count"]
        if exercise not in exercise_taste_matrix:
            exercise_taste_matrix[exercise] = {}
        exercise_taste_matrix[exercise][taste] = count
    sleep_taste_matrix = {}
    for row in sleep_taste_cross.collect():
        sleep = row["sleep_cycle"]
        taste = row["preferred_taste"]
        count = row["count"]
        if sleep not in sleep_taste_matrix:
            sleep_taste_matrix[sleep] = {}
        sleep_taste_matrix[sleep][taste] = count
    taste_age_stats = [{"taste": row["preferred_taste"], "avg_age": float(row["avg_age"])} for row in taste_avg_age.collect()]
    correlation_result = {"age_taste_matrix": age_taste_matrix, "exercise_taste_matrix": exercise_taste_matrix, "sleep_taste_matrix": sleep_taste_matrix, "taste_avg_age": taste_age_stats}
    return correlation_result

def climate_culture_influence_analysis(spark, hdfs_path):
    df = spark.read.option("header", "true").csv(hdfs_path)
    climate_taste_cross = df.groupBy("climate_zone", "preferred_taste").agg(count("*").alias("count")).orderBy("climate_zone", desc("count"))
    cuisine_taste_cross = df.groupBy("historical_cuisine_exposure", "preferred_taste").agg(count("*").alias("count")).orderBy("historical_cuisine_exposure", desc("count"))
    climate_cuisine_cross = df.groupBy("climate_zone", "historical_cuisine_exposure").agg(count("*").alias("count")).orderBy("climate_zone", desc("count"))
    climate_taste_diversity = df.groupBy("climate_zone").agg(count("preferred_taste").alias("total_preferences"), countDistinct("preferred_taste").alias("unique_tastes")).withColumn("diversity_ratio", (col("unique_tastes") / col("total_preferences")).cast("decimal(4,3)")).orderBy(desc("diversity_ratio"))
    climate_taste_matrix = {}
    for row in climate_taste_cross.collect():
        climate = row["climate_zone"]
        taste = row["preferred_taste"]
        count = row["count"]
        if climate not in climate_taste_matrix:
            climate_taste_matrix[climate] = {}
        climate_taste_matrix[climate][taste] = count
    cuisine_taste_matrix = {}
    for row in cuisine_taste_cross.collect():
        cuisine = row["historical_cuisine_exposure"]
        taste = row["preferred_taste"]
        count = row["count"]
        if cuisine not in cuisine_taste_matrix:
            cuisine_taste_matrix[cuisine] = {}
        cuisine_taste_matrix[cuisine][taste] = count
    climate_cuisine_matrix = {}
    for row in climate_cuisine_cross.collect():
        climate = row["climate_zone"]
        cuisine = row["historical_cuisine_exposure"]
        count = row["count"]
        if climate not in climate_cuisine_matrix:
            climate_cuisine_matrix[climate] = {}
        climate_cuisine_matrix[climate][cuisine] = count
    diversity_stats = [{"climate": row["climate_zone"], "total_preferences": row["total_preferences"], "unique_tastes": row["unique_tastes"], "diversity_ratio": float(row["diversity_ratio"])} for row in climate_taste_diversity.collect()]
    influence_result = {"climate_taste_matrix": climate_taste_matrix, "cuisine_taste_matrix": cuisine_taste_matrix, "climate_cuisine_matrix": climate_cuisine_matrix, "taste_diversity": diversity_stats}
    return influence_result
基于大数据的食物口味差异数据分析与可视化系统-结语
👇🏻 精彩专栏推荐订阅 👇🏻 不然下次找不到哟~
Java实战项目
Python实战项目
微信小程序|安卓实战项目
大数据实战项目
PHP|C#.NET|Golang实战项目🍅 主页获取源码联系🍅