Title
题目
An interactive and explainable AI approach to improve human-machineteaming in cancer subtyping from digital cytopathology
一种交互式可解释人工智能方法,用于改进数字细胞病理学癌症亚型分类中的人机协作
01
文献速递介绍
癌症亚型分类正逐渐成为精准医疗的一种重要方法,可用于筛选最能从特定疗法中获益的患者,以及设计新型靶向药物。为实现亚型分类,首先通过细针穿刺活检提取癌细胞,随后进行进一步分析------要么对数字全切片图像(WSIs)进行视觉分析,要么直接通过基因表达谱(GEP)等基因分析手段。GEP能提供一致性结果,但通常成本高昂、周转时间长,目前尚未广泛应用于患者。依靠病理医生对WSIs进行视觉分析的可及性显著更高,因为这是当前临床常规流程的一部分,但该方式也面临诸多挑战。WSIs中包含丰富且复杂的视觉信息,使得癌症亚型分类难以标准化,且严重依赖临床医生的个人专业经验(Breugom等人,2016;Dotan和Cohen,2011)。由于WSIs达到十亿像素级大小,基于WSIs的癌症亚型分类也是一项耗时的任务(Brancati等人,2022)。部分基于WSIs的癌症亚型分类任务甚至超出了训练有素的病理医生的能力范围,因为尚未明确WSIs形态与亚型之间的稳健特征。为应对这些挑战并推动医学图像分析的发展,本文重点研究两种基于细胞病理学图像WSIs的临床高需求癌症亚型分类任务:葡萄膜黑色素瘤(UM)和宫颈癌(CC)。UM是成人最常见的原发性眼内恶性肿瘤(Singh等人,2011),通过GEP可分为两种亚型,其92个月生存率差异显著:1类患者为95%,2类患者仅为31%(Onken等人,2004)。尽管GEP无法全面揭示UM亚型背后的临床推理逻辑,但它仍是预测患者生存率和转移性疾病发生风险的最稳健指标。目前尚未建立稳健的手工设计特征,例如Callender UM分类系统的可重复性较差,美国武装部队病理研究所内部的分歧率为12%,而世界卫生组织的分歧率高达60%(Gamel等人,1978)。因此,开发基于细胞病理学图像的UM癌症亚型分类方法至关重要,可为临床诊断和生存预后提供有价值的参考。我们还研究了CC的癌症亚型分类,CC是女性中第二常见的恶性肿瘤(Guo等人,2022;Bedell等人,2020)。虽然宫颈癌筛查依赖经济高效且可重复的巴氏涂片检查(Pap试验),但该检查结果需要手动分析每个样本中的数十万个细胞,导致假阴性率差异较大,介于2%至62%之间(Rezende等人,2021)。自动化的CC癌症亚型分类方法可提供客观诊断,减少手动检查带来的变异性。 随着计算机辅助诊断(CAD)的发展,深度学习有助于解决上述挑战。在大多数临床任务中,基于深度学习的WSIs分析比临床专家更快(Shafi和Parwani,2023;Chen等人,2019、2020c、2022b)、成本更低,并且能够通过学习任务特定的显著特征和具有判别力的形态模式,以标准化、客观的方式从WSIs中预测癌症亚型(Cifci等人,2023)。然而,传统深度学习算法通常被视为"黑箱"(Krizhevsky等人,2012;He等人,2016;Ren等人,2015;Rudin,2018;Chen等人,2022a),因为它们除了提供最终的亚型建议外,无法给出任何额外的解释信息。鉴于癌症亚型分类的关键性,人们迫切需要决策支持系统不仅能提供建议,还能提供支持性信息,以增强人类的解读能力和协作效果(Chen等人,2022a)。缺乏解释或正当理由等支持性信息,可能导致在"黑箱"系统的人机协作中出现自动化偏见或不当信任(Nourani等人,2020;Gaube等人,2021)。因此,需要设计更具可解释性的算法,理想情况下应具备交互机制,使病理医生能够独立有效地探索图像内容,从而获得人工智能(AI)建议的透明推理过程(Tonekaboni等人,2019)。现有癌症亚型分类交互工具的重点在于为病理医生提供探索模式的机制,以加快导航速度并减少审核时间(Cai等人,2019;Lindvall等人,2021;Antoniadi等人,2021;Gu等人,2023a),而我们的目标则更进一步------开发一种自动化、可解释且具备交互功能的算法,作为"第二阅片者"协助癌症亚型分类过程。最先进的AI可解释性技术已在数字病理学领域得到探索(Evans等人,2022),但这些技术最初是为通用计算机视觉开发的,导致医疗领域用户难以理解其过程,可能无法满足临床需求(Chen等人,2022a)。 为设计符合临床需求的可解释模型,我们通过探索性用户研究全面了解病理医生如何开展癌症预后相关任务。访谈结果显示,病理医生在各类癌症亚型分类任务中对核心技术和分析理念达成共识:1)癌细胞的视觉模式包含足够的癌症亚型分类信息;2)单个癌细胞的特征与患者的癌症亚型无直接关联,而WSI中不同细胞类型的整体统计特征、呈现形式及其形态外观,才是基于细胞病理学图像进行癌症亚型分类的最具临床重要性、显著性和信息量的特征。基于第一个发现,我们聚焦于基于细胞的分析,而非当前深度学习WSIs分析中主流的基于图像块的方法------这类方法通常将所有图像块同等对待(Liu等人,2017;Hou等人,2016;Xu等人,2017;Zhang等人,2020;Chikontwe等人,2020;Campanella等人,2019),忽略了图像质量的差异,且会纳入血细胞和伪影等无关物体的冗余信息(Liu等人,2020;Chen等人,2020a)。实现第二个发现则难度更大,因为卷积深度学习技术基于核的特征提取方式(He等人,2016;Krizhevsky等人,2017;Chen等人,2020b、c)侧重于图像内容的局部规律性(Banerji和Mitra,2022;Tsaku等人,2019),难以捕捉癌细胞的整体统计特征。相比之下,我们通过对细胞特征进行无监督聚类和可解释分布分析,直接对细胞构成进行全局分析,更贴合病理医生的诊断方法。具体而言:首先,利用实例级分割网络分割并提取单个癌细胞的视觉形态特征;其次,根据这些特征对所有细胞进行聚类,并将维度降至二维圆形流形,以便简化可视化和分析过程------该流形嵌入捕捉了细胞形态构成的表征,保留了细胞类型及其在WSI中出现频率的关键统计信息;最后,利用基于可解释规则集的符号推理(源于嵌入的细胞形态构成)提供癌症亚型建议。 除了验证技术可行性外,我们还通过病理医生参与的用户研究,验证了基于专家实践和知识的深度学习方法,并证明其能够解释癌症亚型建议。为整合所提方法的辅助功能,我们利用该方法在二维空间中进行细胞构成分析的能力,开发了交互式图像检查工具,并展示了基于细胞构成的简单决策规则。在葡萄膜黑色素瘤癌症亚型分类任务中,我们采用被试内设计,比较了三种辅助水平:无算法支持的基线组、"黑箱"模型辅助组和所提方法辅助组。我们的方法允许病理医生交互式验证结果,这增强了他们的诊断能力,为改进医学图像分析中的人机协作奠定了基础。与传统"黑箱"算法相比,我们的方法在不牺牲性能的前提下提供了有价值的解释信息,是迈向更具可解释性和协作性的医学图像分析的关键一步。该方法在葡萄膜黑色素瘤和宫颈癌亚型分类任务中分别达到87.5%和93.1%的准确率,优于包括深度"黑箱"模型在内的所有对比方法,为医学诊断中可解释计算机视觉的发展指明了良好方向。据我们所知,本文首次将深度学习与细胞构成分析相结合用于癌症亚型分类,复刻了病理医生采用的数字细胞病理学检查流程。参与用户研究的病理医生对所提可解释算法给予了积极评价,认可其临床可接受的高准确率以及清晰可靠的解释。值得注意的是,该系统与标准诊断流程的一致性被视为一项重要优势,这表明它有望无缝融入临床实践。此外,所提方法具有通用性,可适用于任何需要综合考虑多个实例以提供建议的问题(不限于医疗领域),例如基于卫星图像的道路交通信号灯优化,甚至非图像相关问题(如社会行为研究)。
Aastract
摘要
Algorithmic decision support is rapidly becoming a staple of personalized medicine, particularly for high-stakesrecommendations such as cancer subtyping in which access to patient-specific information can drastically alterthe course of treatment, and thus, patient outcome. To enhance the utility of decision support systems, it is vital toprovide not just recommendations, but also contextual information that aids human understanding and improvescollaboration between humans and machines. This paper introduces an automated, explainable system designedto assist pathologists with cancer subtyping from digital cytopathology images, incorporating interactive contentinspection for quick assessment of cell composition. Adhering to human-centered design principles, our approachdraws from a formative study to mirror pathologists' examination processes in the algorithm's design. Our deeplearning-based method first analyzes every cell in the cytopathology slide to extract and cluster their appearance,and then uses an interpretable rule set to determine cancer subtypes based on overall cell composition clusters.This method enables verification of cell composition through interactive inspection and offers transparent decision rules, enhancing human-machine collaboration without sacrificing performance compared to traditional"black box" models. The proposed method achieves an accuracy of 87.5 % and 93.1 % for Uveal Melanoma andCervical Cancer subtyping, respectively, which compares favorably to all competing approaches, including deep"black box" models. Summarizing a user study with pathologists, participants expressed positive feedback aboutthe proposed explainable cancer subtyping pipeline due to its clinically-acceptable high accuracy and supportfor understandable and reliable explanations. Most importantly, the system's adherence to standard diagnosticprocedures was perceived as a strength as it may facilitate integration into clinical practice.
算法决策支持正迅速成为精准医疗的重要组成部分,尤其适用于癌症亚型分类等高危建议场景------在这类场景中,获取患者特异性信息能显著改变治疗进程,进而影响患者预后。为提升决策支持系统的实用性,关键不仅在于提供建议,还需提供上下文信息以辅助人类理解,改善人机协作效果。本文提出一种自动化、可解释的系统,旨在协助病理医生基于数字细胞病理学图像进行癌症亚型分类,整合交互式内容查看功能以快速评估细胞构成。该方法遵循以人为中心的设计原则,基于一项探索性研究,在算法设计中复刻病理医生的检查流程。我们提出的深度学习方法首先分析细胞病理学切片中的每个细胞,提取并聚类其形态特征,随后利用可解释规则集基于整体细胞构成聚类结果判定癌症亚型。该方法支持通过交互式查看验证细胞构成,并提供透明的决策规则,在不牺牲性能的前提下增强人机协作,性能优于传统"黑箱"模型。所提方法在葡萄膜黑色素瘤和宫颈癌亚型分类任务中分别达到87.5%和93.1%的准确率,优于包括深度"黑箱"模型在内的所有对比方法。病理医生参与的用户研究结果显示,参与者对该可解释癌症亚型分类流程给予积极反馈,认可其临床可接受的高准确率,以及对易懂且可靠解释的支持。最重要的是,该系统符合标准诊断流程的特性被视为核心优势,这一特性或有助于其融入临床实践。
Method
方法
Given WSIs, we aim to establish an explainable pipeline to assistpathologists in cancer subtyping with cytopathology images. We firstperform formative user research to understand the requirements andneeds of pathologists for cancer subtyping using WSIs, which is described in Section 2.1. With the formative user research, we find thatpathologists perform a cancer subtyping assessment with WSIs based onthe statistics of different cell types and appearances. Thus, we designthe explainable algorithm based on the distribution of cell appearancesin Section 2.2. In order to analyze cell appearance composition, we firstsegment cells and extract deep features per cell. Cell-level features areclustered in a 2D manifold as embedded cell appearance distribution ofthe corresponding WSI. The embedded cell appearance distribution isfurther analyzed by rule set-based symbolic reasoning to predict cancersubtypes for each WSI. We finally conduct a user study with pathologists to assess whether the proposed algorithm is indeed explainable topathologists, which is described in Section 2.3. Human factors such asconfidence, willingness, acceptance, and reliability are also analyzed inthe user study.
给定数字全切片图像(WSIs),我们旨在建立一套可解释的流程,以协助病理医生基于细胞病理学图像进行癌症亚型分类。首先,我们开展探索性用户研究,了解病理医生利用WSIs进行癌症亚型分类的需求与要求(详见2.1节)。通过该探索性用户研究,我们发现病理医生是基于不同细胞类型及形态的统计特征,对WSIs进行癌症亚型评估。因此,我们在2.2节中基于细胞形态分布设计了可解释算法。为分析细胞形态构成,我们首先对细胞进行分割并提取单个细胞的深度特征;随后将细胞级特征聚类到二维流形中,形成对应WSI的嵌入细胞形态分布;进一步通过基于规则集的符号推理分析该嵌入细胞形态分布,以预测每张WSI的癌症亚型。最后,我们开展了病理医生参与的用户研究,评估所提算法对病理医生而言是否具备真正的可解释性(详见2.3节),并在该用户研究中分析了置信度、使用意愿、接受度和可靠性等人因因素。
Conclusion
结论
We introduced an automatic and explainable algorithm for cancersubtyping from cytopathology images, relying on cell composition analysis. The pipeline's design was guided by formative user research withpathologists, aiming to understand their needs and knowledge for implementing an explainable model. The algorithm outperforms patch-based"black box" models on two cancer subtyping tasks: Uveal Melanomaand Cervical Cancer prognostication. Through a user study with pathologists, our proposed approach demonstrates enhanced confidence, willingness, reliability, and diagnostic speed in the UM subtyping task. Ourwork highlights the importance of user-oriented designs as a complementary design dimension to improve and capitalize on the benefits ofAI-assisted decision making in cancer subtyping from digital cytopathology.
我们提出了一种基于细胞构成分析的自动化可解释算法,用于细胞病理学图像的癌症亚型分类。该流程的设计以病理医生参与的探索性用户研究为指导,旨在理解他们对可解释模型落地的需求与专业认知。该算法在两项癌症亚型分类任务(葡萄膜黑色素瘤和宫颈癌预后)中,性能优于基于图像块的"黑箱"模型。通过病理医生参与的用户研究表明,所提方法在葡萄膜黑色素瘤亚型分类任务中,显著提升了病理医生的诊断置信度、使用意愿、结果可靠性及诊断速度。本研究强调,以用户为中心的设计作为一项补充设计维度,对于改进并充分发挥数字细胞病理学癌症亚型分类中人工智能辅助决策的优势具有重要意义。
Figure
图
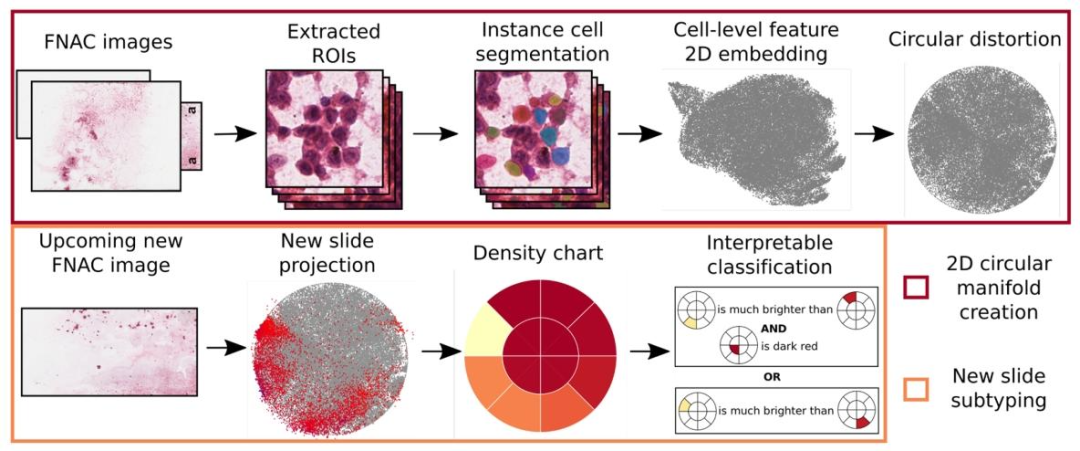
Fig. 1. System overview of the proposed method. Cell-level features are obtained by aggregation over instance cell segmentation masks and then embedded intoa 2D space. Several slides are embedded in this way to create a representative cell appearance space, and the 2D embedding space is subsequently distorted into acircle. For every other cytopathology image, cell representations are extracted and projected with the same embedding process into the circular space (red pointsin the second image of the second column), such that one density chart is generated for every slide. Finally, we find an explainable rule set to classify UM biopsiesbased on the density charts.
图 1 所提方法的系统概览。通过对实例细胞分割掩码进行聚合得到细胞级特征,随后将其嵌入二维空间。以该方式嵌入多张切片,构建具有代表性的细胞形态空间,并将此二维嵌入空间进一步变形为圆形。对于其他每张细胞病理学图像,提取细胞表征并通过相同的嵌入流程投影至该圆形空间(第二列第二张图中的红点),从而为每张切片生成一张密度图。最后,基于密度图构建可解释规则集,用于葡萄膜黑色素瘤(UM)活检样本的分类。
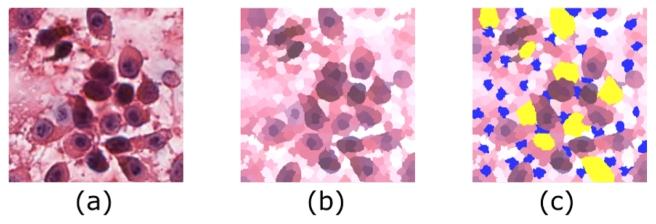
Fig. 2. The ROI annotation procedure. (a) the extracted high-quality ROI; (b)the generated super-pixels.; (c) the annotations on super-pixels. Yellow and blueregions are annotated super-pixels for cancer cells nd background, respectively
图 2 感兴趣区域(ROI)标注流程。(a) 提取的高质量感兴趣区域;(b) 生成的超像素;(c) 超像素上的标注结果。黄色和蓝色区域分别为癌细胞和背景的标注超像素。
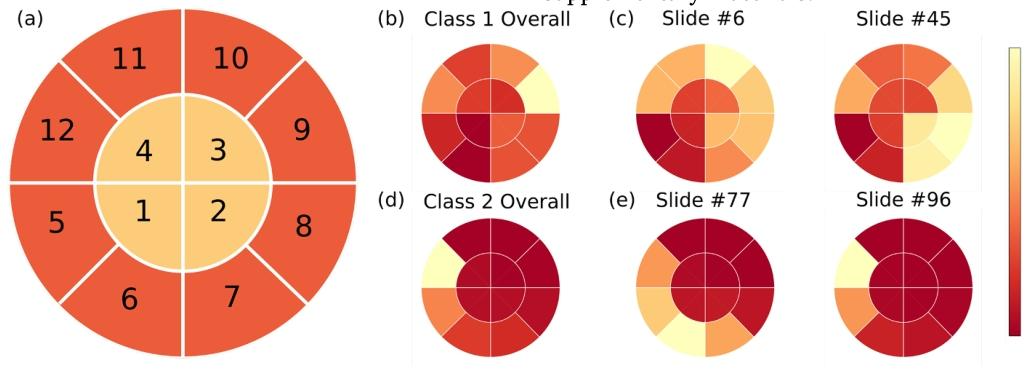
Fig. 3. (a) The definition of spatial partitioning and density charts in the distorted 2D embedding space. (b) The density chart of all cells in GEP class 1; (c) Twodensity chart examples of GEP class 1 slides; (d) The density chart of all cells in GEP class 2; (e) Two density chart examples of GEP class 2 slides.
图 3 (a) 变形后二维嵌入空间中的空间划分及密度图定义;(b) 基因表达谱(GEP)1类所有细胞的密度图;(c) 两张GEP 1类切片的密度图示例;(d) GEP 2类所有细胞的密度图;(e) 两张GEP 2类切片的密度图示例。
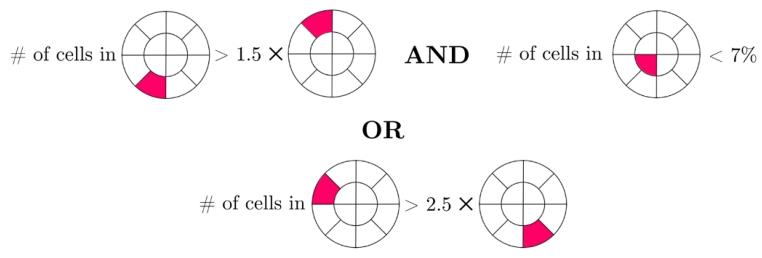
Fig. 4. Trained rule set for UM dataset.
图 4 葡萄膜黑色素瘤(UM)数据集的训练后规则集。
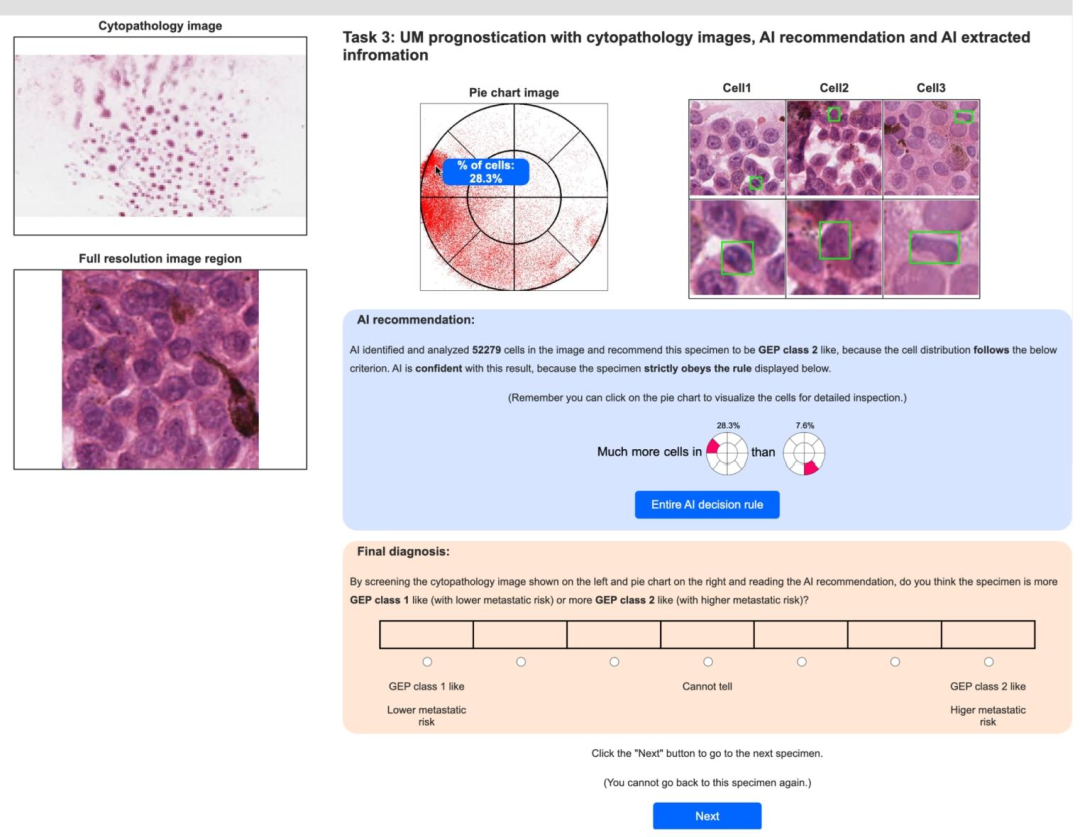
Fig. 5. User interface with explanations of cancer subtype predictions. Users need to predict cancer subtyping with the assistance of AI predictions based on cellappearance composition. Cell composition is visualized in a pie chart. Users can click any area in the pie chart to inspect the corresponding cell appearance. The AIprediction is shown with the evidence from the rule set criterion.
图 5 含癌症亚型预测解释的用户界面。用户需在基于细胞形态构成的人工智能(AI)预测辅助下完成癌症亚型分类。细胞构成通过饼图可视化呈现,用户可点击饼图任意区域查看对应细胞形态。界面同时展示AI预测结果及基于规则集标准的支撑依据。
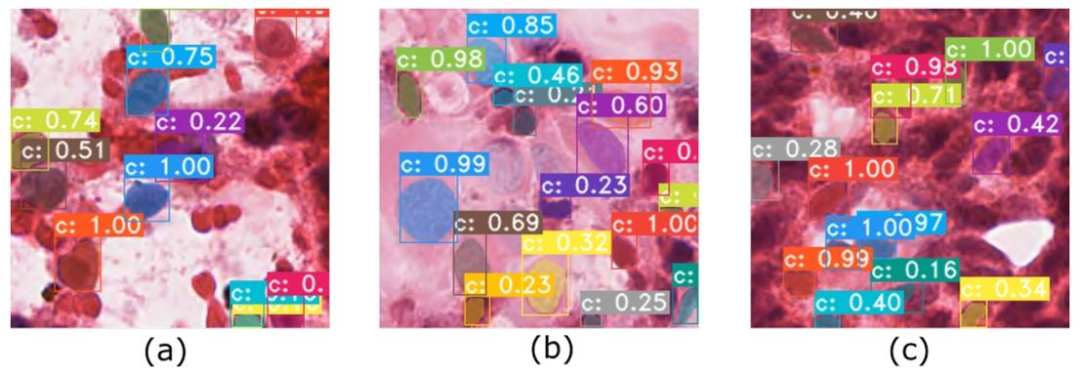
Fig. 6. Examples of segmentation results. The segmentation network is able to (a) separate cancer cells (purple, large) from blood cells (red, small); (b) segmentcells with all sizes, but (c) miss some ambiguous cells. The numbers within the boxes correspond to confidence scores
图 6 分割结果示例。分割网络能够:(a) 将癌细胞(紫色,较大)与血细胞(红色,较小)区分开;(b) 分割不同大小的细胞,但 (c) 会遗漏部分模糊细胞。框内数字为置信度分数。
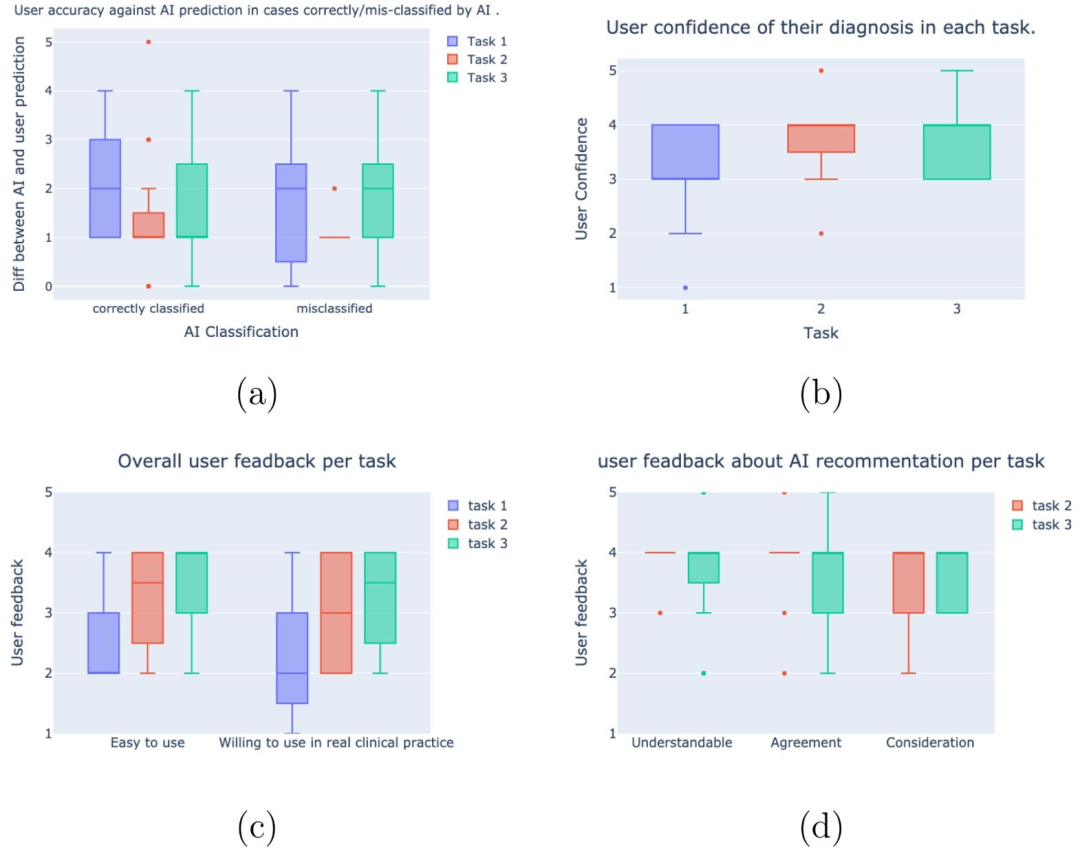
Fig. 7. Box plots of human behavior metrics analyzed in the user study. (a) Pathologists' accuracy and confidence in predicting GEP classes. (b) Pathologists' overallconfidence of each task. (c) Pathologists' feedback about "whether the interface is easy to use?" and "Whether they are willing to use the interface in real clinicalpractice?". (d) Pathologists' feedback on AI recommendations, which includes "Whether the AI recommendation is understandable?"; "Whether pathologists agreewith AI recommendation?"; and "Whether pathologists consider AI recommendation in final diagnosis?".
图 7 用户研究中分析的人类行为指标箱线图。(a) 病理医生预测基因表达谱(GEP)类别的准确率与置信度;(b) 病理医生在每项任务中的整体置信度;(c) 病理医生对"界面是否易于使用?"及"是否愿意在实际临床实践中使用该界面?"的反馈;(d) 病理医生对人工智能(AI)建议的反馈,包括"AI建议是否易于理解?""病理医生是否认同AI建议?"以及"病理医生在最终诊断中是否会参考AI建议?"。
Table
表
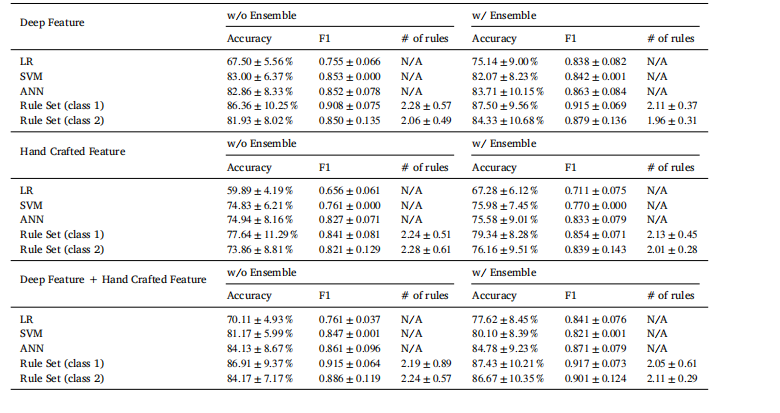
Table 1Ablation study of explainable classification with different methods and an ensemble technique for UM dataset. LR refers to logisticregression. Rule Set (class 𝑘, 𝑘 = 1, 2) refers to results using the embedding created from class 𝑘 slides. "Deep Feature" refers tousing UMAP projection created by cell-level deep features; "Hand Crafted Feature" refers to using UMAP projection created byhand-crafted features; "Deep Feature + Hand Crafted Feature" refers to using UMAP projection created by the concatenation ofcell-level deep features and hand-crafted features.
表 1 葡萄膜黑色素瘤(UM)数据集上不同方法及集成技术的可解释分类消融实验。LR 指逻辑回归;规则集(类别(k),(k=1,2))表示使用基于类别(k)切片生成的嵌入得到的结果;"深度特征"指使用由细胞级深度特征生成的 UMAP 投影;"手工设计特征"指使用由手工设计特征生成的 UMAP 投影;"深度特征+手工设计特征"指使用由细胞级深度特征与手工设计特征拼接后生成的 UMAP 投影。
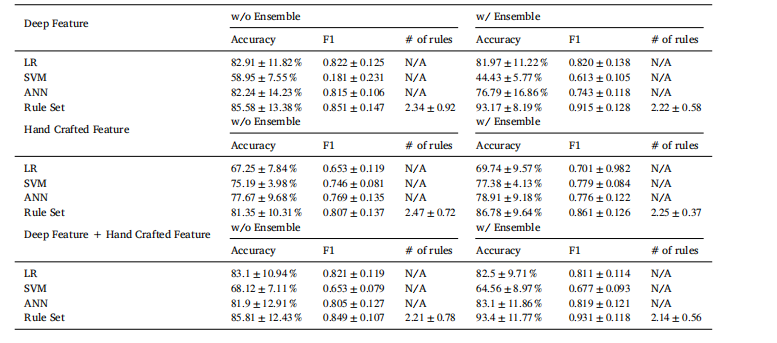
Table 2Ablation study of explainable classification with different methods and an ensemble technique for Cervical dataset
表 2 宫颈癌数据集上不同方法及集成技术的可解释分类消融实验
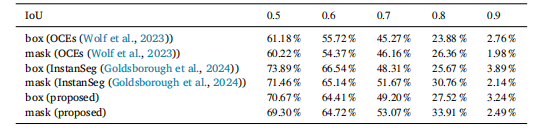
Table 3mAP for segmentation boxes and masks with different IoU threshold for UM dataset.
表 3 葡萄膜黑色素瘤(UM)数据集上不同交并比(IoU)阈值下分割框与分割掩码的平均精度(mAP)