前言
Elasticsearch (ES) 作为当今最流行的分布式搜索引擎,已经成为企业级应用中处理海量数据检索、日志分析、实时监控的核心组件。从简单的全文检索到复杂的地理位置搜索,从TB级日志分析到毫秒级实时查询,ES凭借其强大的分布式架构和丰富的查询能力,在各种场景中发挥着不可替代的作用。
本文将深入剖析Elasticsearch的核心技术,从倒排索引到分布式架构,从写入流程到查询原理,从理论基础到生产实践,帮助读者建立对ES的系统性认知。无论你是初学者还是有经验的开发者,都能从中获得新的启发。
第一章:Elasticsearch核心原理与架构
1.1 什么是Elasticsearch?
Elasticsearch是一个基于Apache Lucene的分布式搜索和分析引擎,它具备以下核心特性:
核心特性:
- 分布式架构:天然支持横向扩展,可以轻松处理PB级数据
- 近实时搜索:数据写入后秒级可搜索(默认1秒refresh间隔)
- RESTful API:通过HTTP接口进行所有操作,简单易用
- Schema-Free:支持动态Mapping,可自动推断字段类型
- 多租户支持:一个集群可以托管多个索引
- 丰富的查询DSL:支持全文检索、精确匹配、范围查询、聚合统计等
技术栈定位:
存储层 Lucene核心层 Elasticsearch层 应用层 磁盘存储 文件系统缓存 倒排索引 搜索引擎 分词器 RESTful API Query DSL Aggregation Java应用 Python应用 Web应用
1.2 核心概念解析
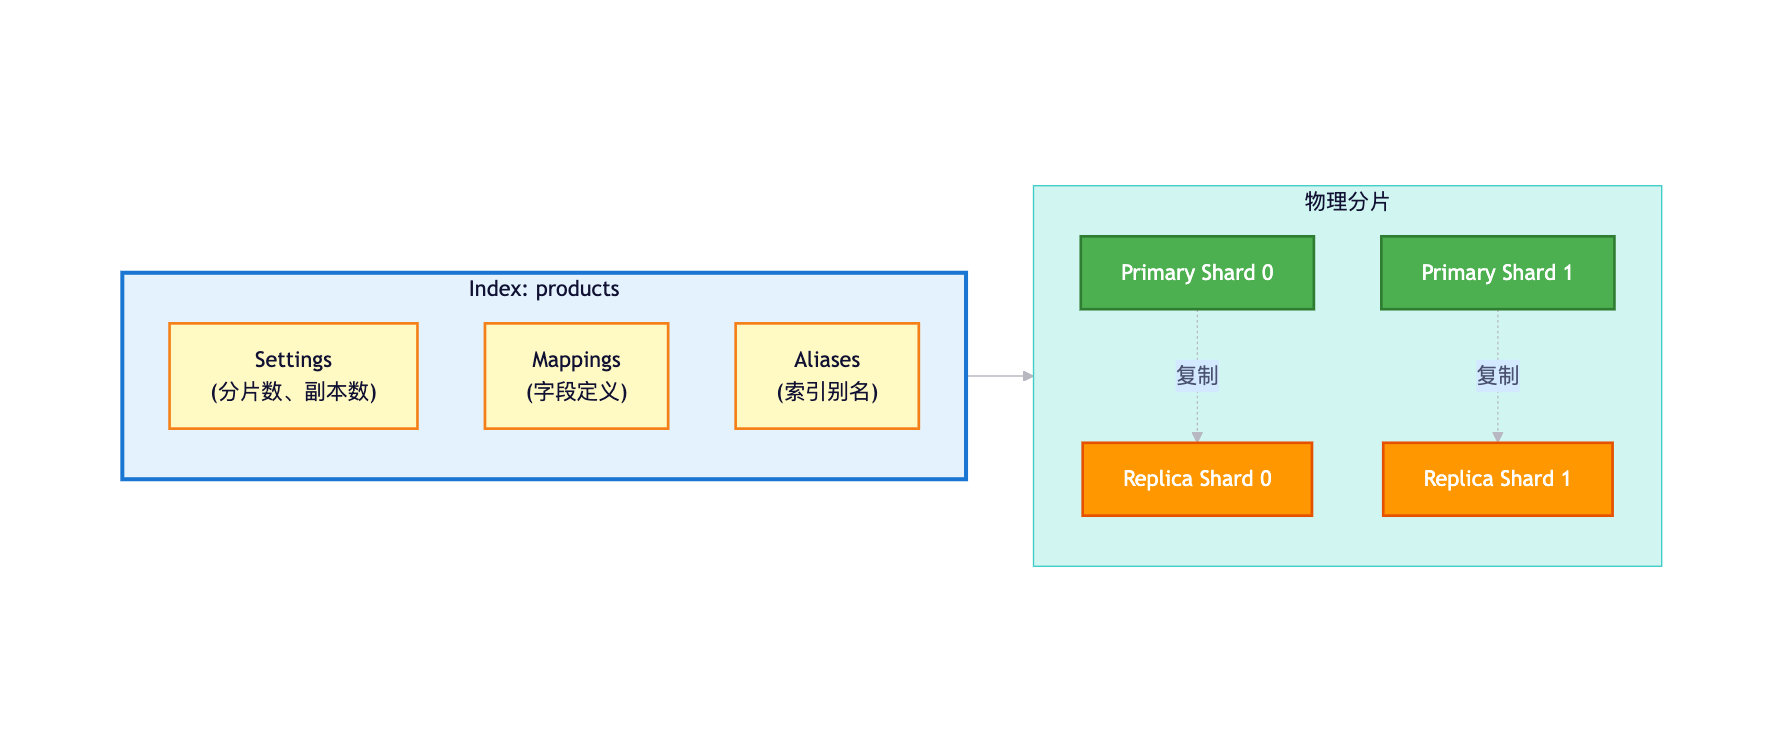
1.2.1 索引(Index)
定义:索引是ES中的逻辑数据容器,类似于关系型数据库中的"数据库"或"表"。
索引结构:
索引设置示例:
json
PUT /products
{
  "settings": {
    "number_of_shards": 3,      // 主分片数(创建后不可改)
    "number_of_replicas": 1,    // 副本数(可动态调整)
    "refresh_interval": "1s",   // 刷新间隔
    "analysis": {               // 分词器配置
      "analyzer": {
        "ik_smart_analyzer": {
          "type": "custom",
          "tokenizer": "ik_smart"
        }
      }
    }
  },
  "mappings": {
    "properties": {
      "name": {
        "type": "text",
        "analyzer": "ik_smart_analyzer"
      },
      "price": {
        "type": "double"
      },
      "status": {
        "type": "keyword"
      }
    }
  }
}
1.2.2 文档(Document)
定义:文档是ES中的基本数据单元,使用JSON格式表示,类似于关系型数据库中的"行"。
文档结构:
json
{
  "_index": "products",           // 所属索引
  "_id": "1",                     // 文档唯一ID
  "_version": 1,                  // 版本号(乐观锁)
  "_score": 1.0,                  // 相关性分数
  "_source": {                    // 原始文档内容
    "name": "iPhone 15 Pro",
    "price": 7999.00,
    "brand": "Apple",
    "status": "available",
    "tags": ["5G", "A17", "钛金属"],
    "created_at": "2024-09-15T10:00:00Z"
  }
}文档元数据:
| 元数据 | 说明 |
|---|---|
_index |
文档所属的索引名称 |
_id |
文档的唯一标识符,可自定义或自动生成 |
_version |
文档的版本号,每次更新递增(用于乐观锁) |
_score |
查询时计算的相关性分数 |
_source |
原始JSON文档内容 |
_routing |
路由值,决定文档分配到哪个分片 |
1.2.3 分片(Shard)
定义:分片是索引的物理拆分单元,用于实现数据的水平扩展和分布式存储。
分片类型:
-
主分片(Primary Shard):
- 负责处理写请求
- 数量在索引创建时确定,创建后不可更改
- 每个文档只会存在于一个主分片
-
副本分片(Replica Shard):
- 主分片的完整拷贝
- 提供数据冗余和高可用
- 可以处理读请求,分担查询压力
- 数量可以动态调整
分片分布示例:
ES Cluster (3 Nodes) Node 1 Node 2 Node 3 路由 路由 路由 复制 复制 复制 P2
(主分片2) R0
(副本分片0) P1
(主分片1) R2
(副本分片2) P0
(主分片0) R1
(副本分片1) 文档1
hash(id)%3=0 文档2
hash(id)%3=1 文档3
hash(id)%3=2
分片路由算法:
shard_num = hash(_routing) % num_primary_shards

其中:
- _routing 默认为文档的 _id
- num_primary_shards 为主分片数量
- 这就是为什么主分片数量创建后不能改变的原因分片数量规划:
推荐策略:
1. 单个分片大小建议:20GB - 50GB
2. 分片数量 = 数据总量 / 单分片大小
3. 考虑未来增长,预留20%扩展空间

示例:
预计数据量:300GB
单分片大小:30GB
分片数量:300GB / 30GB = 10个主分片
考虑扩展:10 * 1.2 = 12个主分片(推荐)
1.3 集群架构
1.3.1 节点类型
ES集群由多个节点组成,每个节点可以承担不同的角色:
节点角色对比:
| 角色 | 配置 | 职责 | 使用场景 |
|---|---|---|---|
| Master Node | node.master: true node.data: false |
集群管理、索引创建/删除、节点加入/移除 | 专用主节点,提升集群稳定性 |
| Data Node | node.master: false node.data: true |
存储数据、执行CRUD、搜索、聚合 | 数据密集型操作 |
| Coordinating Node | node.master: false node.data: false |
路由请求、分发查询、合并结果 | 负载均衡、请求路由 |
| Ingest Node | node.ingest: true |
数据预处理、文档转换 | 数据摄取管道 |
集群架构示例:
Data层 Master层 (3节点) 负载均衡层 客户端层 集群管理 集群管理 集群管理 集群管理 选举 选举 选举 Data Node 1 Data Node 2 Data Node 3 Data Node 4 Master Node 1
(elected) Master Node 2 Master Node 3 Coordinating Node 1 Coordinating Node 2 Java Client Logstash Kibana
1.3.2 集群状态
集群健康状态:
GET /_cluster/health

响应:
{
  "cluster_name": "es-cluster",
  "status": "green",              // green/yellow/red
  "timed_out": false,
  "number_of_nodes": 7,           // 节点总数
  "number_of_data_nodes": 4,      // 数据节点数
  "active_primary_shards": 30,    // 活跃主分片数
  "active_shards": 60,            // 活跃分片总数(主+副本)
  "relocating_shards": 0,         // 正在迁移的分片
  "initializing_shards": 0,       // 正在初始化的分片
  "unassigned_shards": 0          // 未分配的分片
}状态含义:
🟢 Green
所有主分片和副本分片都已分配 🟡 Yellow
所有主分片已分配
但部分副本分片未分配 🔴 Red
部分主分片未分配
数据不完整
状态影响:
| 状态 | 数据完整性 | 可用性 | 性能 | 处理建议 |
|---|---|---|---|---|
| Green | ✅ 完整 | ✅ 高可用 | ✅ 正常 | 无需处理 |
| Yellow | ✅ 完整 | ⚠️ 降级 | ⚠️ 降低 | 检查副本分片,增加节点 |
| Red | ❌ 不完整 | ❌ 部分不可用 | ❌ 严重降低 | 紧急处理,恢复主分片 |
1.4 为什么Elasticsearch这么快?
ES的高性能来自多方面的设计优化:
1.4.1 倒排索引
核心原理:传统的正排索引是"文档 → 词项",而倒排索引是"词项 → 文档列表"。
对比示例:
文档集合:
Doc1: "Elasticsearch is fast"
Doc2: "Elasticsearch is powerful"
Doc3: "Lucene is the core"

正排索引(传统):
Doc1 → ["Elasticsearch", "is", "fast"]
Doc2 → ["Elasticsearch", "is", "powerful"]
Doc3 → ["Lucene", "is", "the", "core"]

倒排索引(ES使用):
"elasticsearch" → [Doc1, Doc2]
"is"            → [Doc1, Doc2, Doc3]
"fast"          → [Doc1]
"powerful"      → [Doc2]
"lucene"        → [Doc3]
"core" → [Doc3]倒排索引结构:
Posting List
(倒排列表) Term Dictionary
(词项字典) Doc1, Doc2
positions: 0, 0 Doc1
positions: 2 Doc3
positions: 0 Doc2
positions: 2 elasticsearch fast lucene powerful
查询性能对比:
查询: "Elasticsearch"

传统数据库:
1. 全表扫描:遍历所有文档
2. 逐个匹配:在每个文档中查找关键词
3. 时间复杂度:O(N*M),N=文档数,M=文档长度

倒排索引:
1. 查词典:在Term Dictionary中查找"elasticsearch"
2. 获取文档列表:直接返回 [Doc1, Doc2]
3. 时间复杂度:O(logN + K),K=命中文档数

性能差距:
100万文档,平均1000字/文档
传统:需要扫描10亿个词
倒排:查1次词典 + 返回结果
速度提升:1000倍以上
1.4.2 分布式并行计算
查询执行流程:
Client Coordinating Node Shard 0 Shard 1 Shard 2 查询请求 解析查询DSL 查询 查询 查询 par 并行查询所有分片 本地搜索 本地搜索 本地搜索 par 各分片本地执行 Doc IDs + Scores Doc IDs + Scores Doc IDs + Scores par 返回初步结果 合并、排序、分页 Fetch Phase: 获取完整文档 文档内容 最终结果 Client Coordinating Node Shard 0 Shard 1 Shard 2
并行优势:
单分片查询:100ms
3个分片并行:100ms(理论上)
10个分片并行:100ms(理论上)

实际场景:
- 数据分散在3个分片
- 每个分片查询100ms
- 串行需要:300ms
- 并行只需:100ms + 网络开销(~10ms)
- 性能提升:约3倍
1.4.3 文件系统缓存
缓存机制:
磁盘层 内存层 缓存命中 磁盘I/O Segment Files
(倒排索引文件) JVM Heap
(存储元数据、缓存) File System Cache
(OS页缓存) 查询请求
缓存性能:
内存访问:~100纳秒
SSD访问:  ~100微秒(慢1000倍)
HDD访问:  ~10毫秒(慢10万倍)

ES的策略:
1. 热数据常驻文件系统缓存
2. Segment文件不可变,缓存友好
3. 查询优先从缓存读取
4. 缓存命中率通常>90%

性能提升:
缓存命中:0.1ms
缓存未命中:10ms(SSD)
命中率90%:平均响应 = 0.9*0.1 + 0.1*10 = 1.09ms
命中率99%:平均响应 = 0.99*0.1 + 0.01*10 = 0.199ms
1.4.4 Segment不可变性
Segment设计:
Shard (逻辑) 定期 定期 定期 Segment 1
(不可变) Segment 2
(不可变) Segment 3
(不可变) Segment 4
(新生成) 查询 后台合并
不可变性优势:
-
无需锁机制:
传统数据库: - 读写需要加锁 - 锁竞争降低并发 - 锁开销影响性能 ES Segment: - 写入后不再修改 - 读操作无需加锁 - 支持高并发查询 -
缓存友好:
- Segment不变,缓存永久有效 - 无需担心缓存失效 - 操作系统自动缓存热数据 -
压缩优化:
- 不可变文件可以高度压缩
- 减少磁盘空间占用
- 降低I/O开销
小结
Elasticsearch的高性能来自于:
- 倒排索引:O(logN)的查询复杂度
- 分布式架构:并行计算提升吞吐
- 文件系统缓存:热数据常驻内存
- Segment不可变:无锁并发访问
- 多副本分片:负载均衡分担压力
这些设计相互配合,构成了ES高性能搜索的技术基础。
第二章:倒排索引与存储机制
2.1 倒排索引深度解析
2.1.1 完整的倒排索引结构
一个完整的倒排索引包含以下组件:
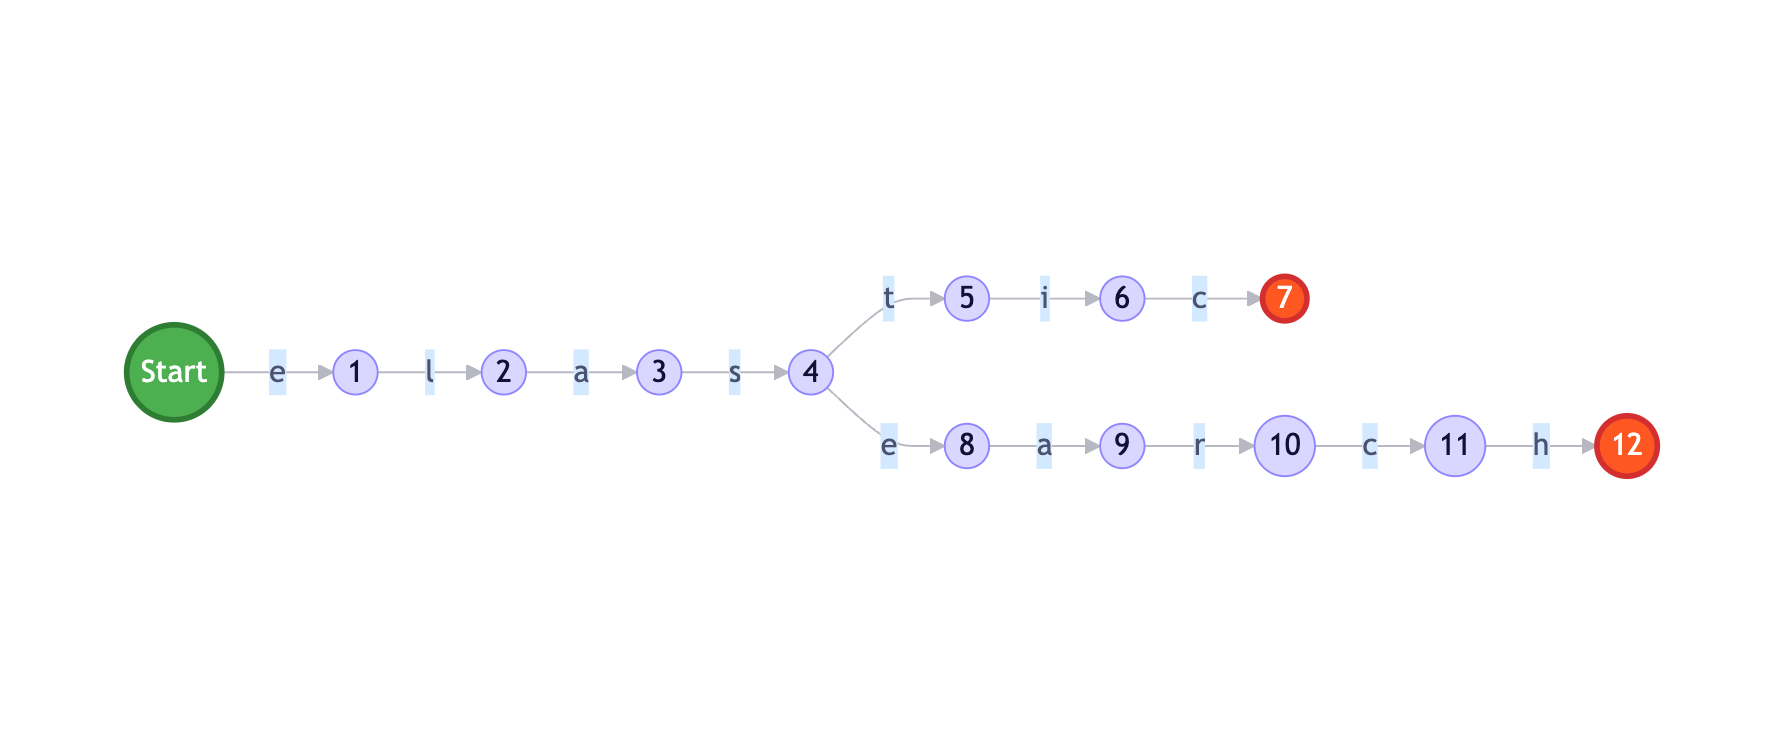
1. Term Dictionary(词项字典)
存储所有的词项(Term),支持快速查找。
通常使用FST(Finite State Transducer)数据结构实现。

示例:
"elastic" → Posting List Pointer
"search"  → Posting List Pointer
"engine"  → Posting List Pointer
2. Posting List(倒排列表)
记录包含该词项的文档ID列表及相关信息。

结构:
[
  {
    "doc_id": 1,
    "term_freq": 3,        // 词频(TF)
    "positions": [0, 5, 10], // 词项在文档中的位置
    "offsets": [0-7, 20-27, 50-57] // 字节偏移量
  },
  {
    "doc_id": 5,
    "term_freq": 1,
    "positions": [3],
    "offsets": [15-22]
  }
]
3. Term Vector(词项向量)
存储文档中所有词项的统计信息,用于计算相关性分数。

文档级别的词项信息:
- 词频(TF)
- 位置信息
- 偏移量完整结构可视化:
倒排索引 Posting Lists Document Store Term Vectors Term Dictionary
(FST结构) Doc 1
Term Vector Doc 2
Term Vector Doc 1
_source Doc 2
_source Doc 3
_source 'elasticsearch'
Posting List 'search'
Posting List 'engine'
Posting List
2.1.2 FST数据结构
FST(Finite State Transducer) 是ES用来存储Term Dictionary的核心数据结构。
FST优势:
1. 极致的内存效率:
   - 共享前缀/后缀
   - 1000万词项仅需100MB内存
   - 比HashMap节省80%以上

2. 快速查找:
   - O(k)时间复杂度,k为词项长度
   - 支持前缀查询
   - 支持模糊匹配

3. 有序性:
   - 词项按字典序存储
- 支持范围查询FST结构示例:
FST vs HashMap对比:
词项:["elastic", "elasticsearch", "engine"]

HashMap存储:
"elastic"        → Pointer1
"elasticsearch"  → Pointer2
"engine"         → Pointer3
内存:3 * (平均长度 + 指针) = 3 * (12 + 8) = 60字节

FST存储:
共享前缀"elast"、共享后缀
内存:约30字节(节省50%)

1000万词项:
HashMap:约200MB
FST:约100MB(节省50%)
2.1.3 Posting List压缩
ES对Posting List进行了高度压缩,以减少存储空间和提升I/O效率。
压缩技术:
1. Frame Of Reference编码
原始文档ID列表:[73, 300, 302, 332, 343, 372]

转换为增量:
[73, 227, 2, 30, 11, 29]

分组编码(每256个一组):
Frame 1: base=73, [0, 227, 2, 30, 11, 29]
使用最小位数编码:227需要8位,其他用8位统一编码

压缩率:
原始:6 * 32bit = 192bit
压缩后:32bit(base) + 6 * 8bit = 80bit
压缩率:58%
2. RoaringBitmap
当文档ID分布稀疏时,使用RoaringBitmap:

优势:
- 比传统BitSet节省空间
- 支持快速的位运算(AND/OR/XOR)
- 动态选择存储方式(数组/位图/Run-Length)

示例:
文档ID: [1, 3, 5, 7, 100, 200, 300, ...]
传统BitSet: 需要300位(38字节)
RoaringBitmap: 约10字节(节省75%)
2.2 存储机制
2.2.1 Segment文件结构
每个Segment包含多个文件,各司其职:
Segment文件组成:
_0.cfs    - Compound File(复合文件,包含以下所有文件)
_0.cfe    - Compound File Entries(复合文件条目索引)

展开后的文件:
_0.si     - Segment Info(段信息)
_0.fnm    - Field Names(字段名称)
_0.fdx    - Field Index(字段索引)
_0.fdt    - Field Data(字段数据,存储_source)
_0.tim    - Term Dictionary(词项字典)
_0.tip    - Term Index(词项索引)
_0.doc    - Document频率和跳表
_0.pos    - 位置信息
_0.pay    - Payload数据
_0.nvd    - Norms(归一化因子)
_0.nvm    - Norms元数据
_0.dvd    - DocValues(列式存储)
_0.dvm - DocValues元数据Segment结构图:
Segment文件 倒排索引 文档存储 列式存储 Segment Info
(.si) DocValues
(.dvd) DocValues Meta
(.dvm) Field Data
(.fdt) _source Field Index
(.fdx) Term Dictionary
(.tim) Term Index
(.tip) Frequencies & Skip
(.doc) Positions
(.pos) 查询请求 获取文档 聚合/排序
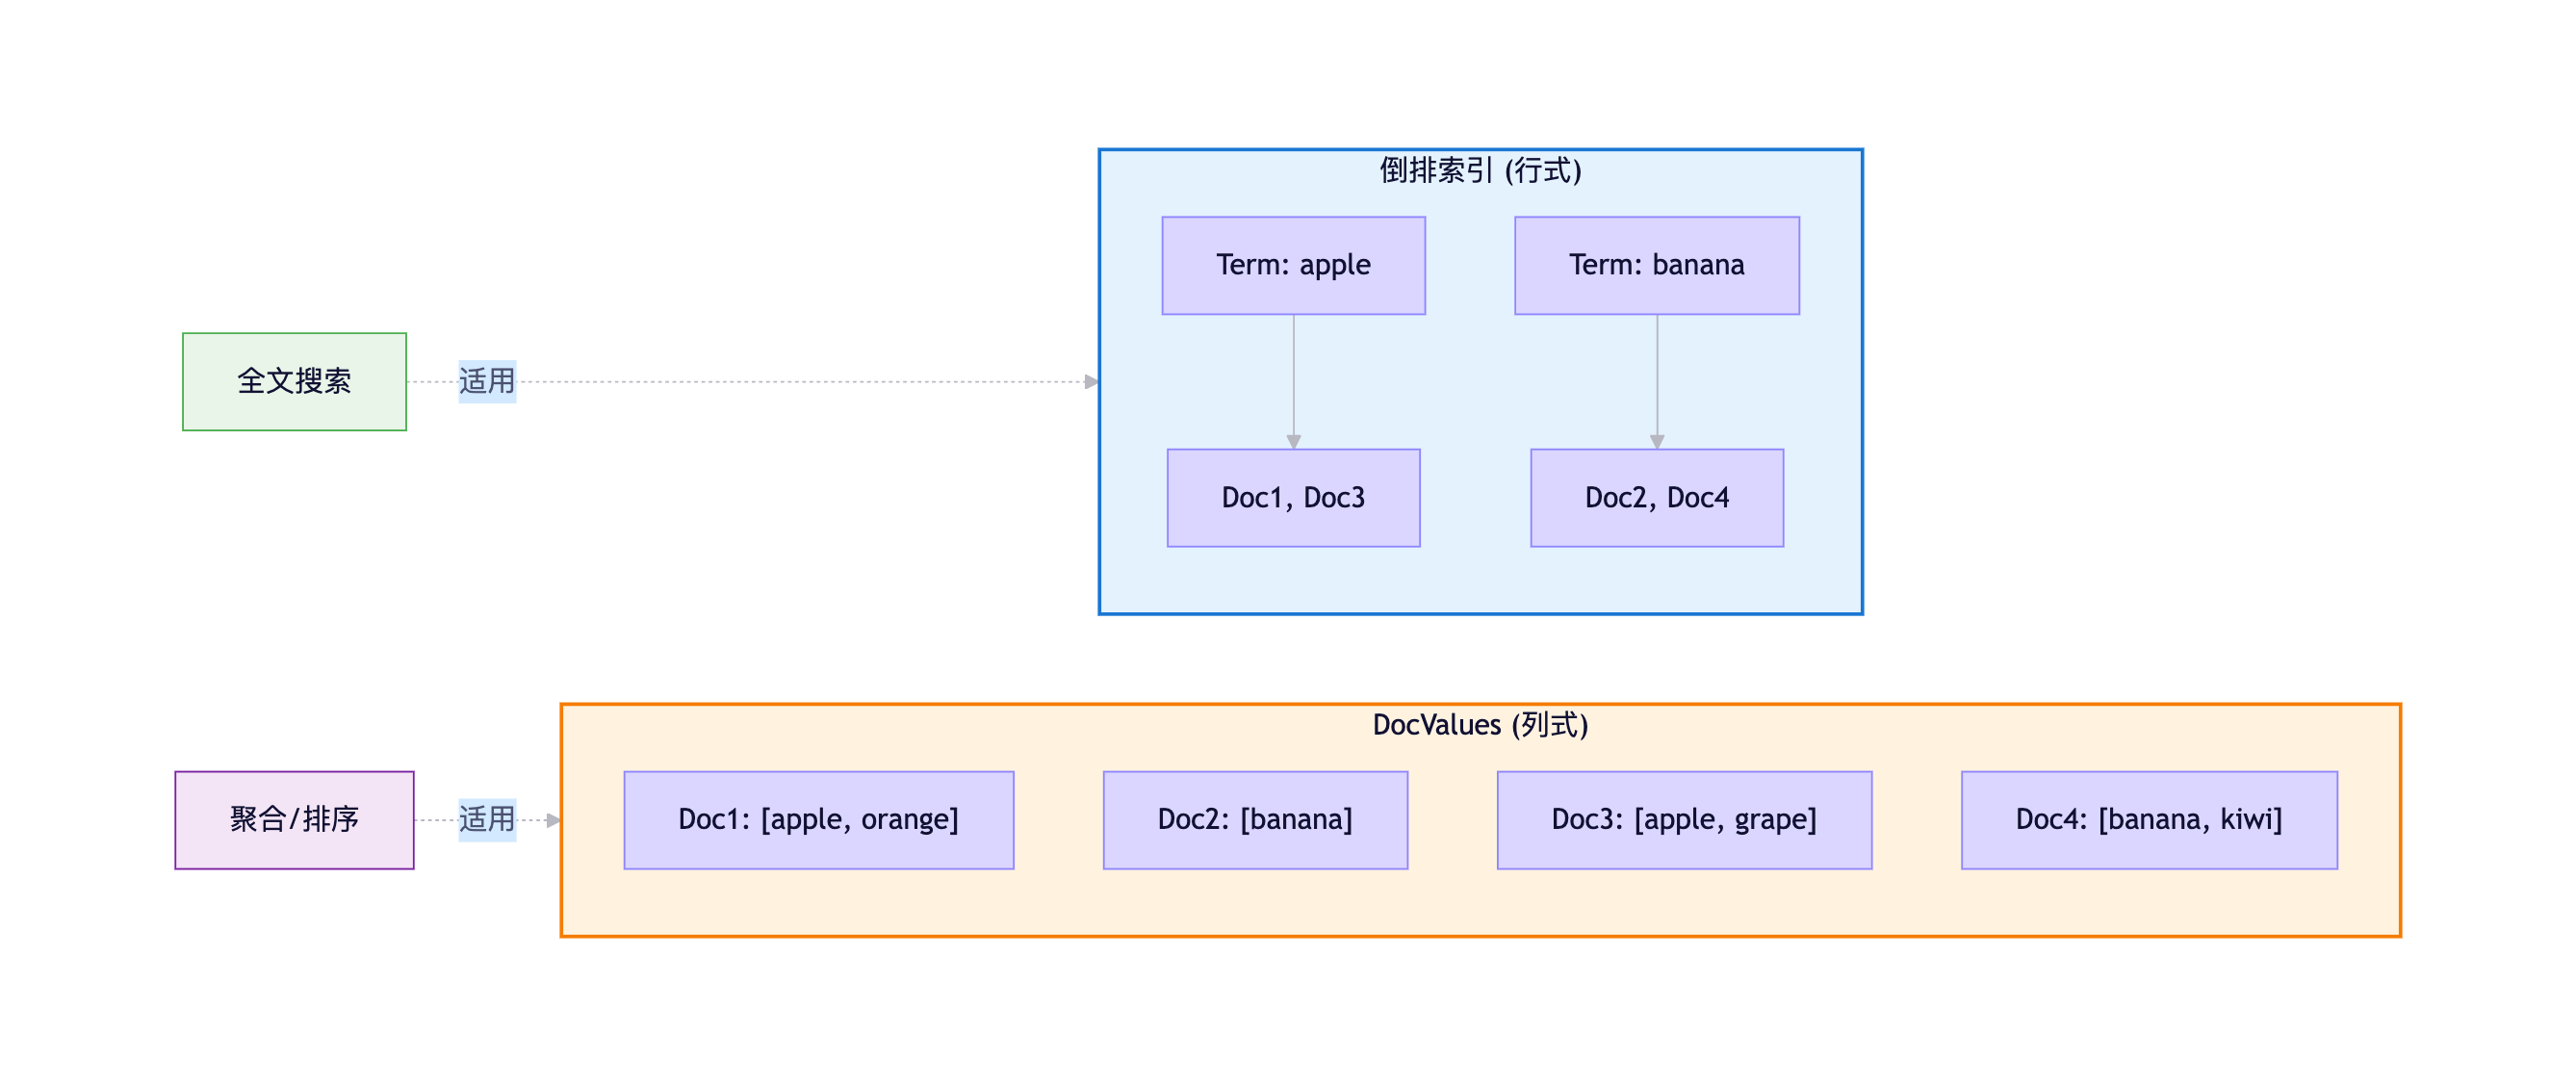
2.2.2 DocValues - 列式存储
为什么需要DocValues?
倒排索引的局限:
- 设计用于快速全文检索
- 不适合聚合、排序、脚本访问
- 需要反向查找,效率低下

DocValues解决方案:
- 列式存储,预先构建
- 支持快速聚合和排序
- 磁盘友好,可以使用mmap
DocValues vs 倒排索引:
DocValues存储格式:
Numeric类型 (long, double):
- 使用Table压缩
- GCD(最大公约数)编码
- Delta编码

示例:
原始值: [100, 200, 300, 400, 500]
GCD: 100
存储: base=100, mult=100, values=[1,2,3,4,5]
节省: 80%空间

Keyword类型:
- Ordinal编码
- 相同字符串映射到同一个序号

示例:
values: ["apple", "banana", "apple", "cherry"]
ordinals: [0, 1, 0, 2]
dictionary: {0:"apple", 1:"banana", 2:"cherry"}DocValues内存映射:
DocValues使用mmap(内存映射文件):

优势:
1. 不占用JVM Heap空间
2. 由操作系统管理缓存
3. 多个进程可共享
4. 热数据自动常驻内存

配置:
PUT /my_index
{
  "mappings": {
    "properties": {
      "status": {
        "type": "keyword",
        "doc_values": true  // 默认开启
      },
      "description": {
        "type": "text",
        "doc_values": false // text类型不支持
      }
    }
  }
}
2.3 写入流程详解
2.3.1 完整写入流程
ES的写入过程涉及多个阶段,确保数据的持久化和可搜索性:
Client Coordinating Node Primary Shard Replica Shard Disk 1. 写入请求 2. 路由计算 hash(_id) % shards 3. 转发到主分片 4. 写入Translog (保证持久化) 写Translog 5. 写入Memory Buffer (内存缓冲) 6. 并行复制到副本分片 7. 副本写Translog 写Translog 8. 副本写Memory Buffer 9. 确认成功 10. 主分片确认 11. 返回成功 12. 后台Refresh (每1秒) Memory Buffer → Segment 数据可搜索 13. 后台Flush (每30分钟或Translog达到阈值) Segment → 磁盘 清空Translog Client Coordinating Node Primary Shard Replica Shard Disk
2.3.2 Refresh机制
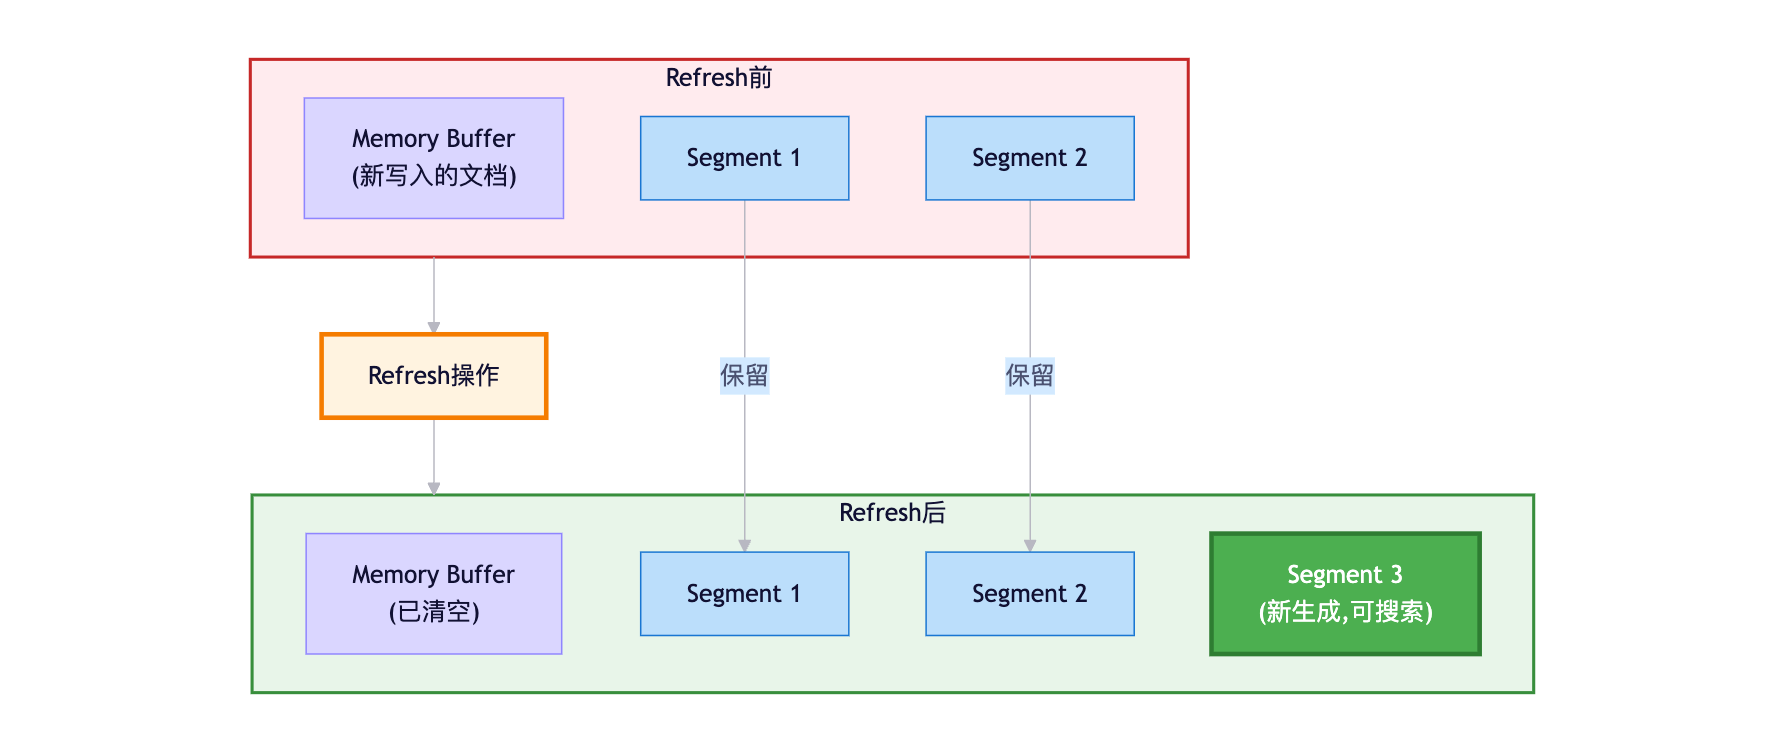
什么是Refresh?
Refresh操作:
- 将Memory Buffer中的文档生成新的Segment
- 新Segment写入文件系统缓存(未fsync到磁盘)
- 打开新Segment供搜索使用
- 清空Memory Buffer

触发时机:
1. 定时触发:默认每1秒(refresh_interval)
2. 手动触发:POST /_refresh
3. Translog达到阈值Refresh流程图:
Refresh性能影响:
刷新频率与性能的权衡:

refresh_interval = 1s(默认):
- 近实时搜索(1秒延迟)
- Segment生成频繁
- 适合实时查询场景

refresh_interval = 30s:
- 搜索延迟增加
- Segment生成减少
- 写入性能提升30%
- 适合批量导入场景

refresh_interval = -1:
- 禁用自动刷新
- 写入性能最优
- 手动触发刷新
- 适合离线建索引
2.3.3 Translog机制
Translog的作用:
1. 持久化保障:
   - 写入先记录到Translog
   - Translog立即fsync到磁盘
   - 保证数据不丢失

2. 崩溃恢复:
   - ES重启后读取Translog
   - 重放未提交的操作
   - 恢复到崩溃前状态

3. 实时读取:
   - 查询会同时查Memory Buffer和Translog
- 保证写入后立即可见Translog文件结构:
translog-1.tlog   - 事务日志文件
translog-1.ckp    - 检查点文件

日志格式:
{
  "operation": "index",
  "index": "products",
  "id": "1",
  "version": 1,
  "source": {
    "name": "iPhone"
  }
}
Flush操作 :
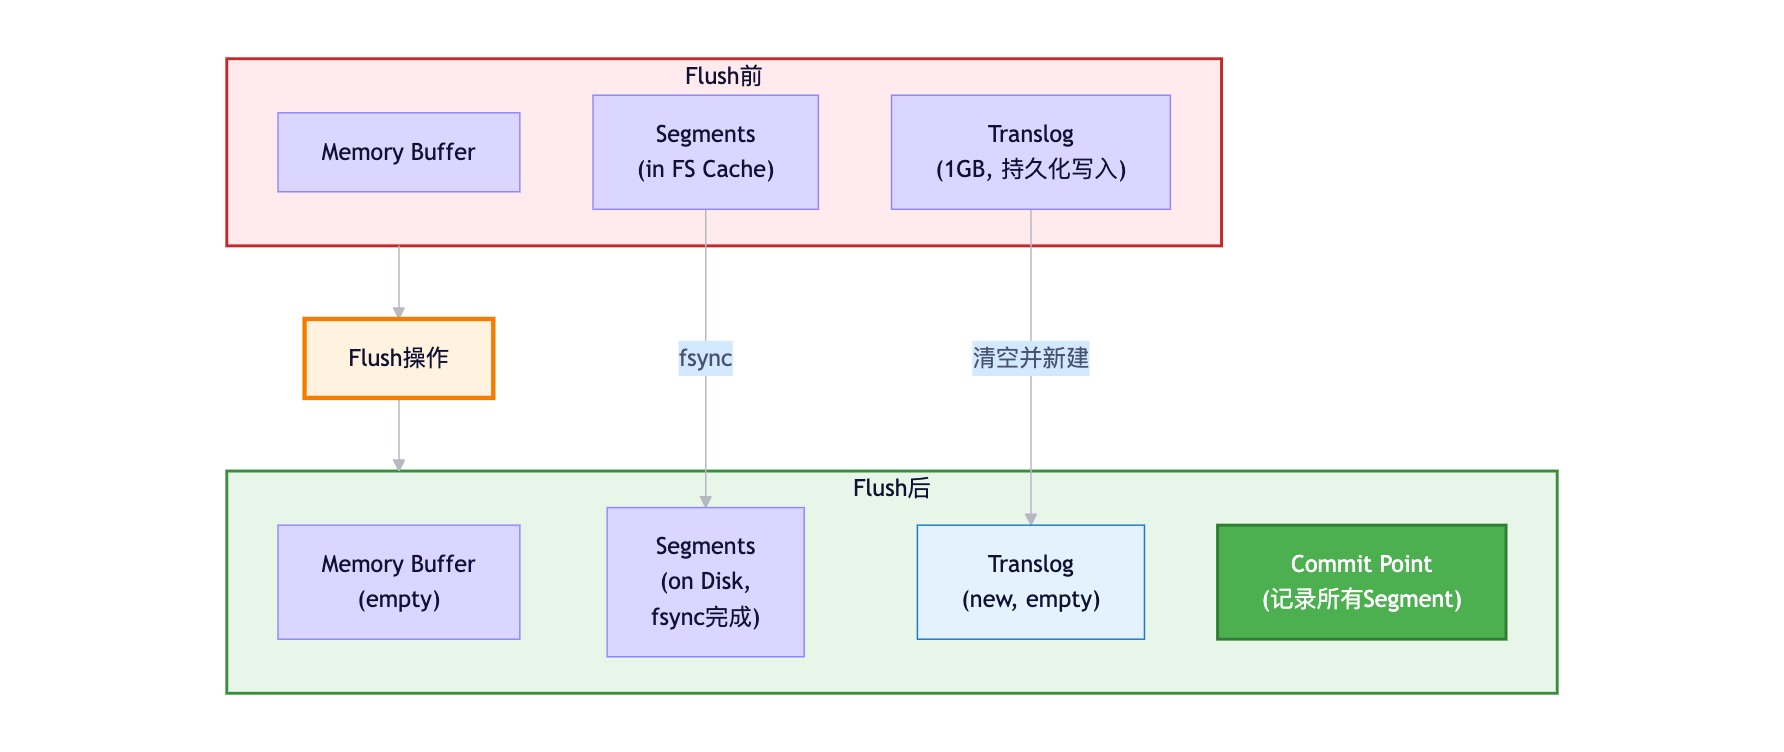
Flush触发条件:
自动Flush:
1. Translog大小超过阈值(默认512MB)
2. 定时触发(默认30分钟)
3. 索引关闭或节点关闭

配置优化:
PUT /my_index/_settings
{
  "index": {
    "translog": {
      "flush_threshold_size": "1gb",    // 增大阈值,减少Flush频率
      "sync_interval": "30s",           // 同步间隔
      "durability": "async"             // 异步模式(性能优先)
    }
  }
}

注意:
- durability=async: 每5秒fsync一次,可能丢失5秒数据
- durability=request: 每次请求都fsync(默认,最安全)
2.4 Segment合并
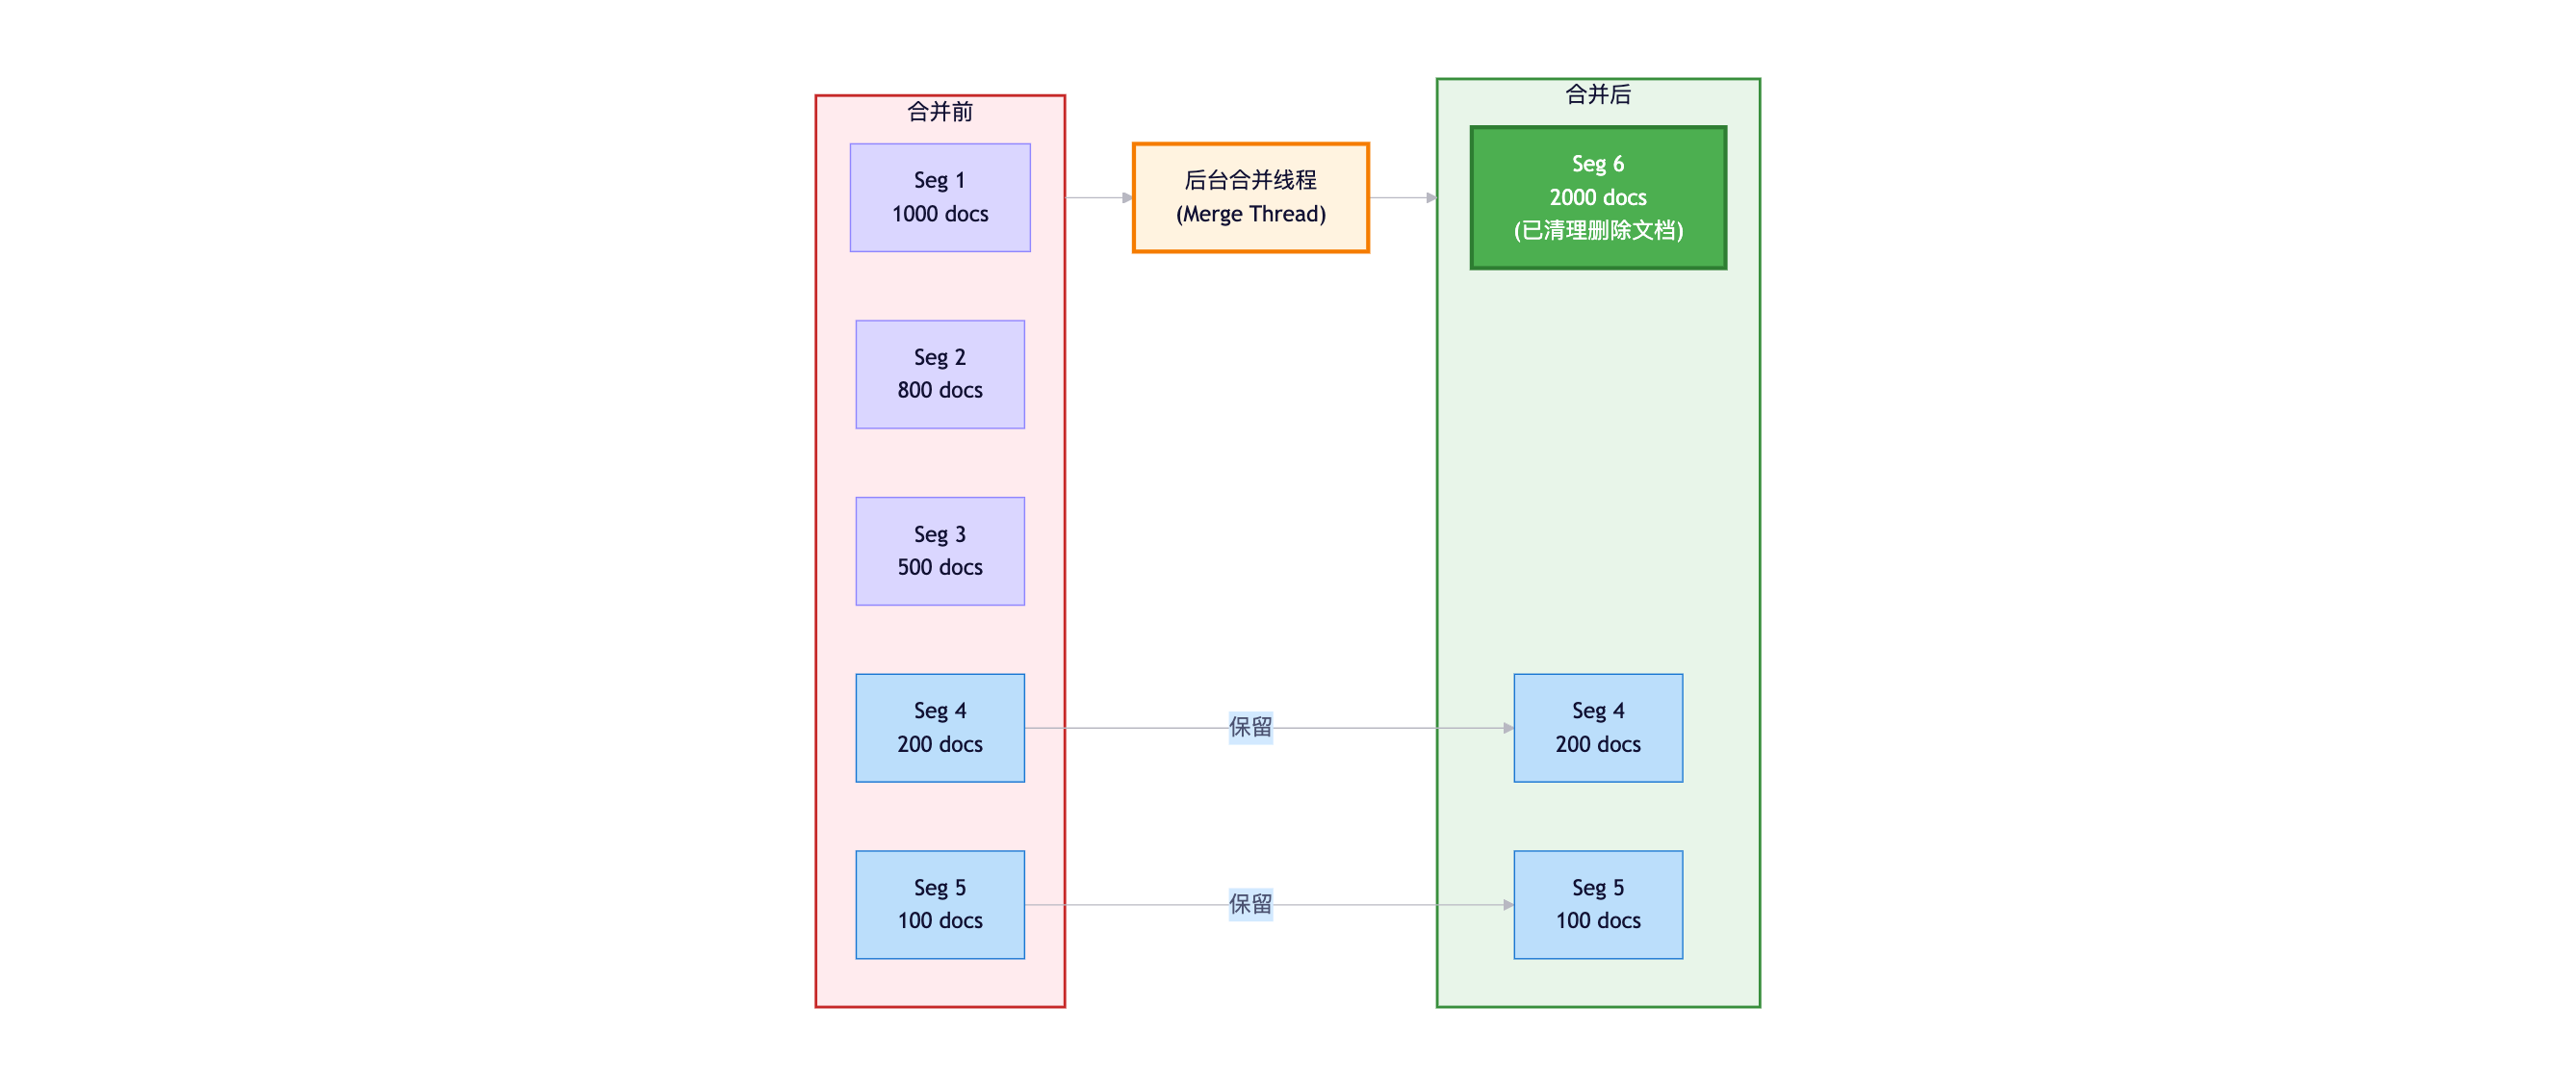
2.4.1 为什么需要合并?
Segment增长问题:
- 每次Refresh生成新Segment
- Segment数量快速增长
- 查询需要遍历所有Segment
- 性能下降

示例:
refresh_interval=1s,写入1小时
生成Segment数:3600个
查询需要:遍历3600个Segment
性能影响:响应时间增加10倍以上合并流程:
2.4.2 合并策略
Tiered Merge Policy(分层合并策略):
配置参数:
index.merge.policy.segments_per_tier: 10        // 每层最多Segment数
index.merge.policy.max_merge_at_once: 10        // 一次最多合并Segment数
index.merge.policy.max_merged_segment: 5gb      // 合并后的最大Segment大小

工作原理:
1. 将Segment分为多个层级
2. 小Segment合并为中等Segment
3. 中等Segment合并为大Segment
4. 避免频繁合并大Segment

优势:
- 平衡写入和查询性能
- 避免合并风暴
- 可配置性强合并性能影响:
合并开销:
- CPU:压缩、编码计算
- 磁盘I/O:读旧Segment,写新Segment
- 内存:合并缓冲区

优化配置:
PUT /my_index/_settings
{
  "index": {
    "merge": {
      "scheduler": {
        "max_thread_count": 1    // 合并线程数,减少对查询的影响
      }
    }
  }
}

监控合并:
GET /_cat/segments/my_index?v
GET /_nodes/stats/indices/segments
小结
本章详细介绍了Elasticsearch的存储机制:
- 倒排索引:Term Dictionary + Posting List + FST数据结构
- Segment结构:不可变文件、列式存储DocValues
- 写入流程:Translog → Memory Buffer → Refresh → Flush
- 性能优化:Segment合并、压缩编码、文件系统缓存
理解这些底层机制,对于优化ES性能和排查问题至关重要。
第三章:分布式读写流程与查询优化
3.1 分布式读写流程详解
3.1.1 完整写入流程
当客户端向ES发起写入请求时,整个流程涉及协调节点、主分片、副本分片的协作:
写入流程图:
异步 客户端发起写入请求
POST /products/_doc/1 协调节点接收请求 路由计算
shard = hash(_id) % num_shards 定位主分片所在节点 转发请求到主分片 主分片写入Translog
(fsync到磁盘) 主分片写入Memory Buffer 并行复制到所有副本分片 副本写入Translog 副本写入Memory Buffer 副本确认成功 主分片确认成功 返回成功响应给客户端 后台定时Refresh
(1秒后) 数据可搜索
关键步骤说明:
-
路由计算:
shard_num = hash(_routing) % num_primary_shards 默认情况下,_routing = _id 例如:_id = "1001" hash("1001") = 12345678 假设有3个主分片:12345678 % 3 = 0 → 文档写入到主分片0 -
Translog写入:
- 先写Translog,保证数据持久化
- 默认每次请求都fsync(
durability=request) - 即使ES崩溃,也能从Translog恢复数据
-
副本复制:
- 主分片并行复制到所有副本
- 等待所有副本确认后才返回成功
- 保证数据一致性
-
近实时可搜索:
- 数据写入Memory Buffer后不可搜索
- 需要等待Refresh操作
- 默认1秒后可搜索(Near Real-Time)
3.1.2 完整读取流程
ES的查询分为两个阶段:Query Phase(查询阶段) 和 Fetch Phase(获取阶段)。
读取流程图:
Client Coordinating Node Primary Shard 0 Replica Shard 1 Primary Shard 2 Query Phase(查询阶段) GET /products/_search {"query": {...}, "size": 10} 解析查询DSL 查询请求 查询请求(副本分片) 查询请求 par 并行查询所有分片 倒排索引查询 计算相关性分数 排序 倒排索引查询 计算相关性分数 排序 倒排索引查询 计算相关性分数 排序 par 各分片本地执行 doc_id, score 1, 0.95, 5, 0.88 doc_id, score 3, 0.92, 7, 0.85 doc_id, score 2, 0.90, 6, 0.80 par 返回轻量级结果 合并、全局排序、分页 Top 10: 1, 3, 2, 5, 7, ... Fetch Phase(获取阶段) 获取doc 1, 5 获取doc 3, 7 获取doc 2, 6 par 请求完整文档 _source of doc 1, 5 _source of doc 3, 7 _source of doc 2, 6 par 返回文档内容 按排序顺序组装最终结果 返回Top 10完整文档 Client Coordinating Node Primary Shard 0 Replica Shard 1 Primary Shard 2
两阶段设计的优势:
为什么不在Query Phase直接返回完整文档?

问题场景:
- 3个分片,每个返回Top 10
- 如果返回完整文档:30个完整文档通过网络传输
- 协调节点排序后,只需要Top 10
- 浪费的网络传输:20个完整文档

两阶段优化:
Query Phase:只传输 [doc_id, score](几十字节)
Fetch Phase:只传输真正需要的10个文档
节省网络带宽:约66%
3.1.3 副本分片的负载均衡
轮询策略(Round Robin):
ES集群 Shard 0 Shard 1 轮询 轮询 轮询 轮询 Coordinating Node Primary 1
(Node 2) Replica 1
(Node 1) Primary 0
(Node 1) Replica 0
(Node 3) 查询请求1 查询请求2 查询请求3 查询请求4
负载均衡策略:
默认策略:Round Robin(轮询)
查询请求1 → Primary Shard 0
查询请求2 → Replica Shard 0
查询请求3 → Primary Shard 1
查询请求4 → Replica Shard 1

优势:
1. 主分片和副本分片都参与查询
2. 分担查询压力,提升吞吐量
3. 副本数越多,查询性能越好

配置自适应副本选择(7.0+):
PUT /_cluster/settings
{
  "transient": {
    "cluster.routing.use_adaptive_replica_selection": true
  }
}

自适应策略:
- 根据分片响应时间动态选择
- 优先选择响应快的副本
- 避免热点分片
3.2 查询优化深度解析
3.2.1 深分页问题
问题根源:
查询:GET /products/_search?from=9990&size=10

执行流程:
1. 协调节点向所有分片请求Top 10000条数据
2. 假设3个分片,每个返回10000条 [doc_id, score]
3. 协调节点收到30000条数据
4. 全局排序,取10000-10010位的10条
5. Fetch Phase获取这10条完整文档

问题:
- 协调节点需要处理30000条数据
- 内存占用:30000 * (8字节ID + 4字节score) = 360KB(小数据)
- 但实际生产中,from+size可能达到百万级
- 内存占用:1000000 * 3 * 12字节 = 36MB
- 多个并发请求会导致OOM
- 性能极差,响应时间秒级

限制:
index.max_result_window = 10000(默认)
from + size 不能超过10000解决方案对比:
| 方案 | 适用场景 | 优点 | 缺点 |
|---|---|---|---|
| Search After | 实时滚动查询、下一页 | 性能好、无窗口限制 | 不支持随机跳页 |
| Scroll API | 大数据导出、离线处理 | 性能好、支持大数据 | 非实时、占用资源 |
| PIT + Search After | 7.10+推荐方案 | 结合两者优势 | 需要7.10+ |
方案1:Search After(推荐)
json
// 第一次查询
GET /products/_search
{
  "size": 10,
  "query": {
    "match": { "name": "phone" }
  },
  "sort": [
    { "price": "asc" },
    { "_id": "asc" }  // 确保排序唯一性
  ]
}

// 响应
{
  "hits": {
    "hits": [
      {
        "_id": "1001",
        "_source": {...},
        "sort": [999, "1001"]  // 最后一条的sort值
      }
    ]
  }
}

// 第二次查询(下一页)
GET /products/_search
{
  "size": 10,
  "query": {
    "match": { "name": "phone" }
  },
  "sort": [
    { "price": "asc" },
    { "_id": "asc" }
  ],
  "search_after": [999, "1001"]  // 使用上一页最后一条的sort值
}
Search After流程图:
Client Elasticsearch 第1页查询 size=10, sort=price, _id 返回10条 + 最后sort值999, "1001" 第2页查询 size=10, search_after=999, "1001" 跳过所有<= 999, "1001"的文档 直接返回后10条 返回10条 + 最后sort值1099, "1015" 第3页查询 size=10, search_after=1099, "1015" 返回10条... Client Elasticsearch
方案2:Scroll API(大数据导出)
json
// 创建游标(第一次查询)
POST /products/_search?scroll=5m
{
  "size": 1000,
  "query": {
    "match_all": {}
  }
}

// 响应
{
  "_scroll_id": "DXF1ZXJ5QW5kRmV0Y2gBAAAAAAAAAD4...",
  "hits": {
    "total": {"value": 100000},
    "hits": [...]  // 1000条数据
  }
}

// 继续滚动
POST /_search/scroll
{
  "scroll": "5m",
  "scroll_id": "DXF1ZXJ5QW5kRmV0Y2gBAAAAAAAAAD4..."
}

// 关闭游标(释放资源)
DELETE /_search/scroll
{
  "scroll_id": "DXF1ZXJ5QW5kRmV0Y2gBAAAAAAAAAD4..."
}Scroll特点:
优势:
1. 创建快照(Snapshot),保证数据一致性
2. 性能好,每次只返回一批数据
3. 适合大数据量导出

劣势:
1. 数据非实时(快照时间点的数据)
2. 占用服务器资源(维护快照)
3. 不适合实时查询场景
4. 需要手动关闭scroll_id

使用建议:
- 仅用于批量导出、数据迁移、离线分析
- 设置合理的scroll超时时间(如5m)
- 及时关闭scroll_id释放资源
3.2.2 查询性能优化
1. 使用Filter上下文
json
// ❌ 错误:全部用Query上下文,计算相关性分数
GET /products/_search
{
  "query": {
    "bool": {
      "must": [
        { "match": { "name": "phone" } },      // 需要分数
        { "term": { "status": "available" } }, // 不需要分数
        { "range": { "price": { "lte": 5000 } } } // 不需要分数
      ]
    }
  }
}

// ✅ 正确:精确匹配用Filter,全文搜索用Query
GET /products/_search
{
  "query": {
    "bool": {
      "must": [
        { "match": { "name": "phone" } }  // Query上下文,计算分数
      ],
      "filter": [  // Filter上下文,不计算分数,可缓存
        { "term": { "status": "available" } },
        { "range": { "price": { "lte": 5000 } } }
      ]
    }
  }
}
Filter vs Query对比 :
2. 控制返回字段
json
// ❌ 返回所有字段(_source很大时浪费带宽)
GET /products/_search
{
  "query": {...}
}

// ✅ 只返回需要的字段
GET /products/_search
{
  "_source": ["name", "price", "image_url"],
  "query": {...}
}

// ✅ 排除大字段
GET /products/_search
{
  "_source": {
    "excludes": ["description", "specs", "reviews"]
  },
  "query": {...}
}

// ✅ 不返回_source(只需要ID和score)
GET /products/_search
{
  "_source": false,
  "query": {...}
}
3. 避免通配符和正则查询
json
// ❌ 通配符查询(扫描所有Term,性能极差)
GET /products/_search
{
  "query": {
    "wildcard": {
      "name": "*phone*"  // 需要遍历所有词项
    }
  }
}

// ✅ 使用N-gram分词器+Match查询
PUT /products
{
  "settings": {
    "analysis": {
      "analyzer": {
        "ngram_analyzer": {
          "tokenizer": "ngram_tokenizer"
        }
      },
      "tokenizer": {
        "ngram_tokenizer": {
          "type": "ngram",
          "min_gram": 2,
          "max_gram": 3
        }
      }
    }
  },
  "mappings": {
    "properties": {
      "name": {
        "type": "text",
        "analyzer": "ngram_analyzer"
      }
    }
  }
}

// 查询
GET /products/_search
{
  "query": {
    "match": {
      "name": "phone"  // 使用倒排索引,性能好
    }
  }
}
4. 合理设置分片数量
分片数量规划:

单个分片大小:20GB - 50GB
分片过多的问题:
- 每个查询需要访问所有分片
- 协调节点合并开销大
- 集群元数据管理开销大

分片过少的问题:
- 单个分片过大,查询慢
- 无法充分利用集群资源
- 无法水平扩展

推荐配置:
小索引(<10GB):1个主分片
中等索引(10GB-100GB):3-5个主分片
大索引(>100GB):根据"单分片20-50GB"计算

示例:
500GB数据
单分片30GB → 500/30 ≈ 17个主分片
考虑扩展 → 20个主分片(推荐)
3.3 聚合查询优化
3.3.1 聚合类型与应用
1. Metric Aggregations(指标聚合)
json
// 统计价格:平均值、最大值、最小值、总和
GET /products/_search
{
  "size": 0,  // 不返回文档,只返回聚合结果
  "aggs": {
    "price_stats": {
      "stats": {
        "field": "price"
      }
    }
  }
}

// 响应
{
  "aggregations": {
    "price_stats": {
      "count": 1000,
      "min": 99.0,
      "max": 9999.0,
      "avg": 2500.5,
      "sum": 2500500.0
    }
  }
}

// 去重计数
GET /products/_search
{
  "size": 0,
  "aggs": {
    "unique_brands": {
      "cardinality": {
        "field": "brand.keyword"  // keyword类型
      }
    }
  }
}
2. Bucket Aggregations(桶聚合)
json
// 按品牌分组统计
GET /products/_search
{
  "size": 0,
  "aggs": {
    "brands": {
      "terms": {
        "field": "brand.keyword",
        "size": 10  // Top 10品牌
      },
      "aggs": {  // 嵌套聚合
        "avg_price": {
          "avg": { "field": "price" }
        }
      }
    }
  }
}

// 响应
{
  "aggregations": {
    "brands": {
      "buckets": [
        {
          "key": "Apple",
          "doc_count": 150,
          "avg_price": { "value": 5500.0 }
        },
        {
          "key": "Samsung",
          "doc_count": 120,
          "avg_price": { "value": 3200.0 }
        }
      ]
    }
  }
}

// 日期直方图(时间序列分析)
GET /orders/_search
{
  "size": 0,
  "aggs": {
    "sales_over_time": {
      "date_histogram": {
        "field": "created_at",
        "calendar_interval": "day"  // 按天分组
      },
      "aggs": {
        "total_amount": {
          "sum": { "field": "amount" }
        }
      }
    }
  }
}聚合执行流程:
Client Coordinating Node Shard1 Shard2 Shard3 聚合请求 分片聚合 分片聚合 分片聚合 par 并行聚合 {Apple: 50, Samsung: 30} {Apple: 60, Huawei: 40} {Apple: 40, Samsung: 50} par 返回部分聚合结果 合并聚合结果 {Apple: 150, Samsung: 80, Huawei: 40} 最终聚合结果 Client Coordinating Node Shard1 Shard2 Shard3
3.3.2 聚合性能优化
1. 使用DocValues
json
// ✅ 确保聚合字段启用doc_values
PUT /products
{
  "mappings": {
    "properties": {
      "brand": {
        "type": "keyword",
        "doc_values": true  // 默认开启,列式存储
      },
      "description": {
        "type": "text",
        "doc_values": false  // text不支持doc_values
      }
    }
  }
}
2. 避免在text字段上聚合
json
// ❌ 错误:在text字段上聚合
GET /products/_search
{
  "aggs": {
    "brands": {
      "terms": {
        "field": "brand"  // text类型,分词后聚合无意义
      }
    }
  }
}

// ✅ 正确:使用keyword类型或fields
GET /products/_search
{
  "aggs": {
    "brands": {
      "terms": {
        "field": "brand.keyword"  // keyword子字段
      }
    }
  }
}
3. 控制聚合精度
json
// 控制Terms聚合的精度
GET /products/_search
{
  "size": 0,
  "aggs": {
    "brands": {
      "terms": {
        "field": "brand.keyword",
        "size": 100,  // 返回Top 100
        "shard_size": 1000  // 每个分片返回Top 1000,提升准确性
      }
    }
  }
}
小结
本章深入讲解了Elasticsearch的分布式读写流程和查询优化:
- 分布式写入:路由 → 主分片 → Translog → Memory Buffer → 副本复制
- 分布式查询:Query Phase(轻量级排序) → Fetch Phase(获取文档)
- 深分页优化:Search After(实时) / Scroll API(离线)
- 查询优化:Filter上下文、控制返回字段、避免通配符、合理分片
- 聚合优化:使用DocValues、keyword类型、控制精度
第四章:Mapping设计与字段类型详解
Elasticsearch的Mapping相当于关系型数据库的表结构定义,它决定了数据如何被索引和查询。理解Mapping设计是掌握ES的关键。
4.1 什么是Mapping?
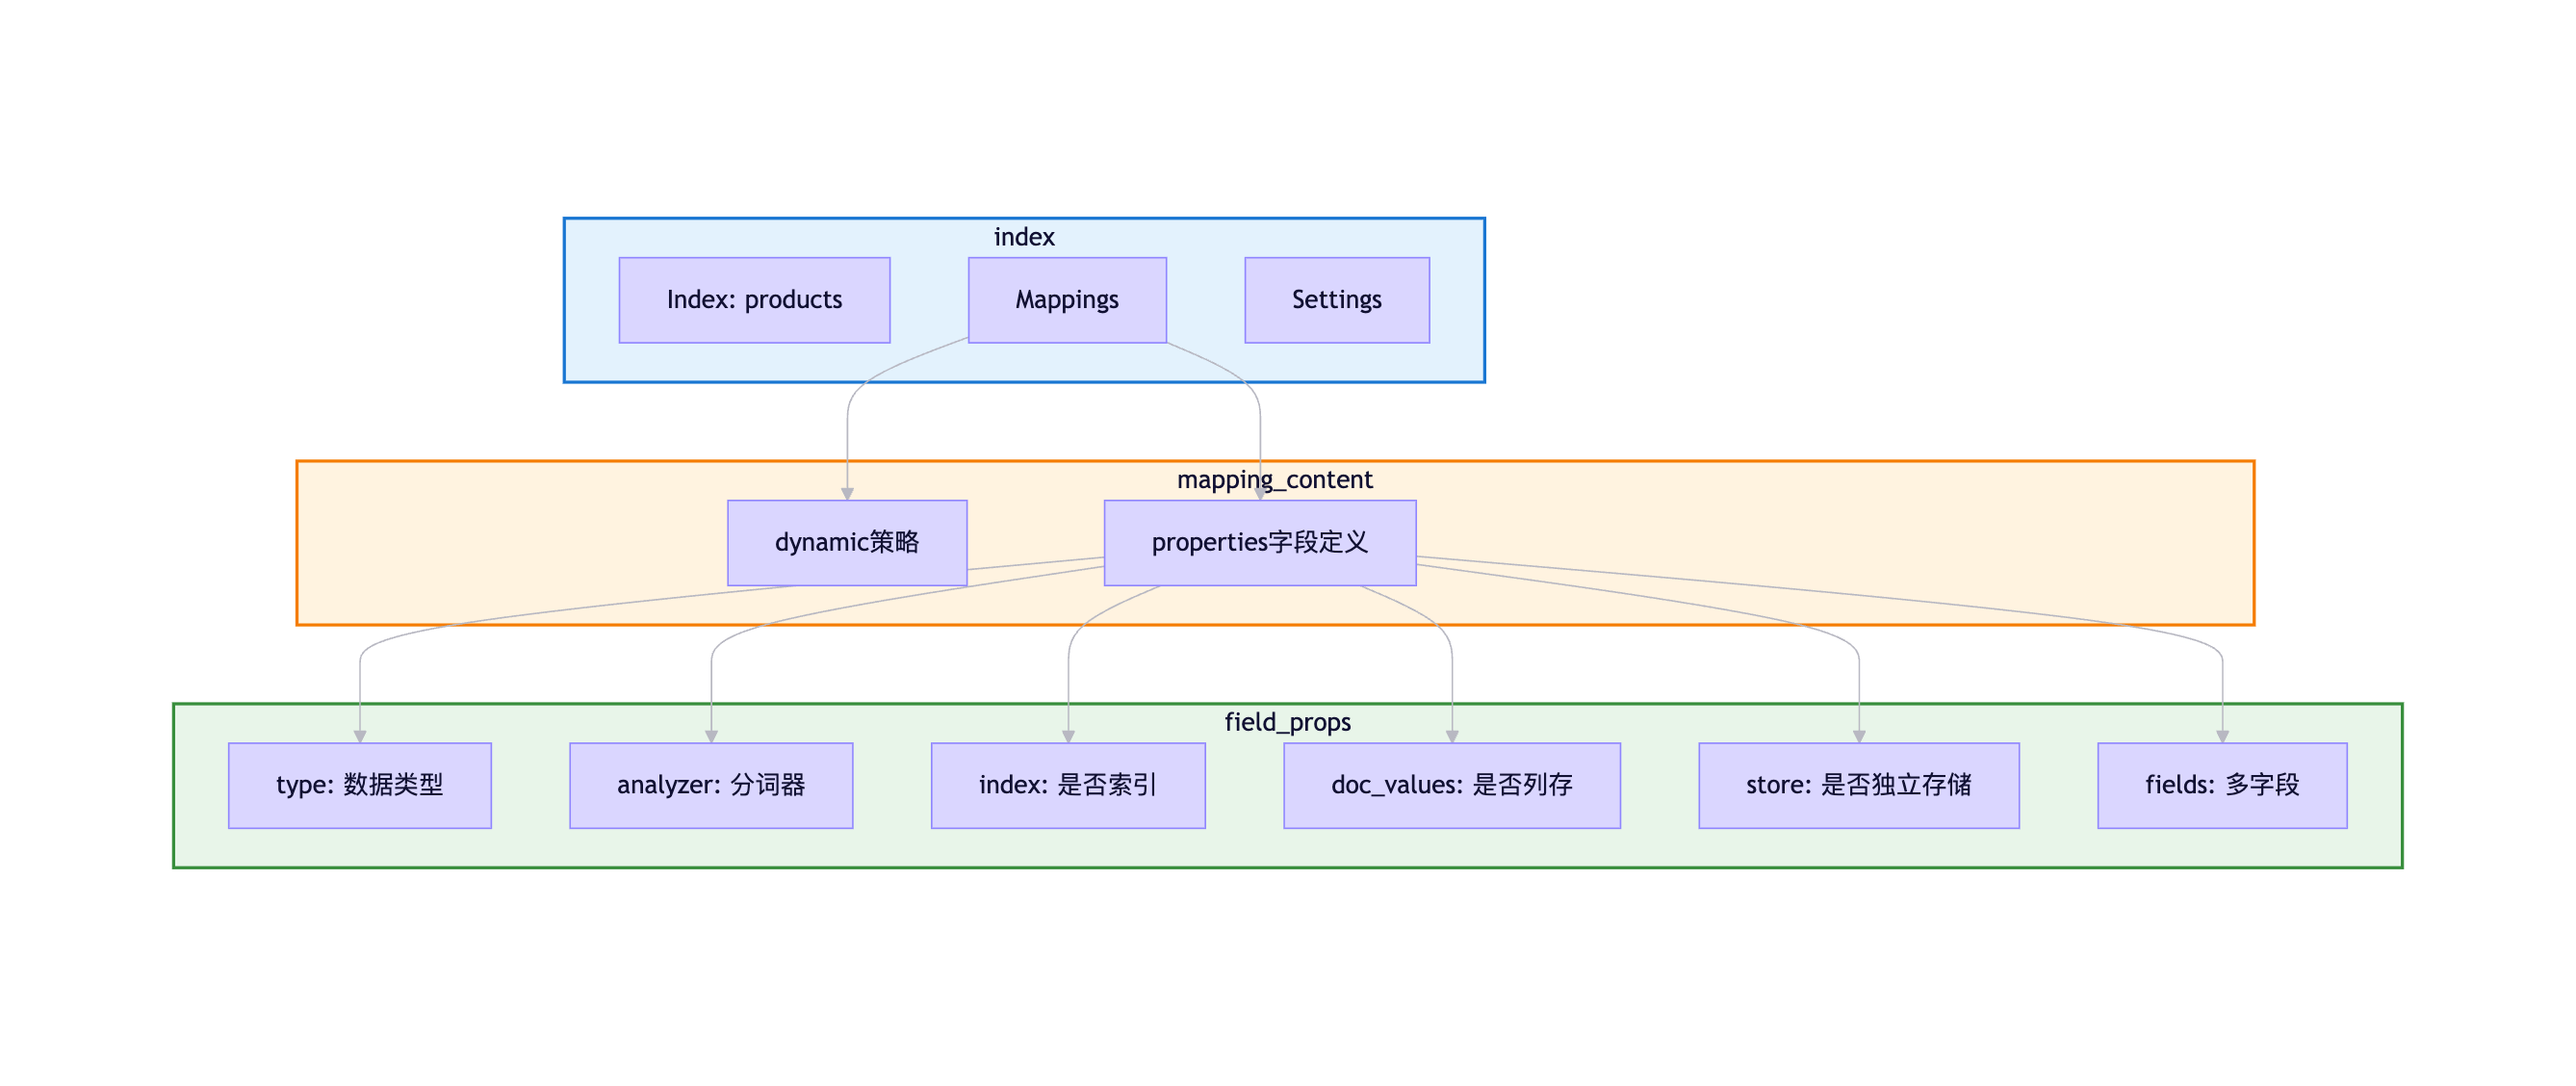
Mapping的作用:
Mapping定义了索引中文档的字段及其属性:
- 字段的数据类型(text、keyword、date、long等)
- 字段是否被索引、是否可搜索
- 使用哪个分词器
- 是否支持聚合和排序
Mapping结构:
Mapping定义示例:
json
PUT /products
{
  "settings": {
    "number_of_shards": 3,
    "number_of_replicas": 1,
    "analysis": {
      "analyzer": {
        "ik_smart_analyzer": {
          "type": "custom",
          "tokenizer": "ik_smart"
        }
      }
    }
  },
  "mappings": {
    "dynamic": "strict",
    "properties": {
      "name": {
        "type": "text",
        "analyzer": "ik_smart_analyzer",
        "fields": {
          "keyword": {
            "type": "keyword",
            "ignore_above": 256
          }
        }
      },
      "price": {
        "type": "double"
      },
      "status": {
        "type": "keyword"
      },
      "tags": {
        "type": "keyword"
      },
      "created_at": {
        "type": "date",
        "format": "yyyy-MM-dd HH:mm:ss||epoch_millis"
      }
    }
  }
}
4.2 动态映射 vs 静态映射
4.2.1 动态映射(Dynamic Mapping)
当写入文档包含新字段时,ES自动推测字段类型并创建映射。
类型推断规则:
JSON数据类型 → ES字段类型

true/false → boolean
123 → long
123.45 → double
"2024-01-01" → date (如果符合格式)
"hello" → text + keyword (默认创建两个字段)
{"name": "Alice"} → object
[1, 2, 3] → long数组动态映射示例:
bash
# 写入文档(索引不存在)
POST /products/_doc/1
{
  "name": "iPhone 15",
  "price": 7999,
  "on_sale": true,
  "created_at": "2024-01-01"
}

# 查看自动生成的Mapping
GET /products/_mapping

# 响应:
{
  "products": {
    "mappings": {
      "properties": {
        "name": {
          "type": "text",
          "fields": {
            "keyword": {
              "type": "keyword",
              "ignore_above": 256
            }
          }
        },
        "price": {
          "type": "long"
        },
        "on_sale": {
          "type": "boolean"
        },
        "created_at": {
          "type": "date"
        }
      }
    }
  }
}动态映射的问题:
-
类型推断不准确:
json// 问题:手机号被识别为long POST /users/_doc/1 { "mobile": 13800138000 // 推断为long,无法用通配符查询 } // 应该使用keyword类型 { "mobile": "13800138000" // 字符串 → text+keyword } -
无法控制分词器:
json// 中文字段使用默认standard分词器,无法正确分词 { "description": "这是商品描述" // 使用standard分词器(单字分词) } // 应该显式指定ik分词器 -
字段爆炸:
动态映射允许无限新增字段
→ 可能导致字段数超过限制(默认1000)
→ 影响集群性能
4.2.2 静态映射(Explicit Mapping)
提前定义好所有字段的类型和属性。
静态映射示例:
json
PUT /products
{
  "mappings": {
    "dynamic": "strict",  // 禁止动态新增字段
    "properties": {
      "name": {
        "type": "text",
        "analyzer": "ik_smart",
        "fields": {
          "keyword": {
            "type": "keyword",
            "ignore_above": 256
          }
        }
      },
      "description": {
        "type": "text",
        "analyzer": "ik_max_word"
      },
      "price": {
        "type": "double"
      },
      "status": {
        "type": "keyword"
      },
      "tags": {
        "type": "keyword"
      },
      "created_at": {
        "type": "date",
        "format": "yyyy-MM-dd HH:mm:ss||epoch_millis"
      }
    }
  }
}dynamic参数:
| 值 | 说明 |
|---|---|
true |
默认值,允许动态新增字段 |
false |
忽略新字段,不索引但存储在_source中 |
strict |
拒绝新字段,写入会报错(推荐生产环境使用) |
配置示例:
json
PUT /products
{
  "mappings": {
    "dynamic": "strict",
    "properties": {
      // ... 定义字段
    }
  }
}

# 写入包含未定义字段的文档
POST /products/_doc/1
{
  "name": "iPhone",
  "unknown_field": "value"  // 未定义的字段
}

# 响应:报错
{
  "error": {
    "type": "strict_dynamic_mapping_exception",
    "reason": "mapping set to strict, dynamic introduction of [unknown_field] within [_doc] is not allowed"
  }
}最佳实践:
开发环境:dynamic = true(快速迭代)
测试环境:dynamic = false(发现遗漏字段)
生产环境:dynamic = strict(严格控制)
4.3 核心字段类型详解
4.3.1 Text vs Keyword:最重要的区别
这是ES中最常用也最容易混淆的两种类型。
对比表:
| 特性 | Text | Keyword |
|---|---|---|
| 是否分词 | ✅ 分词 | ❌ 不分词 |
| 存储方式 | 倒排索引 | 倒排索引 |
| 查询方式 | match查询(全文搜索) | term查询(精确匹配) |
| 支持聚合 | ❌ 不支持 | ✅ 支持 |
| 支持排序 | ❌ 不支持 | ✅ 支持 |
| 典型场景 | 文章内容、商品描述 | 状态、标签、ID |
可视化对比:
Keyword字段 Text字段 输入: available 不分词 词项: available 倒排索引+DocValues 输入: Elasticsearch是一个搜索引擎 分词器: ik_smart 词项: Elasticsearch, 是, 搜索引擎 倒排索引 match查询: 搜索 term查询: available
Text字段示例:
json
// Mapping定义
{
  "description": {
    "type": "text",
    "analyzer": "ik_smart"
  }
}

// 写入文档
POST /products/_doc/1
{
  "description": "iPhone 15 Pro是一款高端智能手机"
}

// Text字段的分词过程
GET /products/_analyze
{
  "field": "description",
  "text": "iPhone 15 Pro是一款高端智能手机"
}

// 响应:
{
  "tokens": [
    {"token": "iphone"},
    {"token": "15"},
    {"token": "pro"},
    {"token": "是"},
    {"token": "一款"},
    {"token": "高端"},
    {"token": "智能手机"}
  ]
}

// 查询:match查询可以匹配任一词项
GET /products/_search
{
  "query": {
    "match": {
      "description": "智能手机"  // 匹配成功
    }
  }
}Keyword字段示例:
json
// Mapping定义
{
  "status": {
    "type": "keyword"
  }
}

// 写入文档
POST /products/_doc/1
{
  "status": "available"
}

// Keyword不分词,完整存储
// term查询:必须精确匹配
GET /products/_search
{
  "query": {
    "term": {
      "status": "available"  // 精确匹配,成功
    }
  }
}

GET /products/_search
{
  "query": {
    "term": {
      "status": "avail"  // 部分匹配,失败
    }
  }
}

// Keyword支持聚合
GET /products/_search
{
  "size": 0,
  "aggs": {
    "status_count": {
      "terms": {
        "field": "status"  // 按status分组统计
      }
    }
  }
}多字段(Multi-fields):
同时支持全文搜索和精确匹配/聚合:
json
PUT /products
{
  "mappings": {
    "properties": {
      "name": {
        "type": "text",
        "analyzer": "ik_smart",
        "fields": {
          "keyword": {
            "type": "keyword",
            "ignore_above": 256
          }
        }
      }
    }
  }
}

// 使用场景
// 全文搜索:name字段
GET /products/_search
{
  "query": {
    "match": {
      "name": "iPhone"
    }
  }
}

// 聚合统计:name.keyword字段
GET /products/_search
{
  "size": 0,
  "aggs": {
    "popular_products": {
      "terms": {
        "field": "name.keyword",
        "size": 10
      }
    }
  }
}

// 精确排序:name.keyword字段
GET /products/_search
{
  "sort": [
    {"name.keyword": "asc"}
  ]
}
4.3.2 Numeric类型
ES提供多种数值类型,选择合适的类型可以节省存储空间。
数值类型对比:
| 类型 | 字节数 | 取值范围 | 使用场景 |
|---|---|---|---|
byte |
1 | -128 ~ 127 | 年龄、状态码 |
short |
2 | -32768 ~ 32767 | 数量、等级 |
integer |
4 | -2^31 ~ 2^31-1 | 普通整数、ID |
long |
8 | -2^63 ~ 2^63-1 | 时间戳、大整数 |
float |
4 | 单精度浮点 | 一般浮点数 |
double |
8 | 双精度浮点 | 高精度浮点数 |
half_float |
2 | 半精度浮点 | 精度要求不高的场景 |
scaled_float |
8 | 固定精度浮点 | 价格、金额 |
scaled_float:
适合存储价格、金额等固定精度的数值:
json
{
  "price": {
    "type": "scaled_float",
    "scaling_factor": 100  // 精确到小数点后2位
  }
}

// 存储价格: 99.99
// 实际存储: 9999 (整数)
// 查询时自动转换: 9999 / 100 = 99.99选择建议:
整数:
- ID、数量 → integer
- 时间戳 → long
- 年龄、状态 → byte/short

浮点数:
- 价格、金额 → scaled_float (精度固定)
- 坐标、比率 → double (精度要求高)
- 评分、权重 → float (精度一般)
4.3.3 Date类型
支持的格式:
json
{
  "created_at": {
    "type": "date",
    "format": "yyyy-MM-dd HH:mm:ss||yyyy-MM-dd||epoch_millis"
  }
}

// 支持的输入格式
POST /products/_doc/1
{
  "created_at": "2024-01-01 10:00:00"  // 格式1
}

POST /products/_doc/2
{
  "created_at": "2024-01-01"  // 格式2
}

POST /products/_doc/3
{
  "created_at": 1704067200000  // 格式3: 毫秒时间戳
}存储方式:
内部存储:统一转换为毫秒时间戳(long类型)
查询返回:按原始格式返回日期范围查询:
json
GET /products/_search
{
  "query": {
    "range": {
      "created_at": {
        "gte": "2024-01-01",
        "lte": "2024-12-31"
      }
    }
  }
}

// 时间运算
GET /products/_search
{
  "query": {
    "range": {
      "created_at": {
        "gte": "now-7d/d",  // 7天前
        "lte": "now/d"       // 今天
      }
    }
  }
}
4.3.4 Boolean类型
json
{
  "is_active": {
    "type": "boolean"
  }
}

// 支持的值
{
  "is_active": true         // 布尔值
}
{
  "is_active": "true"       // 字符串"true"/"false"
}
{
  "is_active": ""           // 空字符串 → false
}
4.3.5 Object vs Nested
Object类型:
默认的嵌套对象类型,ES会将其扁平化存储。
json
// Mapping
{
  "user": {
    "type": "object",
    "properties": {
      "name": {"type": "keyword"},
      "age": {"type": "integer"}
    }
  }
}

// 写入文档
POST /users/_doc/1
{
  "user": {
    "name": "Alice",
    "age": 25
  }
}

// ES实际存储(扁平化)
{
  "user.name": "Alice",
  "user.age": 25
}Object的问题:
对于对象数组,会丢失数组元素之间的关联:
json
// 写入文档
POST /orders/_doc/1
{
  "order_id": "001",
  "items": [
    {"name": "iPhone", "price": 7999},
    {"name": "AirPods", "price": 1299}
  ]
}

// ES扁平化存储
{
  "items.name": ["iPhone", "AirPods"],
  "items.price": [7999, 1299]
}

// 问题:无法关联name和price
GET /orders/_search
{
  "query": {
    "bool": {
      "must": [
        {"term": {"items.name": "iPhone"}},
        {"term": {"items.price": 1299}}  // 错误匹配!
      ]
    }
  }
}
// 上述查询会错误地匹配到文档(iPhone的价格是7999,不是1299)Nested类型:
保持对象数组元素的独立性。
json
// Mapping
PUT /orders
{
  "mappings": {
    "properties": {
      "order_id": {"type": "keyword"},
      "items": {
        "type": "nested",
        "properties": {
          "name": {"type": "keyword"},
          "price": {"type": "double"}
        }
      }
    }
  }
}

// 写入文档(同上)

// ES存储:items作为独立的隐藏文档存储
// Hidden Doc 1: {name: "iPhone", price: 7999}
// Hidden Doc 2: {name: "AirPods", price: 1299}

// Nested查询
GET /orders/_search
{
  "query": {
    "nested": {
      "path": "items",
      "query": {
        "bool": {
          "must": [
            {"term": {"items.name": "iPhone"}},
            {"term": {"items.price": 7999}}
          ]
        }
      }
    }
  }
}
// 正确匹配Nested聚合:
json
GET /orders/_search
{
  "size": 0,
  "aggs": {
    "items_agg": {
      "nested": {
        "path": "items"
      },
      "aggs": {
        "popular_products": {
          "terms": {
            "field": "items.name"
          }
        }
      }
    }
  }
}
Object vs Nested选择:
使用Object:
- 单个嵌套对象(非数组)
- 不需要独立查询嵌套对象
- 性能优先

使用Nested:
- 对象数组,需要保持元素关联
- 需要独立查询/聚合嵌套对象
- 准确性优先
4.4 Mapping参数详解
4.4.1 analyzer(分词器)
指定text字段使用的分词器。
json
{
  "description": {
    "type": "text",
    "analyzer": "ik_smart",      // 索引时使用
    "search_analyzer": "ik_smart" // 查询时使用
  }
}常用分词器:
| 分词器 | 说明 | 示例 |
|---|---|---|
standard |
默认分词器,按词分割 | "Hello World" → hello, world |
ik_smart |
IK智能分词,粗粒度 | "中华人民共和国" → 中华人民共和国 |
ik_max_word |
IK最细粒度分词 | "中华人民共和国" → 中华人民共和国, 中华人民, 中华, 华人, 人民共和国, 人民, 共和国, 共和, 国 |
whitespace |
按空格分词 | "Hello World" → Hello, World |
keyword |
不分词 | "Hello World" → Hello World |
4.4.2 doc_values
列式存储,用于聚合、排序、脚本访问字段值。
json
{
  "status": {
    "type": "keyword",
    "doc_values": true  // 默认开启
  }
}特点:
- 使用mmap,不占用JVM堆内存
- 支持聚合、排序
- text类型不支持doc_values
优化建议:
json
// 不需要聚合/排序的字段,可以关闭doc_values节省磁盘
{
  "description": {
    "type": "text",
    "doc_values": false  // text默认false
  },
  "internal_id": {
    "type": "keyword",
    "index": false,       // 不需要搜索
    "doc_values": false   // 不需要聚合,关闭节省空间
  }
}
4.4.3 index
控制字段是否被索引(是否可搜索)。
json
{
  "secret_token": {
    "type": "keyword",
    "index": false  // 不索引,无法搜索,但存储在_source中
  }
}

// 查询会报错
GET /users/_search
{
  "query": {
    "term": {
      "secret_token": "abc123"  // 报错:字段未索引
    }
  }
}使用场景:
不需要搜索的字段:
- 日志详情(只需要查看,不需要搜索)
- 内部标识(只用于返回,不用于查询)
4.4.4 store
是否独立存储字段值。
json
{
  "title": {
    "type": "text",
    "store": true  // 独立存储
  }
}默认行为:
- 所有字段存储在
_source中 store: true会额外独立存储字段值
使用场景:
json
// 场景:_source包含大字段(如content),但只需要返回title
PUT /articles
{
  "mappings": {
    "_source": {
      "excludes": ["content"]  // _source中排除content
    },
    "properties": {
      "title": {
        "type": "text",
        "store": true  // 独立存储title
      },
      "content": {
        "type": "text",
        "store": false  // 不独立存储,也不在_source中
      }
    }
  }
}

// 查询时可以返回title,但无法返回content
GET /articles/_search
{
  "stored_fields": ["title"],
  "query": {
    "match": {
      "content": "elasticsearch"
    }
  }
}
4.4.5 fields(多字段)
一个字段定义多种索引方式。
json
{
  "name": {
    "type": "text",
    "analyzer": "ik_smart",
    "fields": {
      "keyword": {
        "type": "keyword",
        "ignore_above": 256
      },
      "pinyin": {
        "type": "text",
        "analyzer": "pinyin"
      }
    }
  }
}

// 使用场景
// 全文搜索
{"match": {"name": "iPhone"}}

// 精确匹配/聚合
{"term": {"name.keyword": "iPhone 15 Pro"}}

// 拼音搜索
{"match": {"name.pinyin": "pingguo"}}
4.5 Mapping最佳实践
4.5.1 设计原则
1. 生产环境禁用动态映射
json
PUT /products
{
  "mappings": {
    "dynamic": "strict",  // 严格模式
    "properties": {
      // 明确定义所有字段
    }
  }
}
2. 合理选择字段类型
决策树:

需要全文搜索?
  ├─ 是 → text (指定合适的分词器)
  └─ 否 → 继续判断
         ├─ 需要精确匹配/聚合/排序?
         │    └─ 是 → keyword
         ├─ 数值类型?
         │    └─ 是 → 选择合适的numeric类型
         ├─ 日期类型?
         │    └─ 是 → date
         └─ 布尔类型?
              └─ 是 → boolean
3. 对象数组使用Nested
json
// ✅ 正确
{
  "items": {
    "type": "nested",
    "properties": {
      "name": {"type": "keyword"},
      "price": {"type": "double"}
    }
  }
}

// ❌ 错误:使用Object会丢失关联
{
  "items": {
    "properties": {
      "name": {"type": "keyword"},
      "price": {"type": "double"}
    }
  }
}
4. 禁用不必要的功能
json
{
  "internal_id": {
    "type": "keyword",
    "index": false,      // 不需要搜索
    "doc_values": false  // 不需要聚合
  },
  "description": {
    "type": "text",
    "norms": false  // 不需要评分,禁用norms节省空间
  }
}
4.5.2 性能优化
1. 控制字段数量
建议:单个索引字段数 < 1000
原因:字段过多会增加集群状态大小,影响性能
2. 使用_source过滤
json
PUT /logs
{
  "mappings": {
    "_source": {
      "includes": ["timestamp", "level", "message"],
      "excludes": ["raw_data"]  // 排除大字段
    }
  }
}
3. 冷热数据分离
热数据:近期数据,使用SSD,副本多
冷数据:历史数据,使用HDD,副本少
4.5.3 Mapping变更
Mapping限制:
✅ 可以新增字段
❌ 不能修改已有字段类型
❌ 不能删除字段Reindex流程:
json
// 1. 创建新索引(修改后的mapping)
PUT /products_v2
{
  "mappings": {
    "properties": {
      "status": {
        "type": "keyword"  // 修改类型
      }
    }
  }
}

// 2. 数据迁移
POST /_reindex
{
  "source": {
    "index": "products"
  },
  "dest": {
    "index": "products_v2"
  }
}

// 3. 使用别名切换
POST /_aliases
{
  "actions": [
    {"remove": {"index": "products", "alias": "products_alias"}},
    {"add": {"index": "products_v2", "alias": "products_alias"}}
  ]
}

// 4. 应用层使用别名访问
// 无需修改代码,自动切换到新索引别名的好处:
应用层代码 → products_alias(别名)
                   ↓
            products_v2(实际索引)

- 透明切换,不影响业务
- 支持零停机升级
- 可以回滚(切换回旧索引)
小结
本章详细介绍了Elasticsearch的Mapping设计:
- Mapping定义:相当于数据库表结构,定义字段类型和属性
- 动态 vs 静态:生产环境必须使用静态映射(dynamic=strict)
- 核心字段类型 :
- Text vs Keyword(最重要的区别)
- Numeric类型选择(byte/short/integer/long/float/double/scaled_float)
- Date、Boolean、Object、Nested类型
- Mapping参数:analyzer、doc_values、index、store、fields
- 最佳实践 :
- 禁用动态映射
- 合理选择字段类型
- 禁用不必要的功能
- 使用Reindex变更Mapping
理解Mapping设计是掌握Elasticsearch的关键,合理的Mapping设计可以显著提升查询性能和存储效率。
第五章:生产实战与性能优化
在实际的生产环境中,Elasticsearch不仅要满足功能需求,还要应对各种性能挑战和异常场景。本章将深入探讨ES在生产环境中的常见问题、性能优化策略、集群规划以及运维最佳实践。
5.1 查询性能优化实战
5.1.1 使用Filter Context优化查询
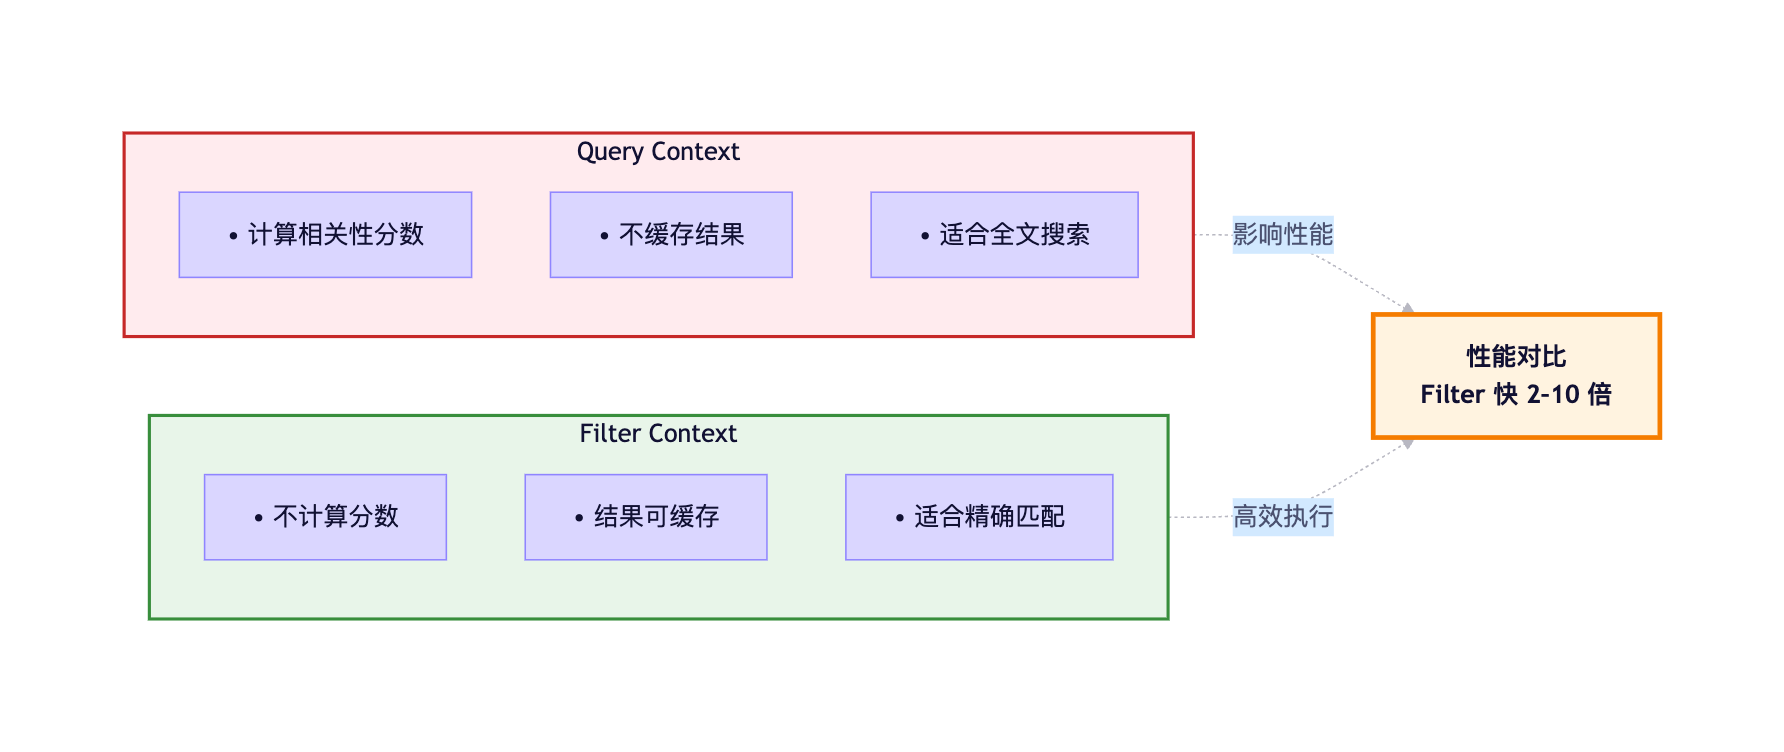
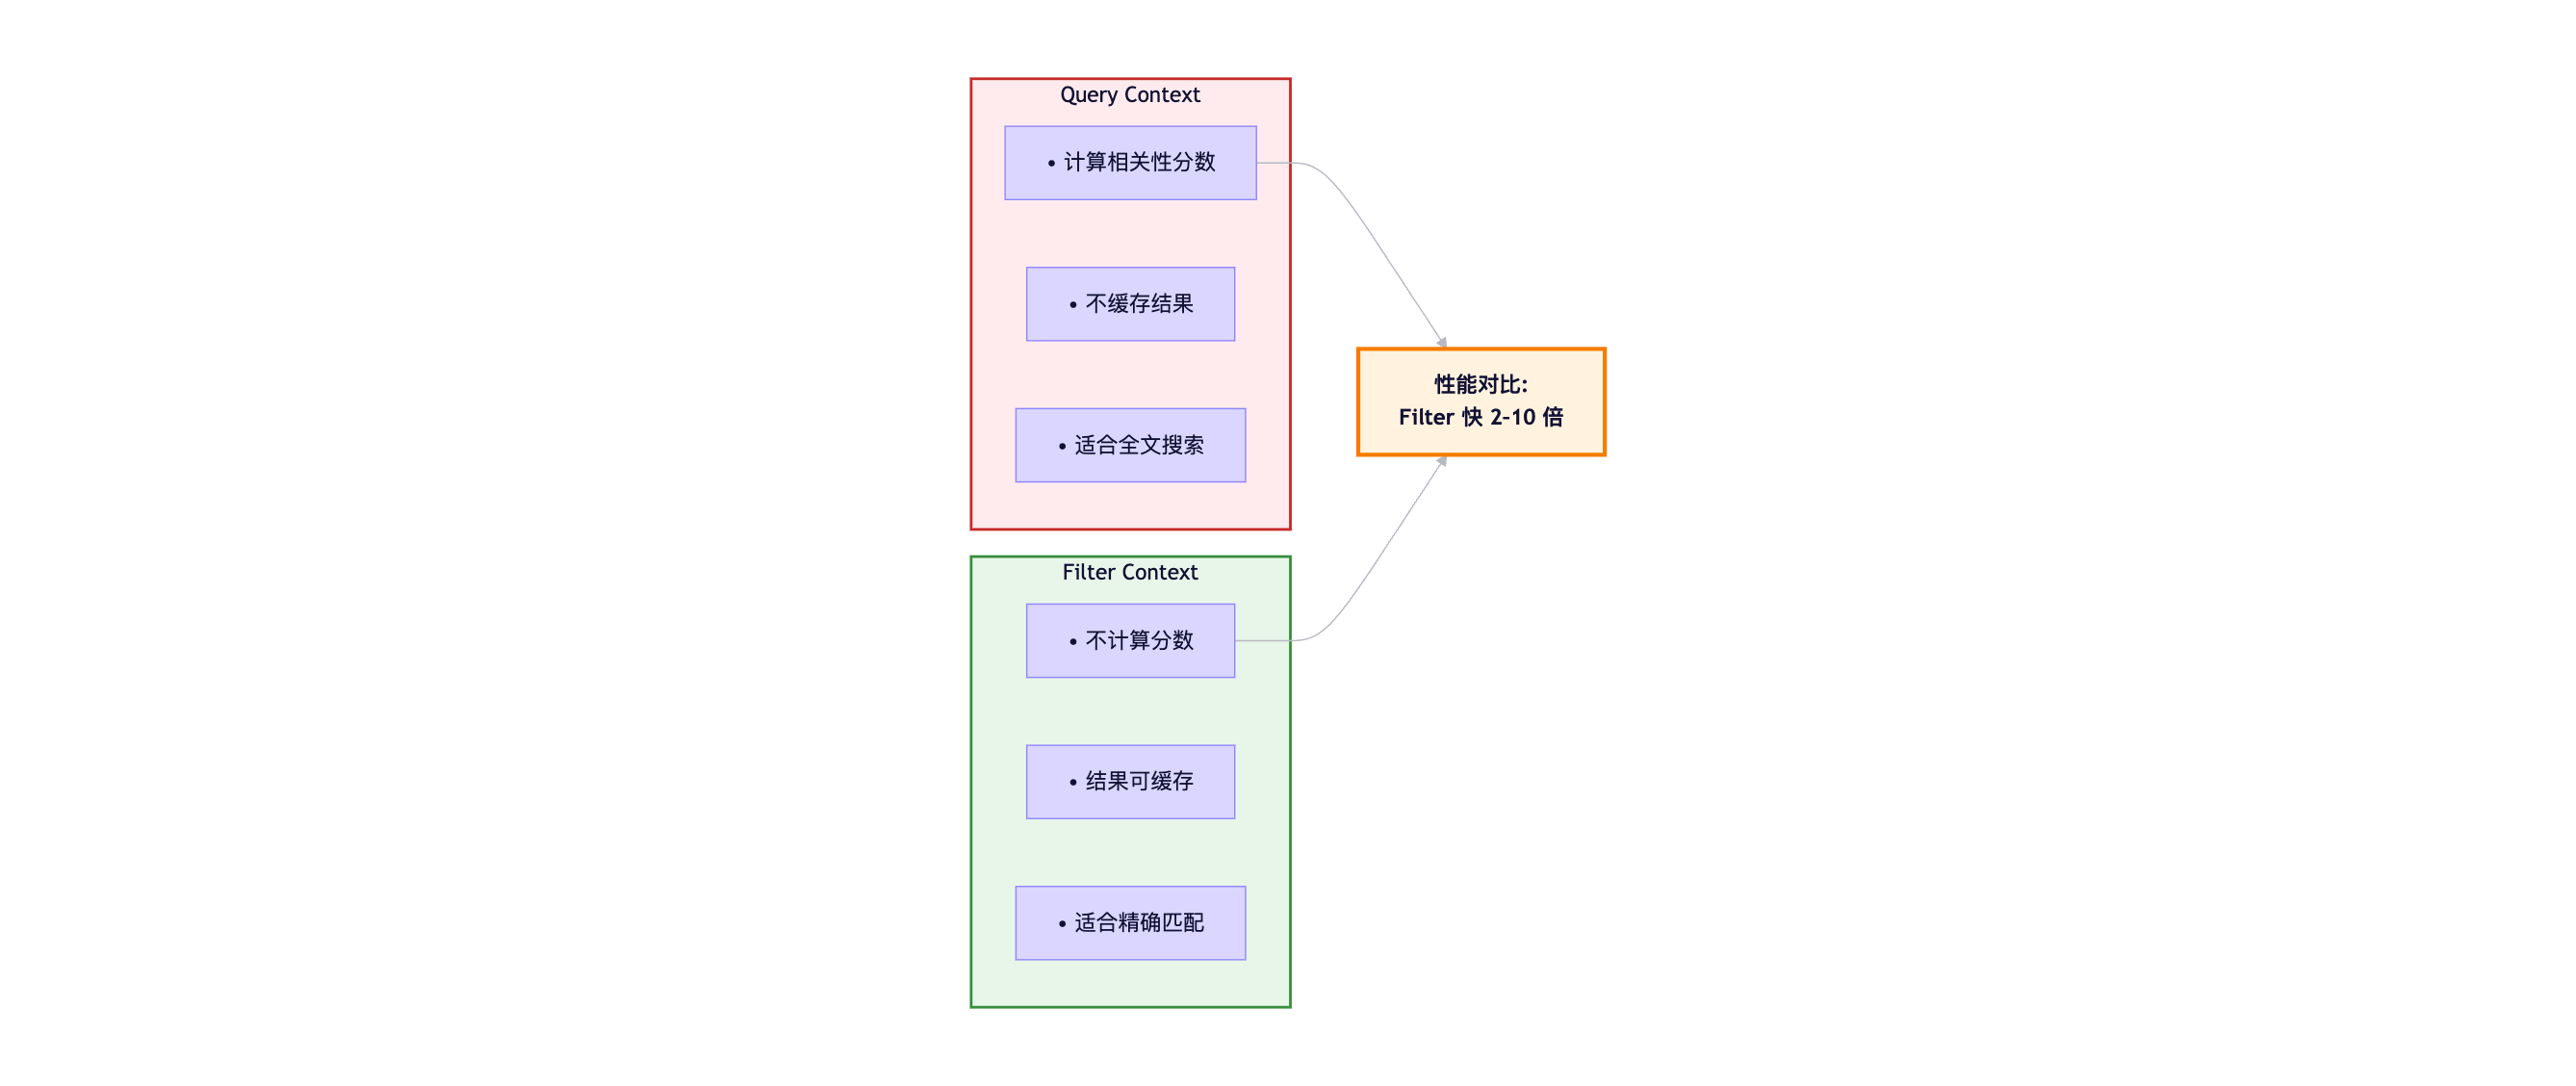
在ES中,查询分为两种上下文:Query Context (查询上下文)和Filter Context(过滤上下文)。
两者的核心区别 :
错误示例(全部使用Query Context):
json
GET /products/_search
{
  "query": {
    "bool": {
      "must": [
        { "match": { "name": "iPhone" } },        // 需要计算分数
        { "term": { "status": "available" } },    // 不需要分数
        { "range": { "price": { "lte": 5000 } } } // 不需要分数
      ]
    }
  }
}正确示例(精确匹配使用Filter):
json
GET /products/_search
{
  "query": {
    "bool": {
      "must": [
        { "match": { "name": "iPhone" } }  // Query上下文,计算分数
      ],
      "filter": [  // Filter上下文,不计算分数,可缓存
        { "term": { "status": "available" } },
        { "range": { "price": { "lte": 5000 } } }
      ]
    }
  }
}性能提升原理:
Query Context执行流程:
1. 倒排索引查找
2. 计算TF-IDF分数
3. 排序
→ 耗时较长,不可缓存

Filter Context执行流程:
1. 倒排索引查找
2. 位图(Bitset)缓存结果
→ 耗时短,可重复利用

性能提升:
单次查询: Filter比Query快30-50%
重复查询: Filter直接命中缓存,快10倍以上
5.1.2 深分页问题与解决方案
问题根源:
使用from + size进行深分页时,ES需要在每个分片上获取from + size条数据,协调节点再进行全局排序。
问题示例:
bash
# 查询第10000页,每页10条
GET /products/_search?from=9990&size=10执行过程:
Client 协调节点 Shard1 Shard2 Shard3 GET from=9990 size=10 请求Top 10000 请求Top 10000 请求Top 10000 par 并行查询所有分片 返回10000条 id+score 返回10000条 id+score 返回10000条 id+score 合并30000条数据 全局排序 取9990-10000 Fetch完整文档 返回10条结果 浪费资源: 处理30000条 仅返回10条 Client 协调节点 Shard1 Shard2 Shard3
性能问题:
from=9990, size=10, 3个分片:
- 每个分片处理: 10000条
- 协调节点合并: 30000条
- 内存占用: 30000 × (8字节ID + 4字节score) = 360KB
- 最终返回: 10条

from=99990, size=10:
- 协调节点合并: 300000条
- 内存占用: 3.6MB
- 性能极差,响应时间秒级

默认限制: index.max_result_window = 10000
解决方案1:Search After(推荐)
适用于实时滚动查询 、下一页场景。
json
// 第一次查询
GET /products/_search
{
  "size": 10,
  "query": {
    "match": { "category": "电子产品" }
  },
  "sort": [
    { "price": "asc" },
    { "_id": "asc" }  // 确保排序唯一性
  ]
}

// 响应示例
{
  "hits": {
    "hits": [
      {
        "_id": "1001",
        "_source": {...},
        "sort": [999, "1001"]  // 最后一条的sort值
      }
    ]
  }
}

// 第二次查询(下一页)
GET /products/_search
{
  "size": 10,
  "query": {
    "match": { "category": "电子产品" }
  },
  "sort": [
    { "price": "asc" },
    { "_id": "asc" }
  ],
  "search_after": [999, "1001"]  // 使用上一页最后一条的sort值
}
Search After执行流程:
Client ES 第1页查询 size=10, sort=price, _id 返回10条 + sort值999, "1001" 第2页查询 search_after=999, "1001" 跳过所有price≤999的文档 直接返回后10条 返回10条 + sort值1099, "1015" 第3页查询 search_after=1099, "1015" 返回10条... Client ES
优势:
✅ 性能好: 每个分片只需返回size条数据
✅ 无窗口限制: 可以查询任意深度
✅ 近实时: 数据始终是最新的
❌ 不支持随机跳页: 必须顺序翻页
解决方案2:Scroll API(大数据导出)
适用于批量导出 、离线处理场景。
json
// 创建游标(第一次查询)
POST /products/_search?scroll=5m
{
  "size": 1000,
  "query": {
    "match_all": {}
  }
}

// 响应
{
  "_scroll_id": "DXF1ZXJ5QW5kRmV0Y2gBAAAAAAAAAD4...",
  "hits": {
    "total": {"value": 100000},
    "hits": [...]  // 1000条数据
  }
}

// 继续滚动
POST /_search/scroll
{
  "scroll": "5m",
  "scroll_id": "DXF1ZXJ5QW5kRmV0Y2gBAAAAAAAAAD4..."
}

// 关闭游标(释放资源)
DELETE /_search/scroll
{
  "scroll_id": "DXF1ZXJ5QW5kRmV0Y2gBAAAAAAAAAD4..."
}Scroll特点:
✅ 创建快照: 保证数据一致性
✅ 性能好: 每次只返回一批数据
✅ 适合大数据导出

❌ 非实时: 快照时间点的数据
❌ 占用资源: 维护快照上下文
❌ 不适合实时查询方案对比:
| 特性 | from+size | Search After | Scroll API |
|---|---|---|---|
| 适用场景 | 浅分页(<10000) | 实时滚动查询 | 大数据导出 |
| 性能 | 深度↑性能↓ | 优秀 | 优秀 |
| 数据一致性 | 实时 | 实时 | 快照(非实时) |
| 随机跳页 | ✅ | ❌ | ❌ |
| 窗口限制 | ✅ (10000) | ❌ | ❌ |
| 资源占用 | 高 | 低 | 中 |
5.1.3 控制返回字段
问题 :返回完整的_source会浪费网络带宽和序列化开销。
优化方案:
json
// ❌ 返回所有字段(默认)
GET /products/_search
{
  "query": {...}
}

// ✅ 只返回需要的字段
GET /products/_search
{
  "_source": ["name", "price", "image_url"],
  "query": {...}
}

// ✅ 排除大字段
GET /products/_search
{
  "_source": {
    "excludes": ["description", "specs", "reviews"]
  },
  "query": {...}
}

// ✅ 不返回_source(只需要ID和score)
GET /products/_search
{
  "_source": false,
  "query": {...}
}性能提升:
完整_source: 10KB/文档 × 1000条 = 10MB
过滤后: 1KB/文档 × 1000条 = 1MB
网络传输: 减少90%
序列化时间: 减少80%
5.1.4 合理设置分片数量
分片规划原则:
单个分片大小: 20GB - 50GB (推荐)
分片数量 = 数据总量 / 单分片大小

示例:
预计数据量: 300GB
单分片大小: 30GB
分片数量: 300GB / 30GB = 10个主分片
考虑扩展: 10 × 1.2 = 12个主分片(推荐)
分片过多的问题 :
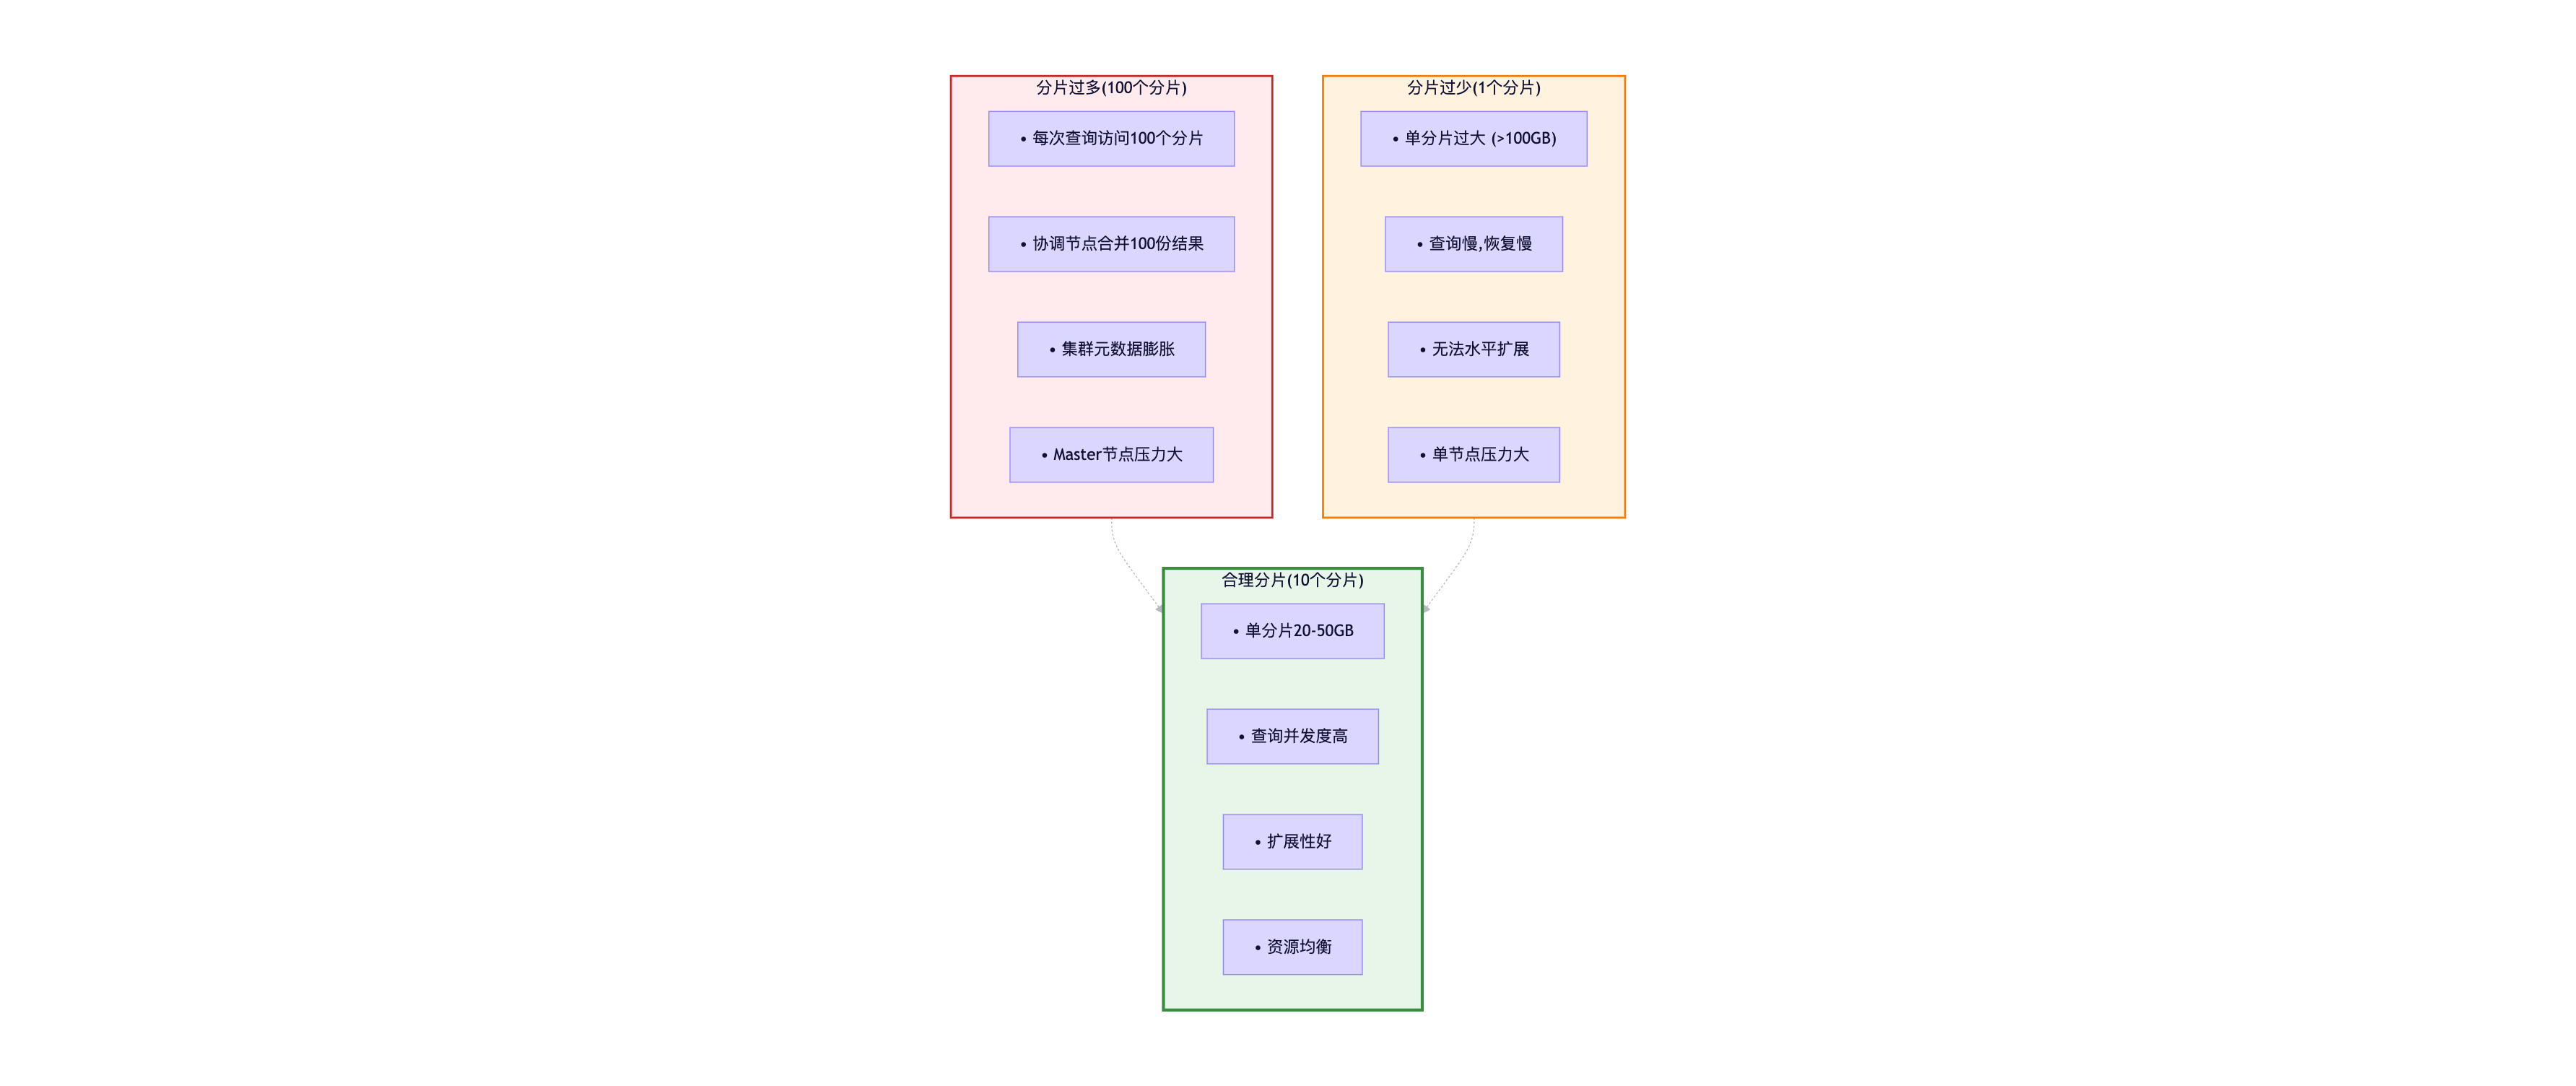
分片数量建议:
| 索引规模 | 主分片数 | 副本数 | 说明 |
|---|---|---|---|
| <10GB | 1 | 1 | 小索引,单分片即可 |
| 10GB-100GB | 3-5 | 1-2 | 中等索引 |
| 100GB-1TB | 10-20 | 1-2 | 大索引 |
| >1TB | 按20-50GB/分片计算 | 1-2 | 超大索引 |
5.2 写入性能优化
5.2.1 批量写入(Bulk API)
单条写入 vs 批量写入:
json
// ❌ 单条写入(低效)
for (Document doc : documents) {
    POST /index/_doc
    {
      "name": "...",
      "value": "..."
    }
}
// 1000条数据 = 1000次HTTP请求 = 网络开销大

// ✅ 批量写入(推荐)
POST /_bulk
{ "index": { "_index": "products", "_id": "1" } }
{ "name": "iPhone 15", "price": 7999 }
{ "index": { "_index": "products", "_id": "2" } }
{ "name": "iPad Pro", "price": 6799 }
...
// 1000条数据 = 1次HTTP请求 = 网络开销小性能对比:
单条写入:
1000条文档 × 10ms(网络+处理) = 10秒

批量写入(100条/批):
10批 × 50ms = 0.5秒

性能提升: 20倍Java实战示例:
java
@Service
public class ProductService {
    @Autowired
    private RestHighLevelClient client;

    public void bulkIndex(List<Product> products) throws IOException {
        BulkRequest bulkRequest = new BulkRequest();

        for (Product product : products) {
            IndexRequest indexRequest = new IndexRequest("products")
                .id(product.getId().toString())
                .source(JSON.toJSONString(product), XContentType.JSON);
            bulkRequest.add(indexRequest);

            // 每1000条提交一次
            if (bulkRequest.numberOfActions() >= 1000) {
                executeBulk(bulkRequest);
                bulkRequest = new BulkRequest();
            }
        }

        // 提交剩余数据
        if (bulkRequest.numberOfActions() > 0) {
            executeBulk(bulkRequest);
        }
    }

    private void executeBulk(BulkRequest bulkRequest) throws IOException {
        BulkResponse response = client.bulk(bulkRequest, RequestOptions.DEFAULT);
        if (response.hasFailures()) {
            for (BulkItemResponse item : response.getItems()) {
                if (item.isFailed()) {
                    log.error("Bulk item failed: {}", item.getFailureMessage());
                }
            }
        }
    }
}批量大小建议:
批量大小: 500-1000条/批
批量字节: 5MB-15MB/批

过小: 网络往返多,效率低
过大: 单次请求慢,内存占用高,容易超时

推荐配置:
- 数据量大,文档小: 1000条/批
- 数据量小,文档大: 500条/批
- 根据实际测试调整
5.2.2 调整Refresh Interval
默认行为:ES每1秒执行一次refresh,将内存缓冲区的数据写入Segment。
优化策略:
json
// 场景1: 批量导入(关闭自动refresh)
PUT /products/_settings
{
  "index": {
    "refresh_interval": "-1"  // 禁用自动refresh
  }
}

// 批量写入...

// 写入完成后手动refresh
POST /products/_refresh

// 恢复自动refresh
PUT /products/_settings
{
  "index": {
    "refresh_interval": "1s"
  }
}

// 场景2: 非实时场景(延长refresh间隔)
PUT /logs/_settings
{
  "index": {
    "refresh_interval": "30s"  // 30秒refresh一次
  }
}性能提升:
默认1s refresh:
- 3600次/小时生成Segment
- Segment过多,查询慢
- 写入TPS: 10000/s

refresh_interval=30s:
- 120次/小时生成Segment
- Segment少,查询快
- 写入TPS: 15000/s (提升50%)

refresh_interval=-1(批量导入):
- 0次自动refresh
- 写入TPS: 30000/s (提升200%)
5.2.3 优化Translog设置
Translog作用:保证数据持久化,防止数据丢失。
写入流程:
每1秒 否 Translog达阈值 否 写入请求 写入Translog 写入Memory Buffer Refresh触发? 生成Segment Flush触发? Segment刷盘 清空Translog
优化配置:
json
PUT /products/_settings
{
  "index": {
    "translog": {
      "durability": "async",           // 异步刷盘(性能优先)
      "sync_interval": "30s",          // 30秒同步一次
      "flush_threshold_size": "1gb"    // Translog达1GB时flush
    }
  }
}durability参数对比:
| 参数 | 同步方式 | 性能 | 数据安全性 | 可能丢失数据 |
|---|---|---|---|---|
| request(默认) | 每次请求fsync | 低 | 高 | 0 |
| async | 定期fsync(默认5s) | 高 | 中 | 最多5秒 |
性能对比:
durability=request:
- 写入TPS: 5000/s
- 每次写入都fsync到磁盘
- 数据绝对安全

durability=async:
- 写入TPS: 15000/s (提升3倍)
- 最多丢失5秒数据
- 适合日志、监控等场景
5.2.4 临时禁用副本
优化策略:
json
// 批量导入前: 禁用副本
PUT /products/_settings
{
  "index": {
    "number_of_replicas": 0
  }
}

// 批量写入...

// 写入完成后: 恢复副本
PUT /products/_settings
{
  "index": {
    "number_of_replicas": 1
  }
}性能提升原理:
有副本(1主1副):
- 主分片写入后,需要同步到副本分片
- 等待副本确认
- 写入TPS: 10000/s

无副本(1主0副):
- 只写主分片
- 无需等待副本
- 写入TPS: 20000/s (提升100%)

适用场景:
- 批量导入历史数据
- 索引重建
- 非生产环境测试
5.3 聚合查询优化
5.3.1 使用DocValues
DocValues:列式存储,专为聚合、排序、脚本访问设计。
json
// ✅ 确保聚合字段启用doc_values
PUT /products
{
  "mappings": {
    "properties": {
      "brand": {
        "type": "keyword",
        "doc_values": true  // 默认开启
      },
      "price": {
        "type": "double",
        "doc_values": true
      }
    }
  }
}

// 聚合查询
GET /products/_search
{
  "size": 0,
  "aggs": {
    "brands": {
      "terms": {
        "field": "brand",  // 使用doc_values
        "size": 10
      }
    }
  }
}
DocValues vs Fielddata:
5.3.2 避免在text字段上聚合
错误示例:
json
// ❌ 在text字段上聚合(会报错或结果不符合预期)
GET /products/_search
{
  "aggs": {
    "brands": {
      "terms": {
        "field": "brand"  // brand是text类型,分词后聚合无意义
      }
    }
  }
}正确示例:
json
// ✅ 使用keyword类型或multi-fields
PUT /products
{
  "mappings": {
    "properties": {
      "brand": {
        "type": "text",
        "fields": {
          "keyword": {
            "type": "keyword"
          }
        }
      }
    }
  }
}

// 聚合时使用keyword子字段
GET /products/_search
{
  "aggs": {
    "brands": {
      "terms": {
        "field": "brand.keyword"
      }
    }
  }
}
5.3.3 控制聚合精度
Terms聚合的精度问题:
json
// 问题: 分片聚合结果可能不准确
GET /products/_search
{
  "size": 0,
  "aggs": {
    "brands": {
      "terms": {
        "field": "brand.keyword",
        "size": 10  // 只返回Top 10
      }
    }
  }
}执行流程:
协调节点 Shard1 Shard2 Shard3 请求Top 10品牌 请求Top 10品牌 请求Top 10品牌 返回10个品牌 返回10个品牌 返回10个品牌 合并30个品牌 取Top 10 可能遗漏真正的Top 10 协调节点 Shard1 Shard2 Shard3
优化方案:
json
// 增大shard_size提升准确性
GET /products/_search
{
  "size": 0,
  "aggs": {
    "brands": {
      "terms": {
        "field": "brand.keyword",
        "size": 100,         // 返回Top 100
        "shard_size": 1000   // 每个分片返回Top 1000
      }
    }
  }
}准确性提升:
shard_size = size:
- 准确性: 60-70%
- 可能遗漏真正的高频词

shard_size = size × 10:
- 准确性: 95%+
- 性能开销增加,但结果更准确
5.4 集群规划与容量评估
5.4.1 节点角色划分
推荐的集群架构 :
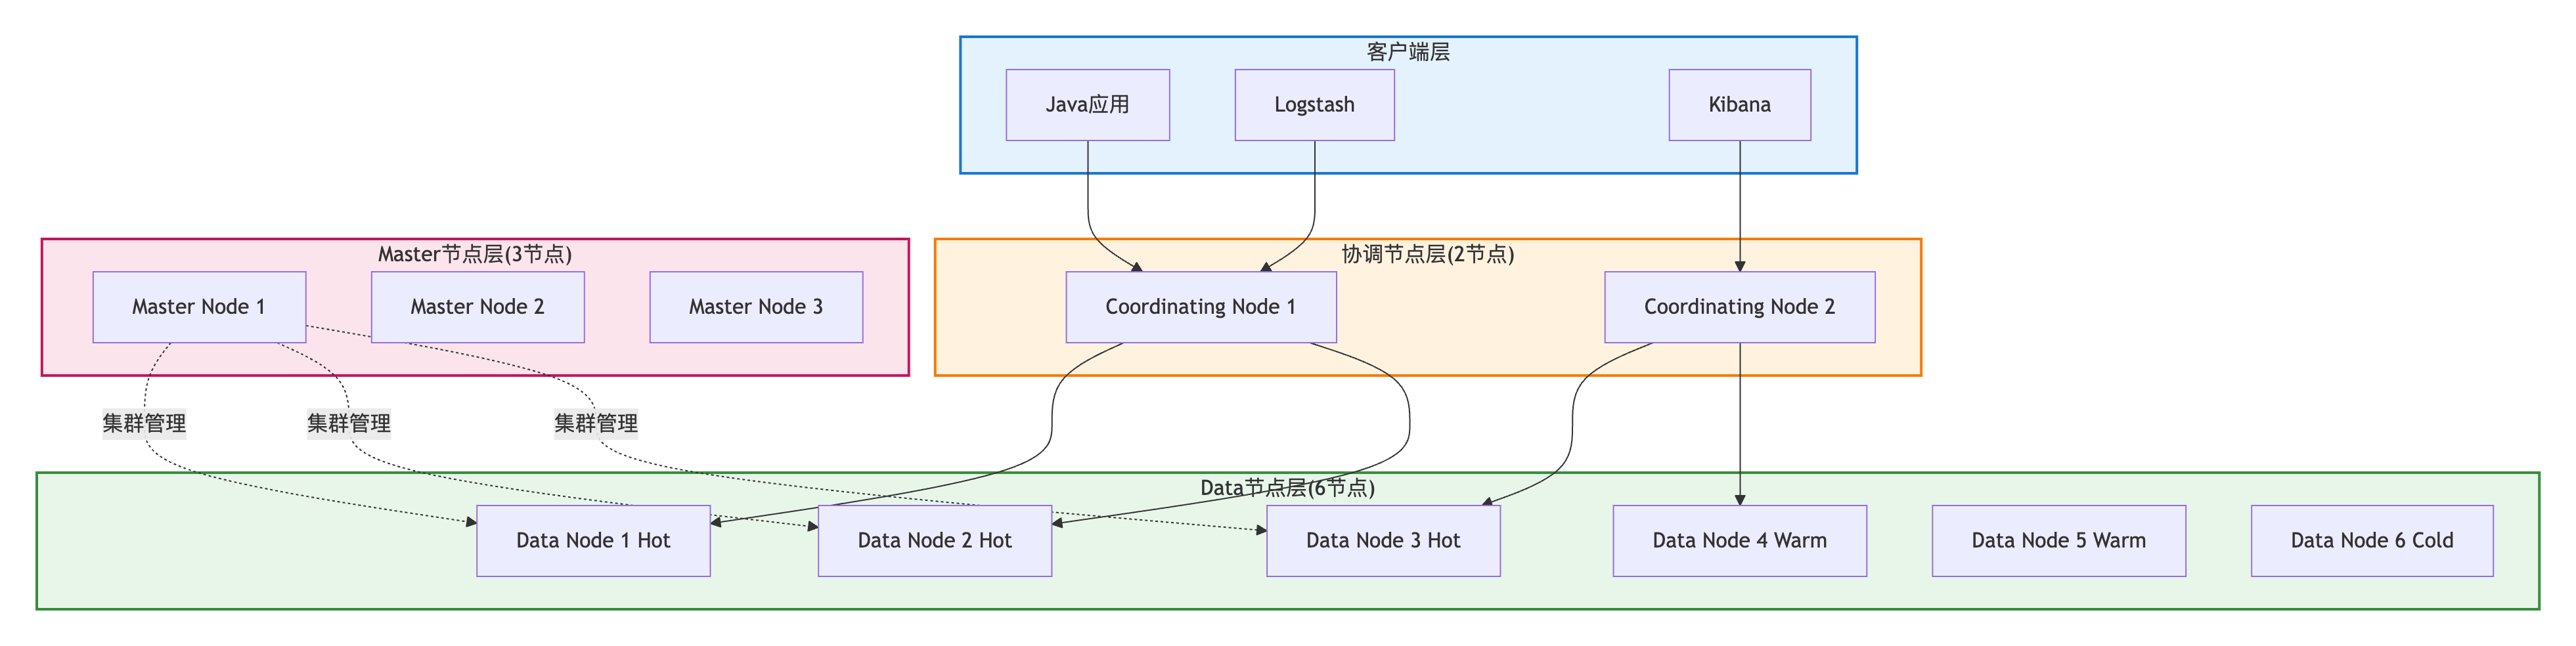
节点配置建议:
| 节点类型 | 配置 | 数量 | 硬件规格 |
|---|---|---|---|
| Master | node.master:true node.data:false | 3(奇数) | 2C 4GB |
| Data(Hot) | node.master:false node.data:true | ≥3 | 8C 32GB SSD |
| Data(Warm) | node.master:false node.data:true | ≥2 | 4C 16GB SSD |
| Data(Cold) | node.master:false node.data:true | ≥1 | 2C 8GB HDD |
| Coordinating | node.master:false node.data:false | ≥2 | 4C 8GB |
5.4.2 容量评估
数据量评估公式:
索引总大小 = 原始数据量 × (1 + 副本数) × 1.25

示例:
原始数据: 100GB
副本数: 1 (1主1副)
索引总大小 = 100GB × (1+1) × 1.25 = 250GB

说明:
- 1.25系数: 预留25%空间(索引开销、Segment合并、Translog等)节点数量评估:
Data节点数 = 索引总大小 / (单节点磁盘容量 × 0.8)

示例:
索引总大小: 1TB
单节点磁盘: 1TB SSD
Data节点数 = 1TB / (1TB × 0.8) ≈ 2个节点

建议: 至少3个Data节点(保证高可用)
JVM Heap大小:
推荐配置:
JVM Heap ≤ 32GB (避免指针压缩失效)
JVM Heap ≤ 物理内存 × 50% (留50%给文件系统缓存)

示例:
物理内存: 64GB
JVM Heap: min(32GB, 64GB × 50%) = 31GB

配置文件(jvm.options):
-Xms31g
-Xmx31g
5.4.3 冷热数据分离
架构设计:

索引生命周期管理(ILM):
json
// 创建ILM策略
PUT _ilm/policy/logs_policy
{
  "policy": {
    "phases": {
      "hot": {
        "min_age": "0ms",
        "actions": {
          "rollover": {
            "max_size": "50GB",
            "max_age": "7d"
          }
        }
      },
      "warm": {
        "min_age": "7d",
        "actions": {
          "allocate": {
            "require": {
              "data": "warm"
            }
          },
          "forcemerge": {
            "max_num_segments": 1
          },
          "shrink": {
            "number_of_shards": 1
          }
        }
      },
      "cold": {
        "min_age": "30d",
        "actions": {
          "allocate": {
            "require": {
              "data": "cold"
            }
          }
        }
      },
      "delete": {
        "min_age": "90d",
        "actions": {
          "delete": {}
        }
      }
    }
  }
}

// 应用ILM策略到索引模板
PUT _index_template/logs_template
{
  "index_patterns": ["logs-*"],
  "template": {
    "settings": {
      "number_of_shards": 3,
      "number_of_replicas": 1,
      "index.lifecycle.name": "logs_policy",
      "index.lifecycle.rollover_alias": "logs"
    }
  }
}成本优化效果:
场景: 1TB日志数据(90天保留)
- 近7天(100GB): Hot节点 × 3 (SSD, 8C 32GB)
- 7-30天(300GB): Warm节点 × 2 (SSD, 4C 16GB)
- 30-90天(600GB): Cold节点 × 1 (HDD, 2C 8GB)

成本对比:
全部Hot: 10台 × $500/月 = $5000/月
冷热分离: 6台 × 平均$300/月 = $1800/月
节省成本: 64%
5.5 监控与告警
5.5.1 核心监控指标
集群级别指标:
bash
# 集群健康状态
GET /_cluster/health

{
  "cluster_name": "es-cluster",
  "status": "green",              // green/yellow/red
  "number_of_nodes": 10,
  "active_primary_shards": 300,
  "active_shards": 600,
  "unassigned_shards": 0          // 应为0
}

# 节点统计
GET /_nodes/stats

{
  "nodes": {
    "node-1": {
      "jvm": {
        "mem": {
          "heap_used_percent": 75    // 应<85%
        }
      },
      "process": {
        "cpu": {
          "percent": 60              // 应<80%
        }
      }
    }
  }
}关键指标及告警阈值:
| 指标 | 说明 | 告警阈值 |
|---|---|---|
| cluster_status | 集群状态 | red(严重), yellow(警告) |
| heap_used_percent | JVM堆使用率 | >85%(警告), >95%(严重) |
| cpu_percent | CPU使用率 | >80%(警告) |
| unassigned_shards | 未分配分片数 | >0 |
| search_query_time_in_millis | 查询耗时 | >1000ms(P99) |
| indexing_index_time_in_millis | 索引耗时 | >500ms(P99) |
5.5.2 慢查询日志
配置慢查询阈值:
json
PUT /products/_settings
{
  "index": {
    "search": {
      "slowlog": {
        "threshold": {
          "query": {
            "warn": "2s",
            "info": "1s",
            "debug": "500ms"
          },
          "fetch": {
            "warn": "1s",
            "info": "500ms"
          }
        }
      }
    },
    "indexing": {
      "slowlog": {
        "threshold": {
          "index": {
            "warn": "2s",
            "info": "1s"
          }
        }
      }
    }
  }
}慢查询日志示例:
[2025-01-22T10:30:15,123][WARN ][index.search.slowlog.query] [node-1]
[products][0] took[2.5s], took_millis[2500],
total_hits[10000],
types[],
search_type[QUERY_THEN_FETCH],
total_shards[5],
source[{"query":{"match":{"name":"iPhone"}}}]
5.6 生产环境最佳实践
5.6.1 配置优化清单
elasticsearch.yml核心配置:
yaml
# 集群配置
cluster.name: es-prod-cluster
node.name: es-node-1

# 节点角色
node.master: true
node.data: true
node.ingest: false

# 网络配置
network.host: 0.0.0.0
http.port: 9200
transport.port: 9300

# 发现配置
discovery.seed_hosts: ["es-node-1", "es-node-2", "es-node-3"]
cluster.initial_master_nodes: ["es-node-1", "es-node-2", "es-node-3"]

# 路径配置
path.data: /data/elasticsearch/data
path.logs: /data/elasticsearch/logs

# 内存配置
bootstrap.memory_lock: true

# 安全配置(X-Pack)
xpack.security.enabled: true
xpack.security.transport.ssl.enabled: trueJVM配置(jvm.options):
# Heap大小(根据实际内存调整,不超过32GB)
-Xms31g
-Xmx31g

# GC配置(推荐G1 GC)
-XX:+UseG1GC
-XX:G1ReservePercent=25
-XX:InitiatingHeapOccupancyPercent=30

# GC日志
-Xlog:gc*,gc+age=trace,safepoint:file=/data/elasticsearch/logs/gc.log:utctime,pid,tags:filecount=32,filesize=64m系统配置(/etc/sysctl.conf):
bash
# 虚拟内存
vm.max_map_count=262144

# 文件句柄
fs.file-max=655360

# 网络
net.core.somaxconn=65535
net.ipv4.tcp_max_syn_backlog=8192
5.6.2 安全加固
启用X-Pack Security:
bash
# 设置内置用户密码
bin/elasticsearch-setup-passwords interactive

# 配置TLS
xpack.security.http.ssl.enabled: true
xpack.security.http.ssl.keystore.path: /path/to/keystore.p12
xpack.security.transport.ssl.enabled: true
xpack.security.transport.ssl.keystore.path: /path/to/keystore.p12配置角色和权限:
json
// 创建只读角色
POST /_security/role/read_only_role
{
  "cluster": ["monitor"],
  "indices": [
    {
      "names": ["products*"],
      "privileges": ["read"]
    }
  ]
}

// 创建用户并分配角色
POST /_security/user/readonly_user
{
  "password": "strong_password",
  "roles": ["read_only_role"]
}
5.6.3 备份与恢复
配置快照仓库:
json
// 创建快照仓库
PUT /_snapshot/backup_repo
{
  "type": "fs",
  "settings": {
    "location": "/data/elasticsearch/backups",
    "compress": true
  }
}

// 创建快照
PUT /_snapshot/backup_repo/snapshot_20250122
{
  "indices": "products,orders",
  "ignore_unavailable": true,
  "include_global_state": false
}

// 恢复快照
POST /_snapshot/backup_repo/snapshot_20250122/_restore
{
  "indices": "products,orders",
  "ignore_unavailable": true,
  "include_global_state": false
}自动快照策略(SLM):
json
PUT /_slm/policy/daily_snapshot
{
  "schedule": "0 1 * * *",    // 每天凌晨1点
  "name": "<daily-snap-{now/d}>",
  "repository": "backup_repo",
  "config": {
    "indices": ["*"],
    "ignore_unavailable": false,
    "include_global_state": false
  },
  "retention": {
    "expire_after": "30d",    // 保留30天
    "min_count": 5,
    "max_count": 50
  }
}
小结
本章深入介绍了Elasticsearch在生产环境中的性能优化和运维实践:
- 查询优化:Filter上下文、深分页优化、控制返回字段、合理分片
- 写入优化:Bulk批量写入、调整Refresh Interval、优化Translog、临时禁用副本
- 聚合优化:使用DocValues、避免text字段聚合、控制聚合精度
- 集群规划:节点角色划分、容量评估、冷热数据分离
- 监控告警:核心指标监控、慢查询日志
- 最佳实践:配置优化、安全加固、备份恢复
这些优化策略和最佳实践,是生产环境稳定运行的重要保障。
第六章:故障排查与问题诊断
在生产环境中,即使精心设计和优化的Elasticsearch集群也难免遇到各种问题。快速准确地定位和解决问题,是保障系统稳定运行的关键能力。本章将系统介绍ES集群常见故障的诊断方法和解决方案。
6.1 集群健康状态异常
6.1.1 集群状态诊断
查看集群健康状态:
bash
GET /_cluster/health

# 响应示例
{
  "cluster_name": "es-prod-cluster",
  "status": "yellow",              # 集群状态:green/yellow/red
  "timed_out": false,
  "number_of_nodes": 10,
  "number_of_data_nodes": 6,
  "active_primary_shards": 300,
  "active_shards": 550,
  "relocating_shards": 0,
  "initializing_shards": 0,
  "unassigned_shards": 50,         # 未分配的分片数
  "delayed_unassigned_shards": 0,
  "number_of_pending_tasks": 0,
  "number_of_in_flight_fetch": 0,
  "task_max_waiting_in_queue_millis": 0,
  "active_shards_percent_as_number": 91.67
}健康状态判断:
| 状态 | 含义 | 影响 | 处理优先级 |
|---|---|---|---|
| Green | 所有主分片和副本分片都正常 | 无影响 | 正常 |
| Yellow | 所有主分片正常,部分副本分片未分配 | 可用性降级,无数据丢失风险 | 中 |
| Red | 部分主分片未分配,数据不完整 | 部分数据不可用 | 高 |
查看索引级别健康状态:
bash
GET /_cluster/health?level=indices

# 查看特定索引
GET /_cluster/health/my-index-*
6.1.2 未分配分片问题诊断
查看未分配分片详情:
bash
GET /_cat/shards?v&h=index,shard,prirep,state,unassigned.reason&s=state

# 输出示例
index       shard prirep state      unassigned.reason
products    0     p      STARTED
products    0     r      UNASSIGNED NODE_LEFT
products    1     p      STARTED
products    1     r      UNASSIGNED ALLOCATION_FAILED
使用Allocation Explain API定位原因:
bash
GET /_cluster/allocation/explain
{
  "index": "products",
  "shard": 0,
  "primary": false
}

# 响应示例
{
  "index": "products",
  "shard": 0,
  "primary": false,
  "current_state": "unassigned",
  "unassigned_info": {
    "reason": "NODE_LEFT",
    "at": "2025-01-22T10:30:00.000Z",
    "details": "node left: es-node-3"
  },
  "can_allocate": "no",
  "allocate_explanation": "cannot allocate because allocation is not permitted to any of the nodes",
  "node_allocation_decisions": [
    {
      "node_id": "es-node-1",
      "node_name": "es-node-1",
      "deciders": [
        {
          "decider": "same_shard",
          "decision": "NO",
          "explanation": "a copy of this shard is already allocated to this node"
        }
      ]
    },
    {
      "node_id": "es-node-2",
      "node_name": "es-node-2",
      "deciders": [
        {
          "decider": "disk_threshold",
          "decision": "NO",
          "explanation": "the node has insufficient disk space: 85% used, required < 85%"
        }
      ]
    }
  ]
}常见未分配原因及解决方案:
| 原因 | 说明 | 解决方案 |
|---|---|---|
| NODE_LEFT | 节点离开集群 | 等待节点恢复或手动分配到其他节点 |
| ALLOCATION_FAILED | 分配失败 | 检查磁盘空间、内存、分片分配策略 |
| INDEX_CREATED | 索引刚创建 | 等待自动分配 |
| CLUSTER_RECOVERED | 集群恢复中 | 等待集群完全恢复 |
| DANGLING_INDEX_IMPORTED | 悬空索引导入 | 删除或恢复索引 |
磁盘空间不足解决方案:
bash
# 1. 查看磁盘使用情况
GET /_cat/allocation?v

# 2. 临时调整磁盘水位线(生产环境不推荐)
PUT /_cluster/settings
{
  "transient": {
    "cluster.routing.allocation.disk.watermark.low": "90%",
    "cluster.routing.allocation.disk.watermark.high": "95%",
    "cluster.routing.allocation.disk.watermark.flood_stage": "97%"
  }
}

# 3. 清理旧数据或扩容磁盘(推荐)
# 删除过期索引
DELETE /old-logs-2024-01-*

# 4. 手动分配分片到有空间的节点
POST /_cluster/reroute
{
  "commands": [
    {
      "allocate_replica": {
        "index": "products",
        "shard": 0,
        "node": "es-node-4"
      }
    }
  ]
}
6.1.3 分片分配策略调整
查看当前分配策略:
bash
GET /_cluster/settings?include_defaults=true&filter_path=*.cluster.routing.*优化分配策略:
bash
PUT /_cluster/settings
{
  "persistent": {
    # 并发恢复数量
    "cluster.routing.allocation.node_concurrent_recoveries": 4,

    # 并发初始化主分片数量
    "cluster.routing.allocation.node_initial_primaries_recoveries": 8,

    # 恢复速度限制(增加带宽)
    "indices.recovery.max_bytes_per_sec": "100mb",

    # 同时恢复的分片数
    "cluster.routing.allocation.cluster_concurrent_rebalance": 4,

    # 允许在同一节点分配相同分片的副本(仅测试环境)
    "cluster.routing.allocation.same_shard.host": false
  }
}
6.1.4 脑裂问题诊断与预防
脑裂现象:
网络分区导致集群分裂成两个独立集群:

Cluster A (3 master-eligible nodes)   Cluster B (2 master-eligible nodes)
├─ master-1 (elected)                  ├─ master-4 (elected)
├─ master-2                            └─ master-5
└─ master-3

结果:两个集群独立接受写入,数据不一致诊断脑裂:
bash
# 查看集群UUID(正常集群所有节点UUID相同)
GET /_cluster/state?filter_path=cluster_uuid

# 查看每个节点的集群信息
GET /_nodes?filter_path=nodes.*.name,nodes.*.cluster_name

# 检查master节点选举日志
grep "elected-as-master" /var/log/elasticsearch/*.log预防脑裂配置:
yaml
# elasticsearch.yml
# 设置最小主节点数(N/2 + 1)
discovery.zen.minimum_master_nodes: 2  # 3个master-eligible节点时设为2

# ES 7.0+ 使用cluster.initial_master_nodes
cluster.initial_master_nodes:
  - master-1
  - master-2
  - master-3

# 节点间通信超时
discovery.zen.ping_timeout: 30s
discovery.zen.fd.ping_timeout: 30s
discovery.zen.fd.ping_interval: 5s脑裂修复流程:
bash
# 1. 停止较小的集群分区的所有节点
systemctl stop elasticsearch

# 2. 清理错误集群的数据(谨慎操作)
rm -rf /var/lib/elasticsearch/nodes/*/indices/*

# 3. 重启节点,加入主集群
systemctl start elasticsearch

# 4. 验证集群恢复
GET /_cluster/health
GET /_cat/nodes?v
6.2 查询性能问题诊断
6.2.1 慢查询识别
配置慢查询日志:
bash
# 索引级别配置
PUT /products/_settings
{
  "index": {
    "search.slowlog.threshold.query.warn": "2s",
    "search.slowlog.threshold.query.info": "1s",
    "search.slowlog.threshold.query.debug": "500ms",
    "search.slowlog.threshold.fetch.warn": "1s",
    "search.slowlog.threshold.fetch.info": "500ms",
    "search.slowlog.level": "info"
  }
}

# 集群级别配置(所有新索引)
PUT /_cluster/settings
{
  "persistent": {
    "logger.index.search.slowlog": "INFO"
  }
}慢查询日志示例:
[2025-01-22T10:30:15,123][WARN ][index.search.slowlog.query] [es-node-1]
[products][0] took[2.5s], took_millis[2500],
total_hits[100000],
types[],
search_type[QUERY_THEN_FETCH],
total_shards[5],
source[{"query":{"bool":{"must":[{"match":{"name":"iPhone"}}],"filter":[{"range":{"price":{"lte":5000}}}]}}}]查看慢查询统计:
bash
GET /_nodes/stats/indices/search?filter_path=nodes.*.indices.search

# 关注以下指标
{
  "nodes": {
    "es-node-1": {
      "indices": {
        "search": {
          "query_total": 1000000,
          "query_time_in_millis": 50000,  # 总查询时间
          "query_current": 10,             # 当前正在执行的查询
          "fetch_total": 500000,
          "fetch_time_in_millis": 10000
        }
      }
    }
  }
}
6.2.2 使用Profile API分析查询性能
Profile API基本使用:
bash
GET /products/_search
{
  "profile": true,
  "query": {
    "bool": {
      "must": [
        { "match": { "name": "iPhone" } }
      ],
      "filter": [
        { "range": { "price": { "lte": 5000 } } }
      ]
    }
  }
}

# 响应包含详细的性能分析
{
  "profile": {
    "shards": [
      {
        "id": "[ABC123][products][0]",
        "searches": [
          {
            "query": [
              {
                "type": "BooleanQuery",
                "description": "+(name:iphone) #ConstantScore(price:[* TO 5000])",
                "time_in_nanos": 12500000,  # 12.5毫秒
                "breakdown": {
                  "match": {
                    "time_in_nanos": 8000000,
                    "build_scorer_count": 1,
                    "create_weight": 100000,
                    "next_doc": 5000000,
                    "score": 2000000,
                    "advance": 0
                  }
                },
                "children": [
                  {
                    "type": "TermQuery",
                    "description": "name:iphone",
                    "time_in_nanos": 8000000
                  },
                  {
                    "type": "ConstantScoreQuery",
                    "description": "ConstantScore(price:[* TO 5000])",
                    "time_in_nanos": 4000000
                  }
                ]
              }
            ],
            "rewrite_time": 50000,
            "collector": [
              {
                "name": "CancellableCollector",
                "reason": "search_cancelled",
                "time_in_nanos": 500000
              }
            ]
          }
        ],
        "aggregations": []
      }
    ]
  }
}Profile结果分析:
关键指标:
1. time_in_nanos: 各阶段耗时(纳秒)
   - create_weight: 创建查询权重
   - build_scorer: 构建打分器
   - next_doc: 遍历文档
   - score: 计算分数
   - advance: 跳跃查询

2. 性能瓶颈识别:
   - next_doc占比 > 60%: 文档过滤效率低,考虑优化查询条件
   - score占比 > 30%: 计算分数开销大,考虑使用filter context
   - build_scorer占比 > 20%: 查询复杂度高,简化查询逻辑
6.2.3 查询优化实战
案例:复杂bool查询优化
bash
# ❌ 优化前:多个must子句计算分数
GET /products/_search
{
  "query": {
    "bool": {
      "must": [
        { "match": { "name": "phone" } },
        { "term": { "status": "available" } },
        { "range": { "price": { "gte": 1000, "lte": 5000 } } },
        { "term": { "brand": "Apple" } }
      ]
    }
  }
}

# Profile结果:
# total_time_in_millis: 250ms
# score计算: 80ms (32%)

# ✅ 优化后:精确匹配使用filter
GET /products/_search
{
  "query": {
    "bool": {
      "must": [
        { "match": { "name": "phone" } }  # 只有这个需要分数
      ],
      "filter": [  # 精确匹配不计算分数
        { "term": { "status": "available" } },
        { "range": { "price": { "gte": 1000, "lte": 5000 } } },
        { "term": { "brand": "Apple" } }
      ]
    }
  }
}

# Profile结果:
# total_time_in_millis: 120ms (提升52%)
# score计算: 15ms (12.5%)
案例:深分页优化
bash
# ❌ 深分页问题
GET /products/_search
{
  "from": 9990,
  "size": 10,
  "query": { "match_all": {} }
}
# 问题:需要排序10000条数据,内存和CPU开销大

# ✅ 使用Search After
# 第一次查询
GET /products/_search
{
  "size": 10,
  "query": { "match_all": {} },
  "sort": [
    { "price": "asc" },
    { "_id": "asc" }
  ]
}

# 响应
{
  "hits": {
    "hits": [
      {
        "_id": "1001",
        "sort": [999, "1001"]  # 最后一条的sort值
      }
    ]
  }
}

# 第二次查询(下一页)
GET /products/_search
{
  "size": 10,
  "query": { "match_all": {} },
  "sort": [
    { "price": "asc" },
    { "_id": "asc" }
  ],
  "search_after": [999, "1001"]  # 使用上一页最后的sort值
}
6.2.4 缓存机制分析
三级缓存体系:
Elasticsearch缓存体系 Hit Miss Hit Miss Node Query Cache
节点级查询缓存
缓存Filter查询结果 查询请求 缓存命中? 返回缓存结果 Shard Request Cache
分片级请求缓存
缓存完整查询结果 缓存命中? Fielddata Cache
字段级数据缓存
用于排序和聚合 执行查询
查看缓存使用情况:
bash
GET /_nodes/stats/indices/query_cache,request_cache,fielddata

{
  "nodes": {
    "es-node-1": {
      "indices": {
        "query_cache": {
          "memory_size_in_bytes": 52428800,  # 50MB
          "total_count": 100000,
          "hit_count": 80000,                # 命中率80%
          "miss_count": 20000,
          "cache_size": 5000,
          "cache_count": 5000,
          "evictions": 100
        },
        "request_cache": {
          "memory_size_in_bytes": 10485760,  # 10MB
          "evictions": 0,
          "hit_count": 5000,
          "miss_count": 1000
        },
        "fielddata": {
          "memory_size_in_bytes": 104857600, # 100MB
          "evictions": 50
        }
      }
    }
  }
}缓存优化配置:
bash
# Node Query Cache配置
PUT /_cluster/settings
{
  "persistent": {
    "indices.queries.cache.size": "10%"  # JVM堆的10%
  }
}

# Request Cache配置(索引级别)
PUT /products/_settings
{
  "index.requests.cache.enable": true
}

# Fielddata Cache配置
PUT /_cluster/settings
{
  "persistent": {
    "indices.fielddata.cache.size": "20%"  # JVM堆的20%
  }
}

# 清理缓存
POST /_cache/clear
POST /products/_cache/clear?query=true&fielddata=true&request=true
6.3 写入性能问题诊断
6.3.1 写入TPS瓶颈识别
计算当前TPS:
bash
# 查看索引统计
GET /_nodes/stats/indices/indexing?filter_path=nodes.*.indices.indexing

{
  "nodes": {
    "es-node-1": {
      "indices": {
        "indexing": {
          "index_total": 10000000,           # 总索引文档数
          "index_time_in_millis": 50000000,  # 总耗时50秒
          "index_current": 50,               # 当前正在索引的文档数
          "index_failed": 100,               # 失败的索引操作
          "delete_total": 1000,
          "delete_time_in_millis": 5000
        }
      }
    }
  }
}

# 计算TPS
TPS = index_total / (index_time_in_millis / 1000)
    = 10000000 / 50000 = 200 TPS

# 平均索引延迟
平均延迟 = index_time_in_millis / index_total
= 50000000 / 10000000 = 5ms/doc查看线程池拒绝情况:
bash
GET /_nodes/stats/thread_pool?filter_path=nodes.*.thread_pool.write

{
  "nodes": {
    "es-node-1": {
      "thread_pool": {
        "write": {
          "threads": 4,
          "queue": 0,
          "active": 2,
          "rejected": 1000,     # 拒绝的任务数(异常指标)
          "largest": 4,
          "completed": 1000000
        }
      }
    }
  }
}拒绝率计算:
拒绝率 = rejected / (completed + rejected)
      = 1000 / (1000000 + 1000)
      = 0.1%

告警阈值:
- 拒绝率 > 1%: 警告
- 拒绝率 > 5%: 严重
6.3.2 Bulk写入优化
批量大小优化:
java
// ❌ 批量过小:网络开销大
for (Document doc : documents) {
    IndexRequest request = new IndexRequest("products")
        .id(doc.getId())
        .source(doc.toJson(), XContentType.JSON);
    client.index(request, RequestOptions.DEFAULT);
}
// 1000个文档 = 1000次HTTP请求

// ✅ 批量适中:500-1000条/批
BulkRequest bulkRequest = new BulkRequest();
for (Document doc : documents) {
    bulkRequest.add(new IndexRequest("products")
        .id(doc.getId())
        .source(doc.toJson(), XContentType.JSON));

    // 每1000条提交一次
    if (bulkRequest.numberOfActions() >= 1000) {
        BulkResponse response = client.bulk(bulkRequest, RequestOptions.DEFAULT);
        if (response.hasFailures()) {
            handleFailures(response);
        }
        bulkRequest = new BulkRequest();
    }
}并发控制优化:
java
// 使用线程池控制并发度
ExecutorService executor = new ThreadPoolExecutor(
    4,                      // 核心线程数
    8,                      // 最大线程数
    60L, TimeUnit.SECONDS,
    new LinkedBlockingQueue<>(100),  // 队列大小
    new ThreadPoolExecutor.CallerRunsPolicy()
);

// 批量任务提交
List<Future<BulkResponse>> futures = new ArrayList<>();
for (List<Document> batch : batches) {
    Future<BulkResponse> future = executor.submit(() -> {
        BulkRequest bulkRequest = new BulkRequest();
        batch.forEach(doc -> bulkRequest.add(
            new IndexRequest("products")
                .id(doc.getId())
                .source(doc.toJson(), XContentType.JSON)
        ));
        return client.bulk(bulkRequest, RequestOptions.DEFAULT);
    });
    futures.add(future);
}

// 等待所有任务完成
for (Future<BulkResponse> future : futures) {
    BulkResponse response = future.get();
    if (response.hasFailures()) {
        handleFailures(response);
    }
}
6.3.3 Refresh策略优化
场景1:实时性要求高(默认配置)
bash
PUT /products/_settings
{
  "index": {
    "refresh_interval": "1s"  # 1秒刷新一次,近实时搜索
  }
}

# TPS影响:约10000/s
场景2:批量导入(临时关闭refresh)
bash
# 导入前:关闭自动refresh
PUT /products/_settings
{
  "index": {
    "refresh_interval": "-1",      # 禁用自动refresh
    "number_of_replicas": 0         # 临时禁用副本
  }
}

# 批量导入数据...

# 导入后:手动refresh
POST /products/_refresh

# 恢复配置
PUT /products/_settings
{
  "index": {
    "refresh_interval": "1s",
    "number_of_replicas": 1
  }
}

# TPS影响:提升200%+(30000/s)
场景3:非实时场景(延长refresh间隔)
bash
PUT /logs/_settings
{
  "index": {
    "refresh_interval": "30s"  # 30秒刷新一次
  }
}

# TPS影响:提升50%(15000/s)
6.3.4 Translog优化
写入流程分析:
durability=request durability=async Translog达阈值 否 写入请求 写入Memory Buffer 写入Translog Translog同步策略 立即fsync到磁盘
性能低,安全性高 异步fsync
每5秒一次
性能高,可能丢失5秒数据 返回响应 定时Refresh
默认1秒 生成Segment
数据可搜索 Flush触发? Segment刷盘
清空Translog
Translog优化配置:
bash
# 场景1:安全性优先(金融场景)
PUT /orders/_settings
{
  "index": {
    "translog": {
      "durability": "request",           # 每次请求都fsync
      "flush_threshold_size": "512mb",   # 默认512MB触发flush
      "sync_interval": "5s"              # 同步间隔
    }
  }
}
# 性能:TPS ~5000/s,数据绝对安全

# 场景2:性能优先(日志场景)
PUT /logs/_settings
{
  "index": {
    "translog": {
      "durability": "async",             # 异步fsync(每5秒)
      "flush_threshold_size": "1gb",     # 增大flush阈值
      "sync_interval": "30s"             # 延长同步间隔
    }
  }
}
# 性能:TPS ~20000/s,可能丢失30秒数据监控Translog大小:
bash
GET /_cat/indices?v&h=index,store.size,translog.size,translog.operations

# 输出示例
index     store.size translog.size translog.operations
products  10gb       500mb         1000000
logs      50gb       2gb           5000000
6.4 内存问题诊断
6.4.1 JVM堆内存监控
查看JVM内存使用情况:
bash
GET /_nodes/stats/jvm?filter_path=nodes.*.jvm.mem

{
  "nodes": {
    "es-node-1": {
      "jvm": {
        "mem": {
          "heap_used_in_bytes": 20971520000,      # 已用堆:20GB
          "heap_used_percent": 65,                # 使用率:65%
          "heap_committed_in_bytes": 32212254720, # 已提交:30GB
          "heap_max_in_bytes": 32212254720,       # 最大堆:30GB
          "non_heap_used_in_bytes": 104857600,
          "pools": {
            "young": {
              "used_in_bytes": 5368709120,        # 年轻代:5GB
              "max_in_bytes": 10737418240,
              "peak_used_in_bytes": 10737418240
            },
            "old": {
              "used_in_bytes": 15602810880,       # 老年代:15GB
              "max_in_bytes": 21474836480,
              "peak_used_in_bytes": 20971520000
            }
          }
        }
      }
    }
  }
}GC监控:
bash
GET /_nodes/stats/jvm?filter_path=nodes.*.jvm.gc

{
  "nodes": {
    "es-node-1": {
      "jvm": {
        "gc": {
          "collectors": {
            "young": {
              "collection_count": 1000,
              "collection_time_in_millis": 5000   # Young GC总耗时:5秒
            },
            "old": {
              "collection_count": 10,
              "collection_time_in_millis": 50000  # Full GC总耗时:50秒
            }
          }
        }
      }
    }
  }
}GC问题诊断:
告警阈值:
1. heap_used_percent > 85%: 警告
   - 原因: 内存压力大,可能触发Full GC
   - 处理: 检查fielddata、查询缓存使用情况

2. heap_used_percent > 95%: 严重
   - 原因: 即将OOM
   - 处理: 立即清理缓存或增加堆内存

3. Full GC频率 > 1次/分钟: 严重
   - 原因: 老年代内存不足,频繁GC
   - 处理: 增加堆内存或优化查询

4. Full GC耗时 > 10秒: 严重
   - 原因: 老年代对象过多
   - 处理: 减少fielddata使用,优化聚合查询
6.4.2 Circuit Breaker熔断机制
Circuit Breaker原理:
Elasticsearch通过熔断器防止内存溢出:

Request Breaker (请求熔断器)
├─ 限制单个请求的内存使用
└─ 默认阈值: JVM堆的60%

Fielddata Breaker (字段数据熔断器)
├─ 限制fielddata缓存大小
└─ 默认阈值: JVM堆的40%

In-flight Request Breaker (飞行中请求熔断器)
├─ 限制所有活动请求的内存
└─ 默认阈值: JVM堆的100%

Parent Breaker (父熔断器)
├─ 限制所有熔断器的总内存
└─ 默认阈值: JVM堆的95%查看熔断器状态:
bash
GET /_nodes/stats/breaker

{
  "nodes": {
    "es-node-1": {
      "breakers": {
        "request": {
          "limit_size_in_bytes": 19327352832,   # 限制:18GB
          "estimated_size_in_bytes": 0,
          "overhead": 1.0,
          "tripped": 0                          # 熔断次数(应为0)
        },
        "fielddata": {
          "limit_size_in_bytes": 12884901888,   # 限制:12GB
          "estimated_size_in_bytes": 1073741824, # 当前使用:1GB
          "overhead": 1.03,
          "tripped": 5                          # 熔断5次(需关注)
        },
        "in_flight_requests": {
          "limit_size_in_bytes": 32212254720,
          "estimated_size_in_bytes": 0,
          "overhead": 2.0,
          "tripped": 0
        },
        "parent": {
          "limit_size_in_bytes": 30601842073,   # 父熔断器:95%
          "estimated_size_in_bytes": 10737418240,
          "overhead": 1.0,
          "tripped": 0
        }
      }
    }
  }
}熔断问题处理:
bash
# 问题:fielddata熔断次数过多
# 原因:对text字段进行排序或聚合

# 解决方案1:调整熔断器阈值(临时方案)
PUT /_cluster/settings
{
  "persistent": {
    "indices.breaker.fielddata.limit": "50%"  # 增加到50%
  }
}

# 解决方案2:使用DocValues(推荐)
PUT /products
{
  "mappings": {
    "properties": {
      "name": {
        "type": "text",
        "fields": {
          "keyword": {
            "type": "keyword",
            "doc_values": true  # 使用doc_values替代fielddata
          }
        }
      }
    }
  }
}

# 查询时使用keyword子字段
GET /products/_search
{
  "aggs": {
    "popular_products": {
      "terms": {
        "field": "name.keyword",  # 使用keyword,不触发fielddata
        "size": 10
      }
    }
  }
}
6.4.3 Fielddata vs DocValues
对比:
| 特性 | Fielddata | DocValues |
|---|---|---|
| 适用字段 | text | keyword, numeric, date |
| 内存位置 | JVM Heap | Off-Heap (mmap) |
| 加载时机 | 首次聚合时加载 | 索引时构建 |
| 内存占用 | 高(占用堆内存) | 低(不占堆) |
| 性能 | 首次加载慢,后续快 | 一直稳定 |
| 推荐 | 不推荐 | 推荐 |
Fielddata监控:
bash
GET /_nodes/stats/indices/fielddata?fields=*

{
  "nodes": {
    "es-node-1": {
      "indices": {
        "fielddata": {
          "memory_size_in_bytes": 1073741824,  # 1GB
          "evictions": 100,                    # 驱逐次数
          "fields": {
            "name": {
              "memory_size_in_bytes": 536870912  # name字段:512MB
            },
            "description": {
              "memory_size_in_bytes": 536870912
            }
          }
        }
      }
    }
  }
}清理Fielddata缓存:
bash
# 清理所有索引的fielddata
POST /_cache/clear?fielddata=true

# 清理特定索引
POST /products/_cache/clear?fielddata=true

# 清理特定字段
POST /products/_cache/clear?fielddata=true&fields=name,description
6.4.4 内存泄漏诊断
内存泄漏现象:
1. 堆内存使用率持续增长,不回落
2. Full GC频率增加,但回收效果差
3. 老年代内存占用持续增长
4. 最终导致OOM: java.lang.OutOfMemoryError: Java heap space诊断工具:
bash
# 1. 生成堆转储文件
jmap -dump:live,format=b,file=/tmp/es-heap-dump.hprof <es-pid>

# 2. 使用MAT (Eclipse Memory Analyzer)分析
# 下载: https://www.eclipse.org/mat/

# 3. 查看线程堆栈
jstack <es-pid> > /tmp/es-threads.txt

# 4. 查看GC日志
tail -f /var/log/elasticsearch/gc.log常见内存泄漏原因:
1. Fielddata缓存未清理
   - 对text字段聚合
   - 高基数字段(如用户ID)

2. 查询缓存过大
   - 缓存了大量不常用查询结果

3. Translog过大
   - flush阈值设置过大,Translog积累过多

4. Parent/Child关系
   - 父子文档查询消耗大量内存

5. 滚动查询未关闭
   - Scroll API创建的上下文未释放
6.5 数据丢失问题诊断
6.5.1 常见数据丢失场景
场景1:主分片丢失
问题:主分片所在节点宕机,且无副本分片
结果:该分片数据永久丢失

预防:
1. 设置至少1个副本分片
PUT /products/_settings
{
  "index": {
    "number_of_replicas": 1
  }
}

2. 使用min-replicas-to-write保证写入安全
PUT /products/_settings
{
  "index": {
    "write.wait_for_active_shards": 2  # 至少2个分片(主+副本)确认才返回
  }
}
场景2:异步复制延迟
问题:主节点写入成功,但副本节点未同步完成就宕机
结果:丢失主节点宕机前的部分数据

诊断:
GET /_cat/recovery?v&h=index,shard,type,stage,translog_ops_recovered,translog_ops

# 检查Translog恢复进度
场景3:Translog设置不当
问题:durability=async,节点突然断电
结果:丢失最近5-30秒的数据

配置对比:
# 安全配置(推荐)
PUT /orders/_settings
{
  "index": {
    "translog": {
      "durability": "request",  # 每次请求都fsync
      "sync_interval": "5s"
    }
  }
}

# 性能配置(可能丢数据)
PUT /logs/_settings
{
  "index": {
    "translog": {
      "durability": "async",    # 异步fsync
      "sync_interval": "30s"    # 30秒才fsync一次
    }
  }
}
6.5.2 Translog恢复机制
Translog文件结构:
/var/lib/elasticsearch/nodes/0/indices/<index-uuid>/0/translog/
├── translog-1.tlog      # Translog数据文件
├── translog-1.ckp       # Checkpoint文件
└── translog.ckp # 当前checkpoint恢复流程:
节点重启时:
1. 读取translog.ckp,获取最后一次flush的位置
2. 从checkpoint位置开始重放Translog
3. 恢复所有未flush的操作
4. 完成后删除旧Translog文件手动恢复Translog:
bash
# 查看Translog信息
GET /_cat/recovery?v&h=index,shard,type,stage,translog_ops_recovered,translog_ops_percent

# 如果Translog损坏,可以跳过损坏部分(慎用)
elasticsearch-translog truncate -d /var/lib/elasticsearch/nodes/0/indices/<uuid>/0/translog/
6.5.3 快照与恢复
创建快照仓库:
bash
PUT /_snapshot/backup_repo
{
  "type": "fs",
  "settings": {
    "location": "/mnt/es-backups",
    "compress": true,
    "max_restore_bytes_per_sec": "100mb",
    "max_snapshot_bytes_per_sec": "100mb"
  }
}创建快照:
bash
# 手动创建快照
PUT /_snapshot/backup_repo/snapshot_20250122
{
  "indices": "products,orders",
  "ignore_unavailable": true,
  "include_global_state": false,
  "metadata": {
    "taken_by": "admin",
    "taken_because": "daily backup"
  }
}

# 查看快照进度
GET /_snapshot/backup_repo/snapshot_20250122/_status

# 查看所有快照
GET /_snapshot/backup_repo/_all恢复快照:
bash
# 恢复整个快照
POST /_snapshot/backup_repo/snapshot_20250122/_restore

# 恢复特定索引
POST /_snapshot/backup_repo/snapshot_20250122/_restore
{
  "indices": "products",
  "ignore_unavailable": true,
  "include_global_state": false,
  "rename_pattern": "(.+)",
  "rename_replacement": "restored_$1",
  "index_settings": {
    "index.number_of_replicas": 1
  }
}

# 查看恢复进度
GET /_cat/recovery?v&h=index,shard,type,stage,files_percent,bytes_percent
SLM (Snapshot Lifecycle Management):
bash
PUT /_slm/policy/daily_snapshots
{
  "schedule": "0 1 * * *",           # 每天凌晨1点
  "name": "<daily-snap-{now/d}>",
  "repository": "backup_repo",
  "config": {
    "indices": ["*"],
    "ignore_unavailable": false,
    "include_global_state": false
  },
  "retention": {
    "expire_after": "30d",           # 保留30天
    "min_count": 5,
    "max_count": 50
  }
}

# 查看SLM策略
GET /_slm/policy/daily_snapshots

# 手动执行SLM
POST /_slm/policy/daily_snapshots/_execute
6.5.4 数据一致性验证
校验索引完整性:
bash
# 验证索引
POST /products/_validate/query
{
  "query": {
    "match_all": {}
  }
}

# 强制合并Segment
POST /products/_forcemerge?max_num_segments=1

# 刷新分片
POST /products/_refresh

# 检查分片健康
GET /_cat/shards/products?v&h=index,shard,prirep,state,docs,store数据量对比:
bash
# Elasticsearch数据量
GET /_cat/indices/products?v&h=index,docs.count,store.size

# 对比数据库数据量
SELECT COUNT(*) FROM products;

# 如果数量不一致,检查:
1. 是否有写入失败的数据
2. 是否有删除操作未同步
3. 是否有分片处于red状态
6.6 实战案例分析
案例1:集群Yellow状态 - 副本分片无法分配
问题描述:
生产环境集群突然变为Yellow状态,影响可用性。监控显示有50个副本分片未分配。诊断过程:
bash
# 1. 查看集群健康状态
GET /_cluster/health

{
  "status": "yellow",
  "unassigned_shards": 50
}

# 2. 查看未分配分片详情
GET /_cat/shards?v&h=index,shard,prirep,state,unassigned.reason | grep UNASSIGNED

products    0    r    UNASSIGNED    NODE_LEFT
products    1    r    UNASSIGNED    NODE_LEFT
...

# 3. 使用Allocation Explain API分析
GET /_cluster/allocation/explain
{
  "index": "products",
  "shard": 0,
  "primary": false
}

# 响应显示磁盘空间不足
{
  "node_allocation_decisions": [
    {
      "node_name": "es-node-2",
      "deciders": [
        {
          "decider": "disk_threshold",
          "decision": "NO",
          "explanation": "the node has 88% disk used, threshold is 85%"
        }
      ]
    }
  ]
}

# 4. 查看磁盘使用情况
GET /_cat/allocation?v

shards disk.indices disk.used disk.avail disk.total disk.percent
120 80gb 88gb 12gb 100gb 88解决方案:
bash
# 方案1:清理旧索引(推荐)
DELETE /logs-2024-01-*

# 方案2:临时调整磁盘水位线(应急措施)
PUT /_cluster/settings
{
  "transient": {
    "cluster.routing.allocation.disk.watermark.low": "90%",
    "cluster.routing.allocation.disk.watermark.high": "95%"
  }
}

# 方案3:扩容磁盘(长期方案)
# 增加磁盘容量或添加新节点

# 5. 验证恢复
GET /_cluster/health

{
  "status": "green",
  "unassigned_shards": 0
}总结:
根因:磁盘空间不足,触发磁盘水位线保护
教训:
1. 配置磁盘空间监控,提前预警
2. 定期清理过期索引
3. 使用ILM自动管理索引生命周期
案例2:查询性能突然下降 - 慢查询分析
问题描述:
商品搜索接口响应时间从100ms突增到5秒,影响用户体验。诊断过程:
bash
# 1. 查看慢查询日志
tail -f /var/log/elasticsearch/products_index_search_slowlog.json

{
  "type": "index_search_slowlog",
  "timestamp": "2025-01-22T10:30:00,000Z",
  "level": "WARN",
  "took": "5.2s",
  "total_hits": 500000,
  "source": "{\"query\":{\"bool\":{\"must\":[{\"match\":{\"name\":\"phone\"}},...]}}"
}

# 2. 使用Profile API分析瓶颈
GET /products/_search
{
  "profile": true,
  "query": {
    "bool": {
      "must": [
        { "match": { "name": "phone" } },
        { "match": { "description": "smartphone" } }
      ],
      "filter": [
        { "range": { "price": { "gte": 1000, "lte": 5000 } } }
      ]
    }
  },
  "sort": [
    { "sales": "desc" }
  ],
  "size": 20
}

# Profile结果显示问题
{
  "profile": {
    "shards": [
      {
        "searches": [
          {
            "query": [
              {
                "type": "BooleanQuery",
                "time_in_nanos": 5000000000,  # 5秒
                "breakdown": {
                  "score": 3000000000,         # 计算分数:3秒(60%)
                  "next_doc": 1500000000,      # 遍历文档:1.5秒(30%)
                  "match": 500000000           # 匹配:0.5秒(10%)
                }
              }
            ]
          }
        ]
      }
    ]
  }
}

# 3. 检查索引mapping
GET /products/_mapping

# 发现sales字段是text类型,不支持doc_values
{
  "mappings": {
    "properties": {
      "sales": {
        "type": "text"  # 问题:text不支持排序
      }
    }
  }
}

# 4. 查看fielddata内存使用
GET /_nodes/stats/indices/fielddata

{
  "nodes": {
    "es-node-1": {
      "indices": {
        "fielddata": {
          "memory_size_in_bytes": 5368709120,  # 5GB
          "evictions": 1000                    # 频繁驱逐
        }
      }
    }
  }
}解决方案:
bash
# 方案1:重建索引,修改mapping(推荐)
PUT /products_v2
{
  "mappings": {
    "properties": {
      "name": {
        "type": "text",
        "fields": {
          "keyword": { "type": "keyword" }
        }
      },
      "sales": {
        "type": "long",        # 改为numeric类型
        "doc_values": true
      }
    }
  }
}

# Reindex数据
POST /_reindex
{
  "source": { "index": "products" },
  "dest": { "index": "products_v2" }
}

# 切换别名
POST /_aliases
{
  "actions": [
    { "remove": { "index": "products", "alias": "products_alias" } },
    { "add": { "index": "products_v2", "alias": "products_alias" } }
  ]
}

# 方案2:优化查询(临时方案)
GET /products/_search
{
  "query": {
    "bool": {
      "must": [
        { "match": { "name": "phone" } }  # 只保留必要的分数计算
      ],
      "filter": [  # 其他条件用filter
        { "match": { "description": "smartphone" } },
        { "range": { "price": { "gte": 1000, "lte": 5000 } } }
      ]
    }
  },
  "sort": [
    { "_score": "desc" }  # 使用_score而非sales排序
  ],
  "size": 20
}

# 5. 验证性能
# Profile显示优化后耗时:200ms(提升25倍)总结:
根因:对text类型的sales字段排序,触发fielddata,导致性能下降
教训:
1. 数值型字段必须使用numeric类型
2. 排序字段必须开启doc_values
3. 避免对text字段排序或聚合
4. 使用Profile API定位性能瓶颈
案例3:写入TPS突然下降 - 线程池饱和
问题描述:
批量导入任务TPS从20000/s突降到2000/s,导入时间严重超时。诊断过程:
bash
# 1. 查看线程池状态
GET /_nodes/stats/thread_pool?filter_path=nodes.*.thread_pool.write

{
  "nodes": {
    "es-node-1": {
      "thread_pool": {
        "write": {
          "threads": 4,
          "queue": 10000,           # 队列已满
          "active": 4,              # 线程全部活跃
          "rejected": 50000,        # 大量拒绝
          "largest": 4,
          "completed": 1000000
        }
      }
    }
  }
}

# 拒绝率 = 50000 / 1050000 = 4.76%(严重)

# 2. 查看写入延迟
GET /_nodes/stats/indices/indexing

{
  "nodes": {
    "es-node-1": {
      "indices": {
        "indexing": {
          "index_total": 1000000,
          "index_time_in_millis": 500000000,  # 平均500ms/doc(异常慢)
          "index_current": 10000,             # 当前堆积10000个文档
          "index_failed": 5000
        }
      }
    }
  }
}

# 3. 检查Translog配置
GET /products/_settings?include_defaults=true&filter_path=*.index.translog.*

{
  "products": {
    "settings": {
      "index": {
        "translog": {
          "durability": "request",           # 每次请求都fsync
          "sync_interval": "5s",
          "flush_threshold_size": "512mb"
        }
      }
    }
  }
}

# 4. 检查refresh配置
GET /products/_settings?filter_path=*.index.refresh_interval

{
  "products": {
    "settings": {
      "index": {
        "refresh_interval": "1s"  # 默认1秒刷新
      }
    }
  }
}

# 5. 查看磁盘I/O
iostat -x 1

Device   r/s   w/s   rkB/s   wkB/s   await   %util
sda 100 2000 1024 20480 50.0 95.0 # I/O接近饱和解决方案:
bash
# 方案1:优化Translog配置
PUT /products/_settings
{
  "index": {
    "translog": {
      "durability": "async",             # 改为异步fsync
      "sync_interval": "30s",            # 延长同步间隔
      "flush_threshold_size": "1gb"      # 增大flush阈值
    }
  }
}

# 方案2:临时关闭refresh
PUT /products/_settings
{
  "index": {
    "refresh_interval": "-1",            # 禁用自动refresh
    "number_of_replicas": 0              # 临时禁用副本
  }
}

# 导入完成后手动refresh和恢复副本
POST /products/_refresh
PUT /products/_settings
{
  "index": {
    "refresh_interval": "1s",
    "number_of_replicas": 1
  }
}

# 方案3:增大线程池队列
# 修改elasticsearch.yml(需重启)
thread_pool:
  write:
    queue_size: 10000  # 增大队列(默认200)

# 方案4:控制客户端并发
# Java客户端限流
Semaphore semaphore = new Semaphore(10);  # 最多10个并发bulk请求
try {
    semaphore.acquire();
    client.bulk(bulkRequest, RequestOptions.DEFAULT);
} finally {
    semaphore.release();
}

# 5. 验证效果
GET /_nodes/stats/thread_pool?filter_path=nodes.*.thread_pool.write

{
  "nodes": {
    "es-node-1": {
      "thread_pool": {
        "write": {
          "queue": 100,          # 队列恢复正常
          "rejected": 50010      # 拒绝次数不再增长
        }
      }
    }
  }
}

# TPS恢复到25000/s(提升12.5倍)总结:
根因:
1. Translog同步策略durability=request,每次写入都fsync,磁盘I/O成为瓶颈
2. 默认1秒refresh,频繁生成Segment
3. 客户端并发过高,超过线程池处理能力

教训:
1. 批量导入时临时关闭refresh和副本
2. 非金融场景使用durability=async
3. 客户端实现并发控制和限流
4. 监控线程池rejected指标并告警
6.7 监控与预警体系
6.7.1 核心监控指标
集群级别指标:
| 指标 | 说明 | 告警阈值 |
|---|---|---|
| cluster_status | 集群健康状态 | yellow/red |
| nodes_count | 节点总数 | < 预期值 |
| active_shards_percent | 活跃分片百分比 | < 100% |
| unassigned_shards | 未分配分片数 | > 0 |
| task_max_waiting_in_queue_millis | 任务最大等待时间 | > 10000ms |
节点级别指标:
| 指标 | 说明 | 告警阈值 |
|---|---|---|
| jvm.mem.heap_used_percent | JVM堆使用率 | > 85% (警告), > 95% (严重) |
| jvm.gc.collectors.old.collection_count | Full GC次数 | > 10次/分钟 |
| jvm.gc.collectors.old.collection_time_in_millis | Full GC耗时 | > 10000ms |
| process.cpu.percent | CPU使用率 | > 80% |
| fs.total.available_in_bytes | 磁盘可用空间 | < 15% |
索引级别指标:
| 指标 | 说明 | 告警阈值 |
|---|---|---|
| indexing.index_total | 索引文档总数 | - |
| indexing.index_time_in_millis | 索引总耗时 | - |
| search.query_total | 查询总次数 | - |
| search.query_time_in_millis | 查询总耗时 | - |
| docs.count | 文档数量 | - |
| store.size_in_bytes | 存储大小 | - |
6.7.2 Prometheus + Grafana监控
Elasticsearch Exporter部署:
bash
# 1. 下载elasticsearch_exporter
wget https://github.com/prometheus-community/elasticsearch_exporter/releases/download/v1.5.0/elasticsearch_exporter-1.5.0.linux-amd64.tar.gz
tar -xzf elasticsearch_exporter-1.5.0.linux-amd64.tar.gz
cd elasticsearch_exporter-1.5.0.linux-amd64

# 2. 启动exporter
./elasticsearch_exporter \
  --es.uri=http://localhost:9200 \
  --es.all \
  --es.indices \
  --es.shards \
  --es.timeout=30s \
  --web.listen-address=:9114

# 3. 验证metrics
curl http://localhost:9114/metrics

# 输出示例
elasticsearch_cluster_health_status{cluster="es-prod-cluster"} 1
elasticsearch_cluster_health_number_of_nodes{cluster="es-prod-cluster"} 10
elasticsearch_jvm_memory_used_bytes{area="heap",cluster="es-prod-cluster",name="es-node-1"} 2.097152e+10Prometheus配置:
yaml
# prometheus.yml
global:
  scrape_interval: 15s
  evaluation_interval: 15s

scrape_configs:
  - job_name: 'elasticsearch'
    static_configs:
      - targets:
          - 'es-node-1:9114'
          - 'es-node-2:9114'
          - 'es-node-3:9114'
    relabel_configs:
      - source_labels: [__address__]
        target_label: instance
Grafana Dashboard:
bash
# 导入Elasticsearch官方Dashboard (ID: 2322)
# Grafana UI → Dashboards → Import → 输入ID: 2322

# 或手动创建Panel
# 1. JVM堆使用率
100 * (elasticsearch_jvm_memory_used_bytes{area="heap"} / elasticsearch_jvm_memory_max_bytes{area="heap"})

# 2. 查询QPS
rate(elasticsearch_indices_search_query_total[1m])

# 3. 查询延迟 (P99)
histogram_quantile(0.99, rate(elasticsearch_indices_search_query_time_seconds_bucket[5m]))

# 4. 索引TPS
rate(elasticsearch_indices_indexing_index_total[1m])

# 5. 磁盘使用率
100 * (1 - (elasticsearch_filesystem_data_available_bytes / elasticsearch_filesystem_data_size_bytes))

# 6. 未分配分片数
elasticsearch_cluster_health_unassigned_shards

# 7. 线程池拒绝率
rate(elasticsearch_thread_pool_rejected_count{type="write"}[1m])
6.7.3 告警规则配置
AlertManager配置:
yaml
# alertmanager.yml
global:
  resolve_timeout: 5m

route:
  receiver: 'default'
  group_by: ['alertname', 'cluster', 'severity']
  group_wait: 10s
  group_interval: 10s
  repeat_interval: 12h
  routes:
    - match:
        severity: critical
      receiver: 'critical'
      continue: true
    - match:
        severity: warning
      receiver: 'warning'

receivers:
  - name: 'default'
    webhook_configs:
      - url: 'http://alert-webhook:8080/webhook'

  - name: 'critical'
    email_configs:
      - to: 'ops-team@company.com'
        from: 'alertmanager@company.com'
        smarthost: 'smtp.company.com:587'
        auth_username: 'alertmanager@company.com'
        auth_password: 'password'
        headers:
          Subject: '[CRITICAL] Elasticsearch Alert'
    webhook_configs:
      - url: 'http://alert-webhook:8080/webhook'

  - name: 'warning'
    email_configs:
      - to: 'dev-team@company.com'
        from: 'alertmanager@company.com'
smarthost: 'smtp.company.com:587'Prometheus告警规则:
yaml
# es_alerts.yml
groups:
  - name: elasticsearch_alerts
    interval: 30s
    rules:
      # 集群状态异常
      - alert: ElasticsearchClusterRed
        expr: elasticsearch_cluster_health_status{color="red"} == 1
        for: 1m
        labels:
          severity: critical
        annotations:
          summary: "Elasticsearch cluster {{ $labels.cluster }} is RED"
          description: "Cluster {{ $labels.cluster }} health is RED. Some primary shards are unassigned."

      - alert: ElasticsearchClusterYellow
        expr: elasticsearch_cluster_health_status{color="yellow"} == 1
        for: 5m
        labels:
          severity: warning
        annotations:
          summary: "Elasticsearch cluster {{ $labels.cluster }} is YELLOW"
          description: "Cluster {{ $labels.cluster }} health is YELLOW. Some replica shards are unassigned."

      # JVM堆内存告警
      - alert: ElasticsearchHeapUsageHigh
        expr: 100 * (elasticsearch_jvm_memory_used_bytes{area="heap"} / elasticsearch_jvm_memory_max_bytes{area="heap"}) > 85
        for: 5m
        labels:
          severity: warning
        annotations:
          summary: "Elasticsearch node {{ $labels.name }} heap usage high"
          description: "Heap usage is {{ $value | humanize }}% on node {{ $labels.name }}"

      - alert: ElasticsearchHeapUsageCritical
        expr: 100 * (elasticsearch_jvm_memory_used_bytes{area="heap"} / elasticsearch_jvm_memory_max_bytes{area="heap"}) > 95
        for: 2m
        labels:
          severity: critical
        annotations:
          summary: "Elasticsearch node {{ $labels.name }} heap usage critical"
          description: "Heap usage is {{ $value | humanize }}% on node {{ $labels.name }}. Risk of OOM."

      # Full GC告警
      - alert: ElasticsearchFullGCHigh
        expr: rate(elasticsearch_jvm_gc_collection_seconds_count{gc="old"}[5m]) > 5
        for: 5m
        labels:
          severity: warning
        annotations:
          summary: "Elasticsearch node {{ $labels.name }} Full GC frequency high"
          description: "Full GC frequency is {{ $value | humanize }} per second on node {{ $labels.name }}"

      # 磁盘空间告警
      - alert: ElasticsearchDiskSpaceLow
        expr: 100 * (1 - (elasticsearch_filesystem_data_available_bytes / elasticsearch_filesystem_data_size_bytes)) > 85
        for: 5m
        labels:
          severity: warning
        annotations:
          summary: "Elasticsearch node {{ $labels.name }} disk space low"
          description: "Disk usage is {{ $value | humanize }}% on node {{ $labels.name }}"

      - alert: ElasticsearchDiskSpaceCritical
        expr: 100 * (1 - (elasticsearch_filesystem_data_available_bytes / elasticsearch_filesystem_data_size_bytes)) > 95
        for: 2m
        labels:
          severity: critical
        annotations:
          summary: "Elasticsearch node {{ $labels.name }} disk space critical"
          description: "Disk usage is {{ $value | humanize }}% on node {{ $labels.name }}. Urgent action required."

      # 未分配分片告警
      - alert: ElasticsearchUnassignedShards
        expr: elasticsearch_cluster_health_unassigned_shards > 0
        for: 5m
        labels:
          severity: warning
        annotations:
          summary: "Elasticsearch cluster {{ $labels.cluster }} has unassigned shards"
          description: "Cluster {{ $labels.cluster }} has {{ $value }} unassigned shards."

      # 线程池拒绝告警
      - alert: ElasticsearchThreadPoolRejected
        expr: rate(elasticsearch_thread_pool_rejected_count{type="write"}[5m]) > 1
        for: 2m
        labels:
          severity: warning
        annotations:
          summary: "Elasticsearch node {{ $labels.name }} write thread pool rejections"
          description: "Write thread pool is rejecting {{ $value | humanize }} requests per second on node {{ $labels.name }}"

      # 查询延迟告警
      - alert: ElasticsearchQueryLatencyHigh
        expr: histogram_quantile(0.99, rate(elasticsearch_indices_search_query_time_seconds_bucket[5m])) > 5
        for: 10m
        labels:
          severity: warning
        annotations:
          summary: "Elasticsearch query latency high on cluster {{ $labels.cluster }}"
          description: "P99 query latency is {{ $value | humanize }} seconds."

      # 节点离线告警
      - alert: ElasticsearchNodeMissing
        expr: elasticsearch_cluster_health_number_of_nodes < 10
        for: 2m
        labels:
          severity: critical
        annotations:
          summary: "Elasticsearch node count low in cluster {{ $labels.cluster }}"
description: "Expected 10 nodes, but only {{ $value }} are present."加载告警规则:
bash
# prometheus.yml中引用
rule_files:
  - '/etc/prometheus/rules/es_alerts.yml'

# 重新加载配置
curl -X POST http://localhost:9090/-/reload
全文总结
通过六个章节的深入剖析,我们系统学习了Elasticsearch的核心技术体系:
第一章:核心原理与架构
- 理解了ES高性能的四大支柱:内存存储、单线程模型、I/O多路复用、高效数据结构
- 掌握了全局哈希表的渐进式rehash机制,理解了如何在不阻塞服务的前提下动态扩容
第二章:数据结构与底层实现
- 深入学习了五大基础类型(String/Hash/List/Set/ZSet)的底层编码及转换条件
- 掌握了三大高级类型(HyperLogLog/Bitmap/GEO)的应用场景和实现原理
- 理解了数据类型与底层编码的映射关系,能够根据业务场景选择最优数据结构
第三章:分布式读写流程
- 掌握了分布式写入的完整流程:路由 → Translog → Memory Buffer → 副本复制
- 理解了分布式查询的两阶段机制:Query Phase(轻量级排序) + Fetch Phase(获取文档)
- 学会了深分页优化方案(Search After / Scroll API)和聚合查询优化策略
第四章:Mapping设计
- 掌握了Text vs Keyword的核心区别和使用场景
- 理解了动态映射的风险和静态映射的最佳实践(dynamic=strict)
- 学会了Mapping参数(analyzer、doc_values、index、fields)的合理配置
- 掌握了通过Reindex + Alias实现Mapping变更的零停机升级方案
第五章:生产实战与性能优化
- 学习了查询优化的核心策略:Filter上下文、控制返回字段、合理分片
- 掌握了写入优化的关键技术:Bulk批量写入、Refresh Interval调整、Translog优化
- 理解了集群规划的要点:节点角色划分、容量评估、冷热数据分离
- 学会了监控告警的核心指标和慢查询日志分析方法
第六章:故障排查与问题诊断
- 掌握了集群健康状态诊断和未分配分片问题的解决方案
- 学会了使用Profile API深度分析查询性能瓶颈
- 理解了写入TPS瓶颈的识别和线程池调优方法
- 掌握了JVM堆内存监控、Circuit Breaker熔断机制和Fielddata优化
- 学习了数据丢失预防和Translog恢复机制
- 通过3个生产实战案例,掌握了完整的问题诊断流程
- 建立了Prometheus + Grafana + AlertManager的完整监控预警体系
生产环境最佳实践:
- 集群规划:合理划分节点角色,主节点3个奇数,数据节点根据容量评估,独立部署协调节点
- 索引设计:禁用动态映射(dynamic=strict),合理选择字段类型,单个分片20-50GB
- 查询优化:精确匹配使用Filter,控制返回字段,避免深分页,使用DocValues聚合
- 写入优化:使用Bulk API,批量大小500-1000条,批量导入时临时关闭refresh和副本
- 持久化配置:开启混合持久化(aof-use-rdb-preamble),appendfsync everysec平衡安全性和性能
- 高可用保障:至少1个副本分片,使用Sentinel或Cluster实现自动故障转移
- 监控告警:监控JVM堆(告警阈值85%/95%)、磁盘空间(告警阈值85%/95%)、未分配分片、线程池拒绝率
- 备份恢复:配置SLM自动快照策略,快照保留30天,定期演练恢复流程
故障排查方法论:
- 现象观察:收集错误日志、监控指标、用户反馈
- 问题定位:使用诊断API(_cluster/health、_cluster/allocation/explain、Profile API)
- 根因分析:结合日志、配置、监控数据,确定根本原因
- 制定方案:评估临时方案(应急止损)和长期方案(根治问题)
- 验证效果:执行方案后验证集群状态、性能指标
- 经验总结:记录问题、原因、解决方案,形成知识库
持续优化建议:
- 定期Review慢查询日志,优化高频慢查询
- 监控集群资源使用趋势,提前扩容
- 定期清理过期索引,使用ILM自动管理
- 定期演练故障恢复流程,确保团队熟悉应急操作
- 关注ES官方博客和社区,跟进新版本特性和最佳实践
Elasticsearch作为现代搜索和分析的核心引擎,其强大的功能和灵活的架构为海量数据的实时检索提供了完善的解决方案。通过深入理解其底层原理、掌握最佳实践、建立完善的监控体系,我们能够在生产环境中构建稳定、高效、可扩展的搜索服务。
希望本文能帮助你建立Elasticsearch的系统性认知,在实际项目中游刃有余地运用ES技术,为业务提供卓越的搜索体验。
参考资料
书籍:
- 《Elasticsearch权威指南》(Elasticsearch: The Definitive Guide)- Clinton Gormley, Zachary Tong
- 《Elasticsearch核心技术与实战》- 阮一鸣
- 《深入理解Elasticsearch》- 张世武
官方文档:
- Elasticsearch官方文档: https://www.elastic.co/guide/en/elasticsearch/reference/current/index.html
- Elasticsearch Java Client: https://www.elastic.co/guide/en/elasticsearch/client/java-api-client/current/index.html
- Elasticsearch Performance Tuning: https://www.elastic.co/guide/en/elasticsearch/reference/current/tune-for-search-speed.html
社区资源:
- Elasticsearch中文社区: https://elasticsearch.cn/
- Elastic Stack博客: https://www.elastic.co/cn/blog/
- GitHub Elasticsearch: https://github.com/elastic/elasticsearch
监控工具:
- Elasticsearch Exporter: https://github.com/prometheus-community/elasticsearch_exporter
- Grafana Dashboard for ES: https://grafana.com/grafana/dashboards/2322
- Kibana Monitoring: https://www.elastic.co/guide/en/kibana/current/xpack-monitoring.html
实用工具:
- Cerebro (ES集群管理工具): https://github.com/lmenezes/cerebro
- ElasticHQ: http://www.elastichq.org/
- Curator (索引生命周期管理): https://www.elastic.co/guide/en/elasticsearch/client/curator/current/index.html