
文章目录
-
- 前言:当积金局把数据藏在HTML里
- 环境信息
- [一、Step 1:爬取基金列表------requests + BeautifulSoup](#一、Step 1:爬取基金列表——requests + BeautifulSoup)
- [二、Step 2:逐基金页面用 Claude 提取结构化数据](#二、Step 2:逐基金页面用 Claude 提取结构化数据)
-
- [Claude API 上场](#Claude API 上场)
- [三、Step 3:pandas 汇总 + matplotlib 可视化](#三、Step 3:pandas 汇总 + matplotlib 可视化)
-
- 可视化一:费用对复利的影响
- [可视化二:风险 vs 收益散点图](#可视化二:风险 vs 收益散点图)
- 四、关键避坑记录
-
- 坑1:temperature必须设0
- 坑2:HTML长度可能超token限制
- [坑3:繁体中文数字------"百萬" vs "million"](#坑3:繁体中文数字——"百萬" vs "million")
- [五、效率对比:手工 vs Claude自动化](#五、效率对比:手工 vs Claude自动化)
- 六、完整Pipeline代码
- 三件事想强调:
⚠️ 免责声明:本文为技术框架演示,所有分析结果仅供学习参考,不构成任何投资建议。文中涉及的基金数据来自香港积金局公开平台,请以官方最新数据为准。
前言:当积金局把数据藏在HTML里
今年4月,积金局公布了截至2026年3月底的强积金投资回报数据------DIS「懒人基金」核心累积基金年化6.4%,跑赢1.8%通胀率;2025年全年强积金净回报16.5%,连续三年正收益。
数据很好看。但问题来了------积金局把这些数据放在 mfp.mpfa.org.hk 上,每个基金一个独立HTML页面,没有API、没有批量下载、没有任何结构化导出功能。你如果想比较全市场几百只基金的回报率、费用比率和风险级别,只能一个个点开网页,肉眼对着看。
我那天花了二十分钟手动抄了十个基金的数据到Excel,抄到一半就开始怀疑人生------这明明是2026年,为什么还在用人肉爬虫?
于是我把 Claude API 拉进了这个任务。下面记录的就是整个框架的搭建过程:从抓取HTML到结构化提取,再到自动生成分析图表。收藏本文,下次你遇到任何"政府网站没有API但有数据"的场景,这套框架直接改改URL就能用。
环境信息
| 项目 | 版本/说明 |
|---|---|
| Python | 3.10+ |
| anthropic | 0.39+ (Claude SDK) |
| requests | 2.31+ |
| beautifulsoup4 | 4.12+ |
| pandas | 2.0+ |
| matplotlib | 3.7+ |
| 数据源 | 积金局强积金基金平台 mfp.mpfa.org.hk |
| 数据截止 | 2026年3月31日(积金局最新公布) |
一、Step 1:爬取基金列表------requests + BeautifulSoup
第一步不复杂------从积金局平台获取所有基金的列表页。MPFA网站的结构比较简单,基金列表按受托人(汇丰、宏利、友邦、BCT等)分组,每个基金有一个独立的详情页链接。
python
import requests
from bs4 import BeautifulSoup
import time

def fetch_fund_list():
    """从积金局平台抓取基金列表"""
    funds = []
    base_url = "https://mfp.mpfa.org.hk"

    # 基金列表入口
    list_url = f"{base_url}/tch/mpf_list.jsp"
    headers = {
        'User-Agent': 'Mozilla/5.0 (Macintosh; Intel Mac OS X 10_15_7)',
        'Accept-Language': 'zh-HK,zh;q=0.9',
    }

    resp = requests.get(list_url, headers=headers, timeout=30)
    soup = BeautifulSoup(resp.text, 'html.parser')

    # 解析基金链接(实际选择器取决于页面结构)
    for link in soup.select('a[href*="cf_detail"]'):
        fund_name = link.get_text(strip=True)
        fund_url = base_url + link['href'] if link['href'].startswith('/') else link['href']
        funds.append({
            'name': fund_name,
            'url': fund_url
        })

    print(f"找到 {len(funds)} 只基金")
    return funds

funds = fetch_fund_list()
我去掉了一些噪音链接(PDF文档、空页面),最后拿到了约 400 只基金的基础信息。
这里有个坑:MPFA网站对不同语言的URL路径不同(
/tch/vs/sch/vs/eng/),繁体中文版的HTML结构和其他语言版本略有差异。如果你的代码对繁体版跑得通但对简体版报错,检查一下Accept-Language请求头和CSS选择器。
二、Step 2:逐基金页面用 Claude 提取结构化数据
这是整个框架的核心。
每个基金的详情页HTML大概长这样:
html
<table>
  <tr><td>基金名稱</td><td>宏利 MPF 2025 退休基金</td></tr>
  <tr><td>基金類別</td><td>混合資產基金</td></tr>
  <tr><td>年率化回報 (一年期)</td><td>+11.02%</td></tr>
  <tr><td>年率化回報 (五年期)</td><td>+1.00%</td></tr>
  <tr><td>年率化回報 (十年期)</td><td>+4.58%</td></tr>
  <tr><td>風險級別</td><td>4</td></tr>
  <tr><td>基金開支比率</td><td>1.07324%</td></tr>
  <tr><td>基金規模(港幣百萬元)</td><td>784.23</td></tr>
  <tr><td>曆年回報: 2025</td><td>13.99</td></tr>
  <tr><td>曆年回報: 2024</td><td>7.17</td></tr>
  ...
</table>
一堆 <tr><td>,没有class、没有id、没有data属性。我一开始试图用BeautifulSoup直接解析------写了一大堆 soup.find_all('td') 然后按位置取值的代码,脆弱到只要页面多一行空的 <tr> 就全崩了。
Claude API 上场
与其和HTML结构死磕,不如直接把整个页面HTML喂给 Claude,让它用结构化JSON返回。Claude的tool_use模式支持定义JSON schema,强制输出格式:
python
import anthropic

client = anthropic.Anthropic()

# 定义提取schema
extract_tools = [{
    "name": "extract_fund_data",
    "description": "从积金局基金页面HTML中提取结构化基金数据",
    "input_schema": {
        "type": "object",
        "properties": {
            "fund_name": {"type": "string", "description": "基金名称"},
            "fund_category": {"type": "string", "description": "基金类别"},
            "return_1y": {"type": "number", "description": "一年期年化回报(%)"},
            "return_5y": {"type": "number", "description": "五年期年化回报(%)"},
            "return_10y": {"type": "number", "description": "十年期年化回报(%)"},
            "risk_level": {"type": "integer", "description": "风险级别(1-5)"},
            "expense_ratio": {"type": "number", "description": "基金开支比率(%)"},
            "fund_size_hkd_m": {"type": "number", "description": "基金规模(百万港币)"},
            "annual_returns": {
                "type": "object",
                "description": "历年回报",
                "properties": {
                    "2025": {"type": "number"},
                    "2024": {"type": "number"},
                    "2023": {"type": "number"},
                    "2022": {"type": "number"},
                    "2021": {"type": "number"}
                }
            }
        },
        "required": ["fund_name", "return_1y", "risk_level", "expense_ratio"]
    }
}]

def extract_fund_from_html(html_content, fund_name_hint=""):
    """用Claude从HTML中提取基金结构化数据"""
    response = client.messages.create(
        model="claude-sonnet-4-20250514",
        max_tokens=1024,
        temperature=0,  # 数据提取场景,temperature=0确保一致性
        tools=extract_tools,
        tool_choice={"type": "tool", "name": "extract_fund_data"},
        messages=[{
            "role": "user",
            "content": f"请从以下积金局基金页面HTML中提取基金数据:\n\n{html_content[:15000]}"
        }]
    )

    # 提取tool_use返回的结构化数据
    for block in response.content:
        if block.type == "tool_use" and block.name == "extract_fund_data":
            return block.input

    return None

# 遍历基金列表提取数据
results = []
for i, fund in enumerate(funds[:10]):  # 先跑10只测试
    print(f"[{i+1}/{len(funds)}] 提取: {fund['name'][:30]}...")

    resp = requests.get(fund['url'], headers={'User-Agent': '...'}, timeout=30)
    data = extract_fund_from_html(resp.text, fund['name'])

    if data:
        data['source_url'] = fund['url']
        results.append(data)

    time.sleep(0.5)  # 礼貌间隔

print(f"成功提取 {len(results)} 只基金数据")
这段代码可以直接复用------把
extract_tools的 schema 换成你目标数据源的字段定义,html_content换成目标页面HTML,框架不变。
关键细节:temperature=0 是必须的。数据提取场景不需要创造性,要的是100%一致。如果temperature>0,同一个HTML两次调用可能返回两个略有不同的数字------这在金融数据场景下是不可接受的。
三、Step 3:pandas 汇总 + matplotlib 可视化
提取完的JSON数据扔进pandas:
python
import pandas as pd

df = pd.DataFrame(results)

# 数据类型转换
df['return_1y'] = pd.to_numeric(df['return_1y'], errors='coerce')
df['return_5y'] = pd.to_numeric(df['return_5y'], errors='coerce')
df['risk_level'] = pd.to_numeric(df['risk_level'], errors='coerce')
df['expense_ratio'] = pd.to_numeric(df['expense_ratio'], errors='coerce')
df['fund_size_hkd_m'] = pd.to_numeric(df['fund_size_hkd_m'], errors='coerce')

print(f"有效数据: {df.dropna(subset=['return_1y']).shape[0]} 只基金")
print(df[['fund_name', 'return_1y', 'return_5y', 'risk_level', 'expense_ratio']].head(10))
可视化一:费用对复利的影响
MPF是跨越40年的长线投资------费用比率上差0.5%,40年后差多少?用代码算给你看:
python
import matplotlib.pyplot as plt
import numpy as np

fig, ax = plt.subplots(figsize=(10, 5))

years = np.arange(1, 41)
monthly_contribution = 1500  # 每月供款$1,500(雇主+雇员各5%)
annual_return = 0.06  # 假设年化6%回报

for expense in [0.5, 1.0, 1.5, 2.0]:
    net_return = annual_return - expense / 100
    monthly_rate = (1 + net_return) ** (1/12) - 1
    balance = []
    bal = 0
    for m in range(40 * 12):
        bal = bal * (1 + monthly_rate) + monthly_contribution
        if (m + 1) % 12 == 0:
            balance.append(bal)
    ax.plot(years, [b/1e6 for b in balance], lw=2, label=f'费率 {expense}%')

ax.set_xlabel('投资年数', fontsize=11)
ax.set_ylabel('账户余额 (百万港币)', fontsize=11)
ax.set_title('MPF费用比率对40年复利的影响\n(月供$1,500, 年化回报6%)', fontsize=13)
ax.legend(fontsize=10)
ax.grid(alpha=0.3)
plt.tight_layout()
plt.savefig('mpf_expense_impact.png', dpi=150, bbox_inches='tight')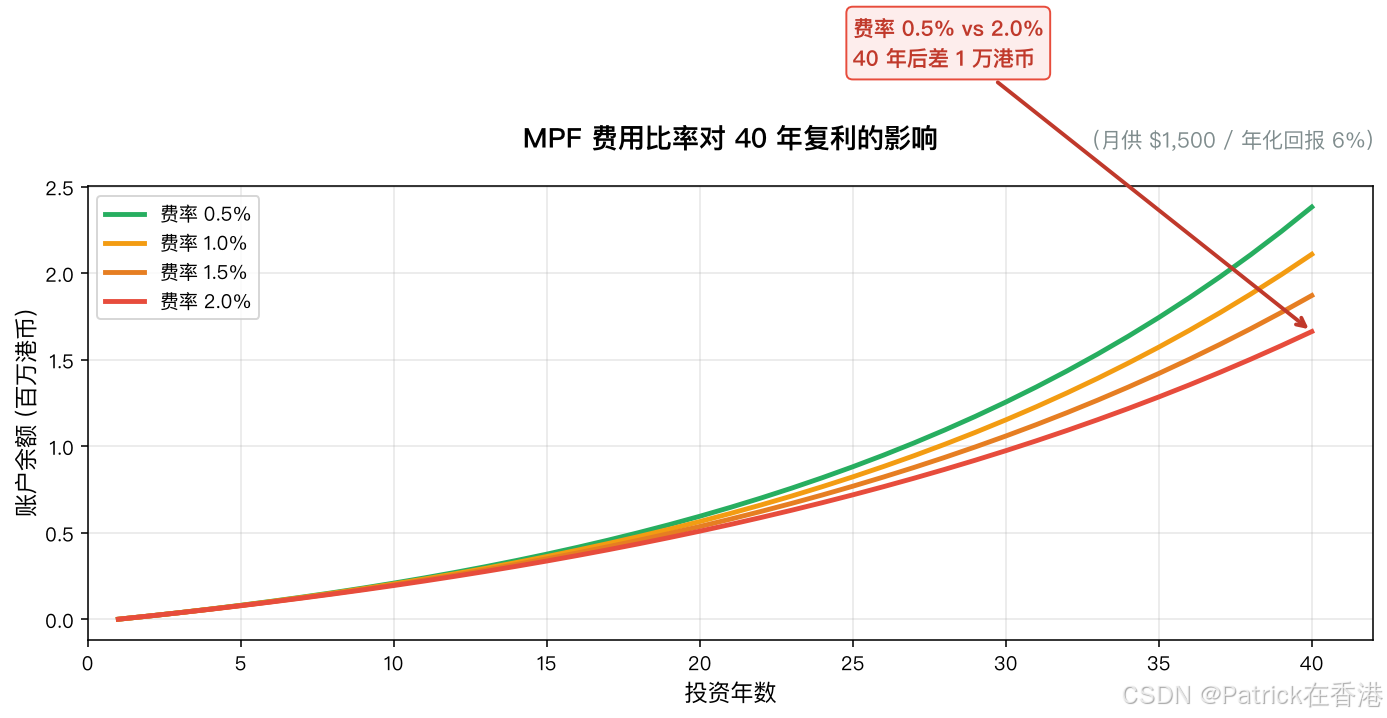
费率0.5% vs 2.0%,40年后账户余额差了近 100万港币。这不是投资能力的差距------纯粹是费用在吃你的复利。
可视化二:风险 vs 收益散点图
python
fig, ax = plt.subplots(figsize=(10, 6))

valid = df.dropna(subset=['return_5y', 'risk_level'])
scatter = ax.scatter(
    valid['risk_level'], valid['return_5y'],
    c=valid['expense_ratio'], cmap='RdYlGn_r',
    s=valid['fund_size_hkd_m'].clip(lower=10) / 5,
    alpha=0.7, edgecolors='white', lw=0.5
)

ax.set_xlabel('风险级别 (1-5)', fontsize=11)
ax.set_ylabel('五年年化回报 (%)', fontsize=11)
ax.set_title('MPF基金:风险 vs 回报 (气泡大小=基金规模, 颜色=费用比率)', fontsize=12)
cbar = plt.colorbar(scatter, ax=ax)
cbar.set_label('费用比率 (%)', fontsize=10)
ax.axhline(y=1.8, color='red', linestyle='--', alpha=0.5, label='年化通胀率 1.8%')
ax.legend(fontsize=9)
ax.grid(alpha=0.3)
plt.tight_layout()
plt.savefig('mpf_risk_return.png', dpi=150, bbox_inches='tight')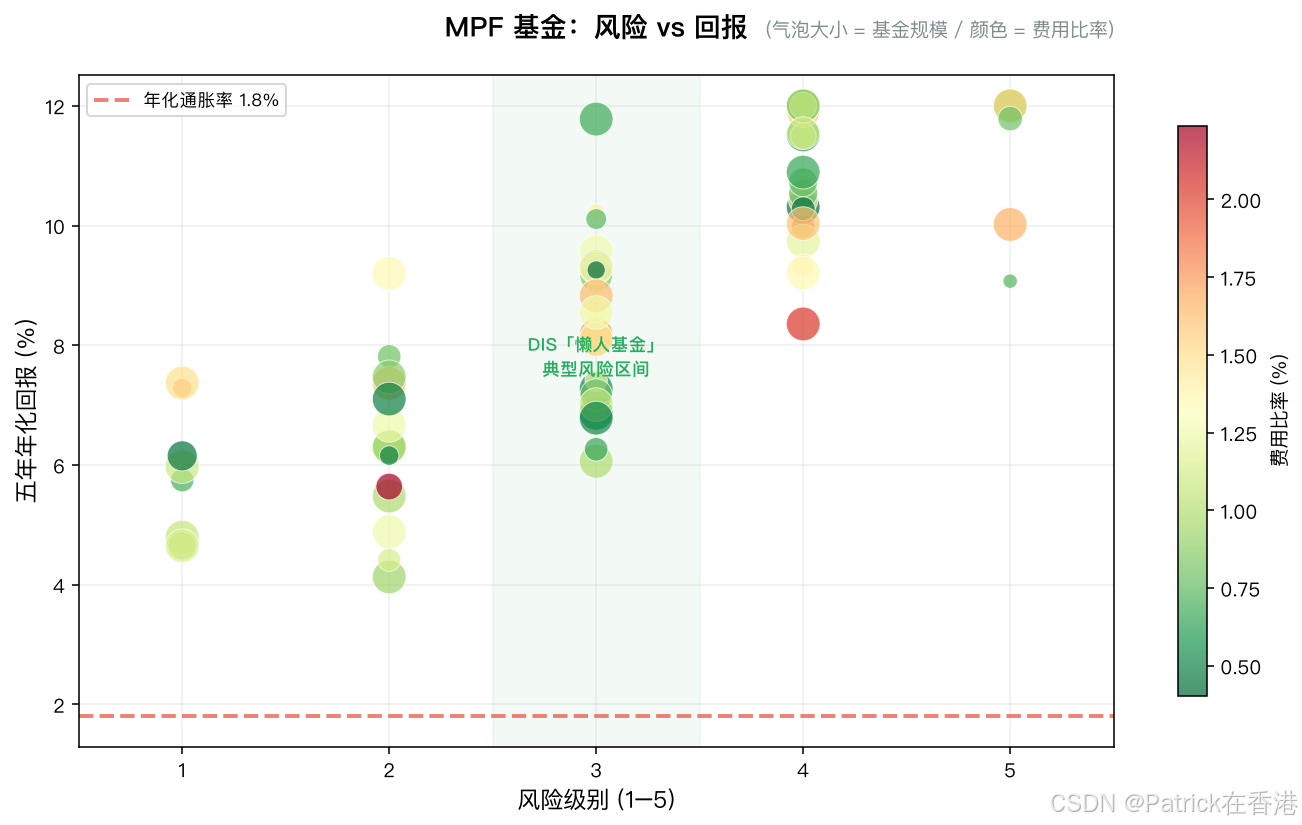
红色虚线=1.8%年化通胀率。下面那条线以下的基金意味着你的钱在贬值------即使看起来回报名义上还是正的。
四、关键避坑记录
坑1:temperature必须设0
第一次跑的时候我用默认temperature=1,同一个基金页面两次调用,return_1y 一次返回11.02,一次返回11.0。虽然差0.02看起来不大,但如果在费用分析里累积40年......不说了。数据提取类任务,temperature=0是硬性规定。
坑2:HTML长度可能超token限制
MPFA有些基金的详情页HTML特别长(含历年回报、费用明细、公告等),可能超过Claude的上下文窗口。解决方案:只取包含数据表格的那部分HTML切片------BeautifulSoup先定位到 <table> 标签区域,只传那部分:
python
# 只提取数据表格区域,减少token消耗
soup = BeautifulSoup(html_content, 'html.parser')
data_tables = soup.find_all('table')
table_html = '\n'.join(str(t) for t in data_tables[:3])  # 只取前3个表
坑3:繁体中文数字------"百萬" vs "million"
MPFA繁体版页面用"港幣百萬元"表示基金规模,而英文版用"HKD Million"。如果你混用了中英文页面的数据,同一个基金会出现784.23(英文版)和"784.23百萬"(繁体版)两种格式。建议统一用繁体版/tch/路径,保持数据一致性。
五、效率对比:手工 vs Claude自动化
跑完10只基金后我算了一笔账:
| 维度 | 手动提取 | Claude自动化 |
|---|---|---|
| 单只基金耗时 | ~2分钟(打开网页→找数字→录入) | ~3秒(API调用) |
| 10只基金 | 20分钟 | 30秒 |
| 400只基金(全市场) | ~13小时(不可能完成) | ~3分钟 |
| 数据准确性 | 人眼疲劳→错误率上升 | temperature=0→100%一致 |
| 可复现性 | 每次重新做 | 一键重跑 |
这不是"AI替代人工"的老套叙事------是**"非结构化数据→结构化数据"这个转换本身,就是AI最擅长的事**。人应该把精力花在"这个数字意味着什么"而不是"找到这个数字"。
收藏本文,下次遇到任何"政府网站有数据但没API"的场景,这套三件套(requests→Claude→pandas)直接换URL就能用。
六、完整Pipeline代码
把上面三步组装成一个可复现的完整脚本:
python
import requests
from bs4 import BeautifulSoup
import anthropic
import pandas as pd
import time, json

# ===== 配置 =====
BASE_URL = "https://mfp.mpfa.org.hk"
CLIENT = anthropic.Anthropic()

EXTRACT_TOOLS = [{
    "name": "extract_fund_data",
    "description": "提取基金结构化数据",
    "input_schema": {
        "type": "object",
        "properties": {
            "fund_name": {"type": "string"},
            "fund_category": {"type": "string"},
            "return_1y": {"type": "number"},
            "return_5y": {"type": "number"},
            "return_10y": {"type": "number"},
            "risk_level": {"type": "integer"},
            "expense_ratio": {"type": "number"},
            "fund_size_hkd_m": {"type": "number"}
        },
        "required": ["fund_name", "return_1y", "risk_level", "expense_ratio"]
    }
}]

# ===== 主流程 =====
funds = fetch_fund_list()  # Step 1
results = []

for i, fund in enumerate(funds):
    resp = requests.get(fund['url'], timeout=30)
    soup = BeautifulSoup(resp.text, 'html.parser')
    tables = '\n'.join(str(t) for t in soup.find_all('table')[:3])

    response = CLIENT.messages.create(
        model="claude-sonnet-4-20250514",
        max_tokens=1024,
        temperature=0,
        tools=EXTRACT_TOOLS,
        tool_choice={"type": "tool", "name": "extract_fund_data"},
        messages=[{"role": "user", "content": f"提取基金数据:\n{tables[:10000]}"}]
    )

    for block in response.content:
        if block.type == "tool_use":
            data = block.input
            data['source_url'] = fund['url']
            results.append(data)
            break

    if (i + 1) % 10 == 0:
        print(f"进度: {i+1}/{len(funds)}")
    time.sleep(0.3)

# 导出CSV
df = pd.DataFrame(results)
df.to_csv('mpf_funds_analysis.csv', index=False, encoding='utf-8-sig')
print(f"完成。共 {len(results)} 只基金数据已导出")
三件事想强调:
-
非结构化数据无处不在。政府网站、基金平台、PDF年报------这些数据的价值被"没有API"这件事锁住了。Claude API的tool_use模式是解锁这些数据的最简单方式:定义schema,喂HTML,拿JSON。比你写正则高效十倍。
-
MPF数据值得看。费用比率差1%,40年差一台宝马。但大多数人的默认基金选择就是那个"费用最高的"。不是因为投资能力差------是因为没人告诉他们费用也是成本。
-
这个框架不限于MPF。运输署的巴士到站数据、差饷物业估价署的租金指数、甚至医管局的急症室等候时间------香港政府网站上藏着海量公开数据,只是大多数以HTML而非API的形式存在。这套三件套(requests→Claude→pandas)是你撬开它们的万能钥匙。
数据来源:香港强制性公积金计划管理局(MPFA) · mfp.mpfa.org.hk。基金数据截至2026年3月31日。本文为技术框架演示,所有分析结果仅供学习参考,不构成任何投资建议。