1.计算机绘图的基本原理与思路
-
基本绘图命令(plot、line、plotyy、plot3等)
-
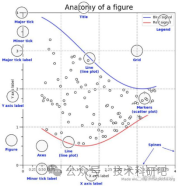
标注图形(title、text、gtext、legend等)
-
设置坐标轴和网格线属性(axis、xlim、ylim、zlim、grid、box、xlabel、ylabel、zlabel等)
-
子图绘制及多曲线绘制(subplot、hold on等)
-
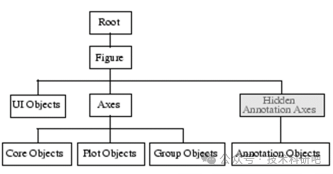
图形句柄系统(gca、set、get等)
第二:MATLAB一维数据可视化
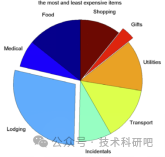
1.饼图(Pie charts)、茎叶图(Stem plots)、阶梯图(Stairs plots)
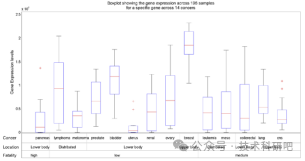
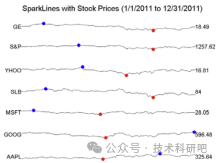
2.箱线图(Box plots)、微线图(Sparklines)
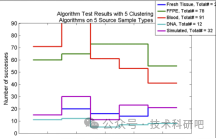
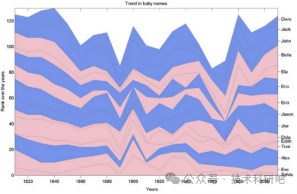
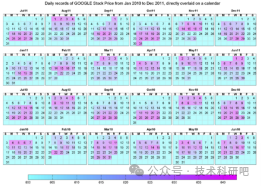
3.堆叠折线图(Stacked lines )、日历热图(Calendarheatmap)
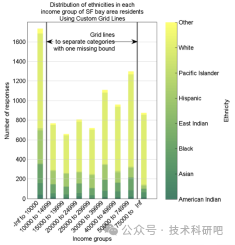
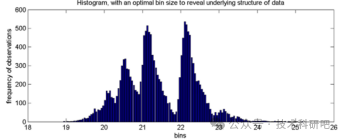
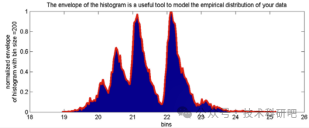
4.统计直方图(Histogram)、包络图(Envelope)
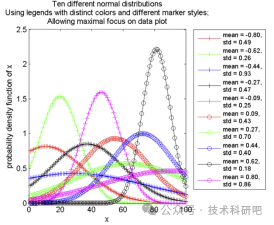
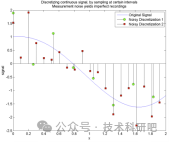
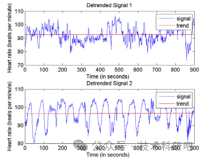
5.时间序列分析去趋势(De-trend)、平滑滤波(Global smoothing)、频谱分析(Power spectrum)等
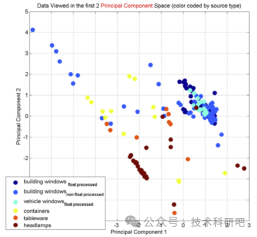
第三:MATLAB二维数据可视化
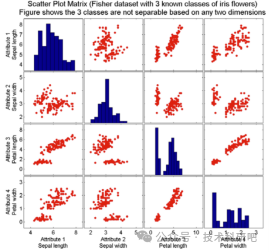
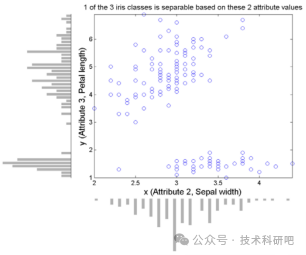
1.2D散点图(2D scatter plots)
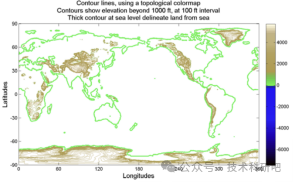
2.等高线图(Contour plots)、地区分布图( Choropleth maps)

第四:MATLAB三维数据可视化
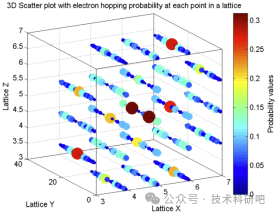
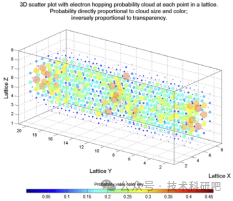
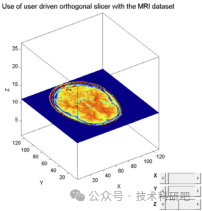
1.3D散点图(3D scatter plots)、切片图(Slice)
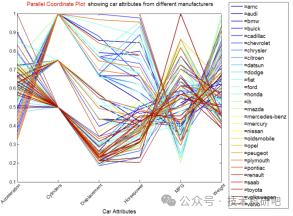
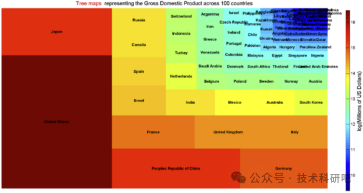
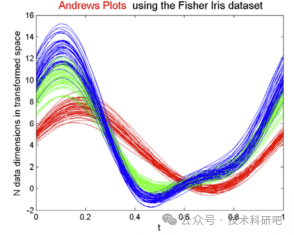
第五:MATLAB高维数据可视化
1.平行坐标图(Parallel coordinate plots)、树图(Tree maps)
2.安德鲁曲线(Andrews' curves)
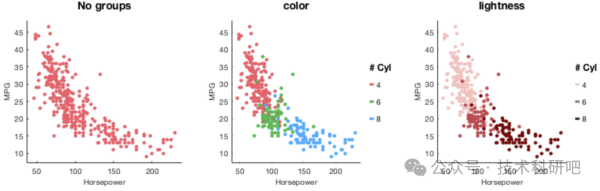
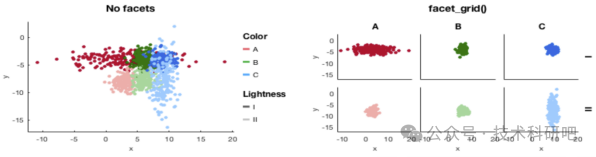
第六:MATLABGramm工具箱
1.Gramm工具箱
2.Gramm工具箱的下载与安装
3.Gramm工具箱案例
第七:MATLAB图像保存与导出
1.利用Print函数保存图像
2.Edit→Copy Figure及File→Export Setup两种图像导出方法
3.利用虚拟打印机及Adobe Acrobat Pro保存、编辑图像pdf文件