一、引言
在数据科学的世界里,视觉传达是不可或缺的一环。一个好的数据可视化不仅能传递信息,还能引发共鸣。Seaborn 是 Python 中一款广受欢迎的可视化库,而它的调色板(palette)功能,则为我们提供了调配绚丽图表的强大工具。
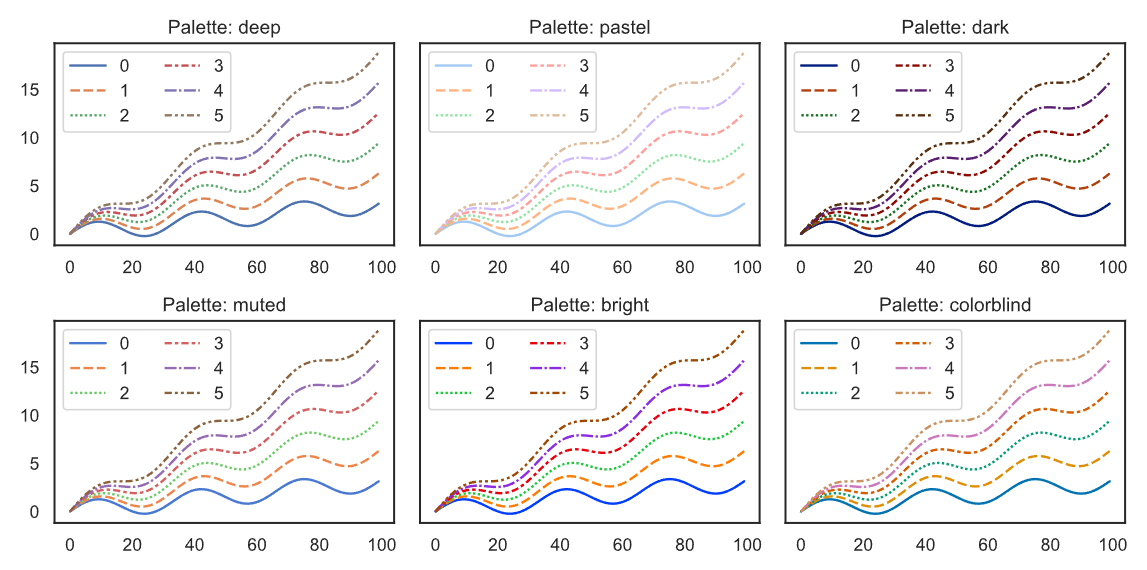
为了直观展示 Seaborn palette ,我们先用几幅图像展示 seaborn 内置的几种色彩。
python
def draw_colorful_plots():
    # 示例数据
    data = np.linspace(0, 2 * np.pi, 100) * 3
    inc = [np.linspace(0, i * np.pi, 100) for i in range(1, 7)]
    data = np.sin(data) + np.asarray(inc)
    data = data.T

	# 系统内置的调色板
    palettes = ['deep', 'pastel', 'dark', 'muted', 'bright', 'colorblind']

    fig, axes = plt.subplots(2, 3, figsize=(10, 5), sharey=True)
    for ax, palette in zip(axes.flatten(), palettes):
        sns.lineplot(data=data, palette=palette, ax=ax) # 通过palette指定当前绘图选择的调色板
        ax.set_title(f'Palette: {palette}')
        ax.legend(ncol=2)	# 修改图例为两列,使其排版更加合理
    plt.tight_layout()
    plt.show()

draw_colorful_plots()
上述代码生成了六张使用不同调色板的曲线图,每种调色板都展现了 Seaborn 对颜色设计的独特理解。官方对这 6 种内置的颜色方案也给出了解释:
上图中横坐标为饱和度(saturation),纵坐标为亮度(luminance),根据饱和度和亮度变化从而产生了 6 种内置的调色方案,其名称标注在图上,可以根据个人喜好进行选择。
二、seaborn的调色板palette
1. 什么是 Seaborn 的调色板?
调色板 palette 是 Seaborn 提供的一组预定义或自定义的颜色集合。总的来说,Seaborn 中的调色板可以分为离散颜色和连续颜色两个大类,默认情况下,对于类别型变量(例如性别,星期)等,Seaborn 会使用离散颜色系统,而对于连续型变量(例如温度,身高)等,Seaborn 会选择连续颜色系统。
本质上,离散型颜色系统和连续型颜色系统没有区别。离散型颜色从颜色空间抽样数量较少,而连续型颜色从颜色空间抽样数量较多,仅此而已。我们可以通过阅读
seaborn的源码得知:
pythondef husl_palette(n_colors=6, h=.01, s=.9, l=.65, as_cmap=False): # noqa """ Return hues with constant lightness and saturation in the HUSL system. as_cmap : bool If True, return a matplotlib colormap object. """ if as_cmap: n_colors = 256 # ... 省略了中间的代码 if as_cmap: return mpl.colors.ListedColormap(palette, "hsl") else: return _ColorPalette(palette)对于连续颜色系统,一般会设定参数
as_cmap=True,从上面代码可以看到,当指定as_cmap=True时,n_colors被赋值为256,而对于离散颜色系统,我们一般只会选择 6、10、20 这些数字(调色板tab10中的数字10就表示10个离散颜色)。总之,在计算机系统中,我们无法真正做到连续颜色,大部分的连续颜色都只是将颜色切分为256个级别,使其看起来比离散颜色更加细腻而已。
所以,seaborn 中总共包含两种颜色系统:
- 离散颜色调色板 :适用于类别变量,直接使用
sns.color_palette()创建,比如使用"Set2"、"Paired"等; - 连续颜色调色板 :适用于数值变量,用于表示连续的颜色变化,一般需要修改参数
as_cmap=True
2. 如何选择和使用调色板?
2.1 内置调色板
Seaborn 提供了一组精心设计的默认调色板,在绘图过程中可以通过指定 palette 参数为某个内置调色板的名称(字符串)即可,例如 palette=deep
可以通过如下API查看 seaborn 内置的默认调色板类型:
python
sns.palettes.SEABORN_PALETTES.keys()

# 返回值:数字6表示6种离散的颜色
dict_keys(['deep', 'deep6', 'muted', 'muted6', 'pastel', 'pastel6', 'bright', 'bright6', 'dark', 'dark6', 'colorblind', 'colorblind6'])
除了 seaborn 内置的调色板,Matplotlib 也有内置的调色板,可以通过如下代码:
python
sns.palettes.MPL_QUAL_PALS.keys()

# 返回值:其中的数字有些是表示离散颜色的个数,比如tab10,tab20都是表示颜色个数,而Set1和Set2等不是表示离散颜色个数
dict_keys(['tab10', 'tab20', 'tab20b', 'tab20c', 'Set1', 'Set2', 'Set3', 'Accent', 'Paired', 'Pastel1', 'Pastel2', 'Dark2'])我们可以借助sns.palplot函数来可视化调色板,从而选择合适的颜色:
python
colors = sns.color_palette("deep")
sns.palplot(colors)	# 一个专门用于可视化调色板的工具函数
plt.title("Deep Palette")
plt.gcf().set_figheight(2.0)
plt.gcf().set_figwidth(10)
plt.savefig('imgs/palette_deep.svg')
plt.tight_layout()
plt.show()
2.2 离散调色板
离散调色板主要用于分类数据。我们可以通过 sns.color_palette() 或 sns.set_palette() 应用
python
# 使用"Set2"调色板
colors = sns.color_palette("Set2")
sns.palplot(colors)
plt.gcf().set_figheight(2.0)
plt.gcf().set_figwidth(10)
plt.title("Set2 Palette")
plt.savefig('./imgs/palette_set2.svg')
plt.show()
2.3 连续调色板
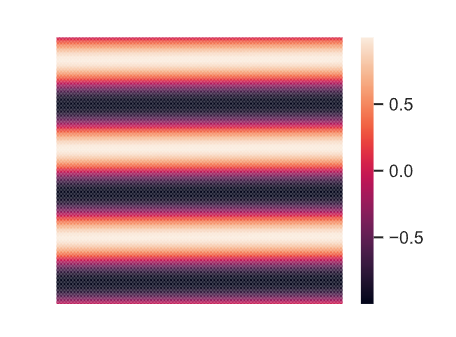
连续调色板非常适合展示细腻的颜色变化的数据,比如热图:
python
plt.figure(figsize=(4, 3))  # 设置图像大小
data = np.sin(np.linspace(0, 2 * np.pi, 40000) * 3).reshape(200, 200)
sns.heatmap(data, cmap=sns.color_palette('rocket', as_cmap=True), xticklabels=False, yticklabels=False)
plt.savefig('./imgs/continuous_palette.svg')
plt.show()
可以使用如下方法来查看系统中可以使用的连续系统颜色类型
python
from matplotlib import colormaps

print(list(colormaps))
['magma', 'inferno', 'plasma', 'viridis', 'cividis', 'twilight', 'twilight_shifted', 'turbo', 'Blues', ...]
2.4 自定义调色板
Seaborn 提供了灵活的工具来创建和使用自定义调色板,以满足特定的数据可视化需求。以下是几种常见的方式来创建自定义调色板:
1. 直接定义颜色列表
如果你已经有一组特定的颜色值,可以直接将它们传递给 sns.color_palette() 方法。颜色值可以是十六进制代码、RGB 元组或 Matplotlib 支持的颜色名称。
python
import seaborn as sns
import matplotlib.pyplot as plt

# 定义自定义颜色列表
custom_palette = ['#FF5733', '#33FF57', '#3357FF', '#FFFF33']

# 使用自定义调色板
sns.set_palette(custom_palette)
sns.palplot(sns.color_palette())  # 可视化调色板
plt.show()
2. 使用 sns.light_palette() 或 sns.dark_palette()
Seaborn 提供了两个专门的方法来创建基于单一颜色的浅色调或深色调渐变调色板。
python
# 创建浅色调调色板
light_palette = sns.light_palette("#FF5733", as_cmap=False)

# 创建深色调调色板
dark_palette = sns.dark_palette("#FF5733", as_cmap=False)

# 可视化浅色调和深色调调色板
sns.palplot(light_palette)
plt.savefig('./imgs/custom_light.svg')
sns.palplot(dark_palette)
plt.savefig('./imgs/custom_dark.svg')
plt.show()

3. 使用 sns.blend_palette() 混合多种颜色
如果想要结合多种颜色形成复杂的渐变,可以使用 sns.blend_palette() 方法。这适合需要展示多阶段数据变化的场景。
python
# 混合多种颜色
blend_palette = sns.blend_palette(['#FF5733', '#33FF57', '#3357FF'], n_colors=10)

# 可视化混合调色板
sns.palplot(blend_palette)
plt.show()
4. 生成循环调色板
在某些场景下(如分类变量较多时),需要循环的调色板。Seaborn 的 sns.color_palette() 支持生成离散的循环调色板。
python
# 创建循环调色板
circular_palette = sns.color_palette("husl", 8)

# 可视化循环调色板
sns.palplot(circular_palette)
plt.savefig('./imgs/circular_palette.svg')
plt.show()
上面代码中sns.color_palette('husl', 8)中的husl参数会在底层调用sns.husl_palette函数创建对应的调色板,husl的全称是 Human-friendly HSL, 是一种人类友好的HSL的颜色系统(HSL颜色系统介绍见下文),更加底层的是API函数是sns.hsl_palette。
python
pal = sns.hls_palette(n_colors=6, h=.7, l=.3, s=.8) # h l s三个参数分别指定色调、亮度、饱和度
sns.palplot(pal)
plt.savefig('./imgs/hls_palette.svg')
plt.show()
python
pal = sns.husl_palette(n_colors=6, h=.7, l=.3, s=.8) # h l s三个参数分别指定色调、亮度、饱和度
sns.palplot(pal)
plt.savefig('./imgs/husl_palette.svg')
plt.show()
5. seaborn 特色风格的调色板
crayon_palette 和 xkcd_palette Seaborn 提供的两种特定方法,分别用来创建具有蜡笔(crayon)颜色风格 的调色板以及 xkcd 颜色调查 的调色板。
xkcd 是一个知名的网络漫画网站,在一次调查中,该网站的作者向社区征集了用户对颜色名称的认知,并将结果整理成了一份包含 954 种颜色的名称和对应 RGB 值的列表。这些颜色以直观、通俗的名称命名,比如
xkcd:sky blue(天蓝色)和xkcd:grass green(草绿色)。
python
# 定义蜡笔风格的调色板
crayon_palette = ['Almond', 'Apricot', 'Beaver', 'Black']

# 设置调色板
palette = sns.crayon_palette(crayon_palette)

# 可视化调色板
sns.palplot(palette)
plt.savefig('./imgs/crayon_palette.svg')
plt.show()
需要注意的是,crayon的颜色不是随意选择的,而需要通过特定颜色进行组合,可以通过如下函数查看:
python
list(sns.colors.crayons.keys())[:10]

['Almond',
 'Antique Brass',
 'Apricot',
 'Aquamarine',
 'Asparagus',
 'Atomic Tangerine',
 'Banana Mania',
 'Beaver',
 'Bittersweet',
'Black']同样地,我们可以定义xkcd风格的调色板:
python
# 定义xkcd风格的调色板
xkcd_palette = ['acid green', 'adobe', 'algae', 'algae green']

# 设置调色板
palette = sns.xkcd_palette(xkcd_palette)

# 可视化调色板
sns.palplot(palette)
plt.savefig('./imgs/xkcd_palette.svg')
plt.show()其中,xkcd的风格的输入颜色也有类似的限制,可以通过如下函数查看:
python
list(sns.colors.xkcd_rgb.keys())[:10]

['acid green',
 'adobe',
 'algae',
 'algae green',
 'almost black',
 'amber',
 'amethyst',
 'apple',
 'apple green',
 'apricot']
6. 使用 cubehelix_palette 生成色盲友好的调色板
python
sns.palplot(sns.cubehelix_palette(start=0.5, rot=-0.75, n_colors=6))
plt.savefig('./imgs/cubehelix_palette.svg')
plt.show()
7. 使用sns.diverging_palette生成两个"极端"颜色
这里的"极端"的意思是两个极点,类似于正负区间的那种,中间会横跨原点,从一个极端到另一个极端,而不是前面介绍的light或者dark那样单个色调的明暗变化。
seaborn中内置有两个diverging调色板:vlag和icefire
python
sns.color_palette("vlag", as_cmap=True)import matplotlib.ticker as ticker


_, ax = plt.subplots(1, 1, figsize=(6, 1))
pal = sns.color_palette("vlag", as_cmap=True)
n = 256
ax.imshow(np.arange(n).reshape(1, n),
            cmap=pal,
            interpolation="nearest", aspect="auto")
ax.set_xticks(np.arange(n) - .5)
ax.set_yticks([-.5, .5])
# Ensure nice border between colors
ax.set_xticklabels(["" for _ in range(n)])
# The proper way to set no ticks
ax.yaxis.set_major_locator(ticker.NullLocator())
plt.savefig('./imgs/diverging_vlag.svg')
plt.show()
python
import matplotlib.ticker as ticker


_, ax = plt.subplots(1, 1, figsize=(6, 1))
pal = sns.color_palette("icefire", as_cmap=True)
n = 256
ax.imshow(np.arange(n).reshape(1, n),
            cmap=pal,
            interpolation="nearest", aspect="auto")
ax.set_xticks(np.arange(n) - .5)
ax.set_yticks([-.5, .5])
# Ensure nice border between colors
ax.set_xticklabels(["" for _ in range(n)])
# The proper way to set no ticks
ax.yaxis.set_major_locator(ticker.NullLocator())
plt.savefig('./imgs/diverging_icefire.svg')
plt.show()
更进一步,我们可以自定义想要的diverging 颜色:
python
import matplotlib.ticker as ticker


_, ax = plt.subplots(1, 1, figsize=(6, 1))
pal = sns.diverging_palette(h_neg=145, h_pos=300, s=75, l=50, sep=10,center='light', as_cmap=True)
n = 256
ax.imshow(np.arange(n).reshape(1, n),
            cmap=pal,
            interpolation="nearest", aspect="auto")
ax.set_xticks(np.arange(n) - .5)
ax.set_yticks([-.5, .5])
# Ensure nice border between colors
ax.set_xticklabels(["" for _ in range(n)])
# The proper way to set no ticks
ax.yaxis.set_major_locator(ticker.NullLocator())
plt.savefig('./imgs/custom_diverging.svg')
plt.show()
h_neg, h_pos分别是色调的起始和结束值,s和l分别是饱和度和亮度,center决定中心是亮还是暗

三、颜色的基础知识
由于我们眼睛的工作原理,特定的颜色可以通过三个基本组件来定义。我们通常在计算机中通过指定 RGB 值来编程颜色,这些值设定了显示器中红色、绿色和蓝色通道的强度。但是对于分析颜色的感知属性来说,使用色相、饱和度和亮度通道俩表示则更合适。
HSL 颜色空间,即色相(Hue)、饱和度(Saturation)和亮度(Lightness),是一种用于描述颜色的系统。以下是对HSL 颜色空间的详细解释:
-
色相(Hue):色相是色彩的基本属性,就是平常所说的颜色名称,如红色、黄色等。它表示在光谱中的位置,用角度度量,取值范围为0~360°。例如,0°表示红色,120°表示绿色,240°表示蓝色等。
-
饱和度(Saturation):饱和度是指色彩的纯度,越高色彩越纯,低则逐渐变灰,取0-100%的数值。它表示颜色接近光谱色的程度。饱和度越高,说明颜色越深,越接近光谱色;饱和度越低,说明颜色越浅,越接近白色。饱和度为0时,表示纯白色。
-
亮度(Lightness):亮度表示颜色的明暗程度,取0-100%的数值。在HSL颜色空间中,亮度为100%表示白色,亮度为0表示黑色。亮度决定了颜色空间中颜色的明暗程度,亮度越高,颜色越明亮。
HSL 颜色空间与 RGB 颜色空间相比,更接近人们对彩色的感知经验,因此更加直观。在图像处理中,使用 HSL 颜色空间可以更方便地进行颜色的对比和调整。此外,由于 HSL 颜色空间中的亮度分量独立于色相和饱和度,因此在提取白色物体时,使用 HSL 颜色空间比 HSV 颜色空间更准确。
总的来说,HSL颜色空间是一种用于描述颜色的系统,通过色相、饱和度和亮度三个分量来定义颜色。它在图像处理和计算机视觉等领域具有广泛的应用。
四、总结
Seaborn 的调色板功能为数据可视化注入了无尽的创意与美感。从内置的经典色彩到自定义的高级调色,palette 是将数据视觉化艺术与科学结合的重要工具。希望这篇博客能激发你对调色板的探索热情,为你的图表增色添彩。