一、实验数据
真实直线+噪声+离群点
真实模型(Ground Truth)

cpp
clc; clear; close all;
rng(2);

% ===== Ground Truth =====
theta_gt = pi/6;   % 30°
rho_gt   = 40;

x = linspace(0,100,50);
y = (rho_gt - x*cos(theta_gt))/sin(theta_gt);

% 亚像素高斯噪声
y = y + 0.1*randn(size(y));

% 离群点
x_out = rand(1,15)*100;
y_out = rand(1,15)*100;

X = [x x_out];
Y = [y y_out];
pts = [X(:), Y(:)];

% 画出原始数据
scatter(X, Y, 25, 'k', 'filled')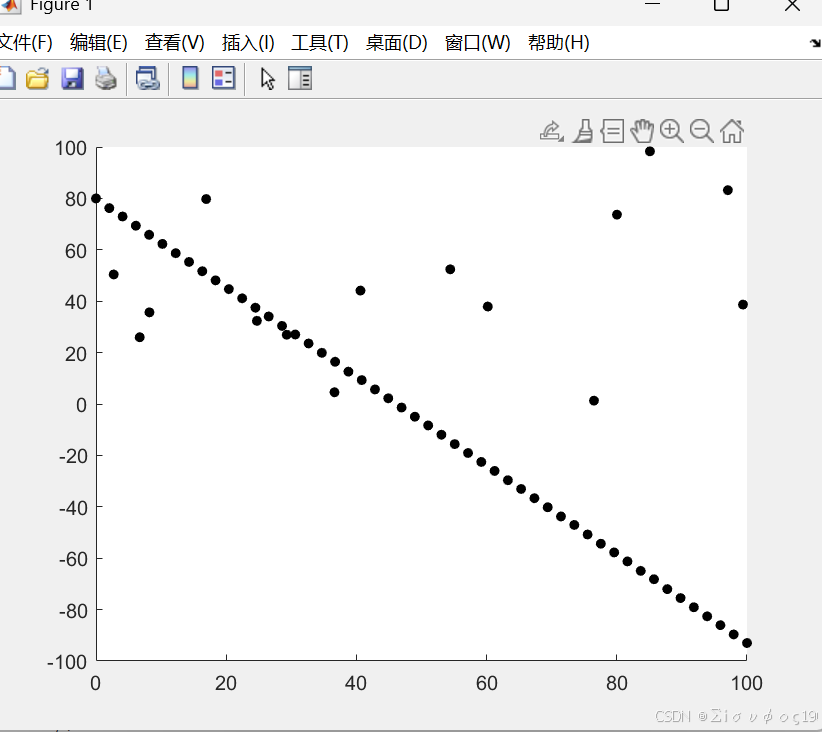
二、方法一:最小二乘(LS / 正交最小二乘)
cpp
% 计算均值
mu = mean(pts);
% 计算当前点 -均值
Xc = pts - mu;

[~,~,V] = svd(Xc,0);
n_ls = V(:,2);                 % 法向
theta_ls = atan2(n_ls(2), n_ls(1));
rho_ls   = mu * n_ls;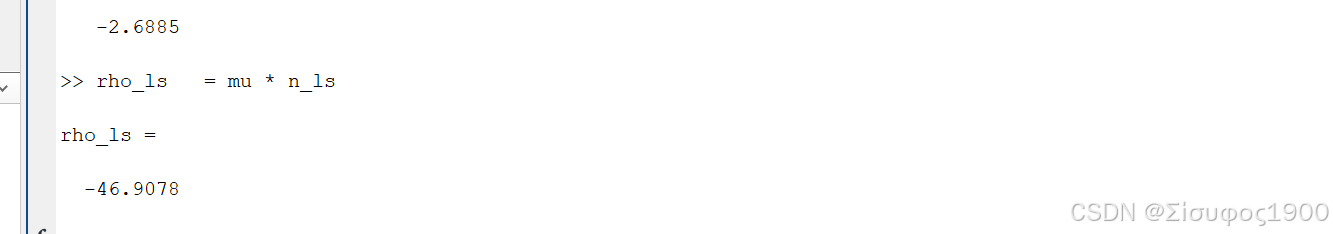
三、方法二:RANSAC 拟合直线
cpp
eps = 1.0;
best_inliers = [];
theta_r = 0; rho_r = 0;

for k = 1:1000
    id = randperm(size(pts,1),2);
    p1 = pts(id(1),:);
    p2 = pts(id(2),:);

    v = p2 - p1;
    n = [v(2), -v(1)];
    n = n / norm(n);
    rho = p1*n';

    d = abs(pts*n' - rho);
    inliers = find(d < eps);

    if numel(inliers) > numel(best_inliers)
        best_inliers = inliers;
        theta_r = atan2(n(2), n(1));
        rho_r   = rho;
    end
end
四、方法三:霍夫变换
cpp
img = zeros(120,120);
ix = round(X); iy = round(Y);
valid = ix>0 & ix<=120 & iy>0 & iy<=120;
img(sub2ind(size(img), iy(valid), ix(valid))) = 1;

[H,theta,rho] = hough(img);
P = houghpeaks(H,1);

theta_h = deg2rad(theta(P(2)));
rho_h   = rho(P(1));
五、画图对比(重点)
cpp
xx = linspace(0,100,200);

% 真实线
yy_gt = (rho_gt - xx*cos(theta_gt))/sin(theta_gt);
yy_ls = (rho_ls - xx*cos(theta_ls))/sin(theta_ls);
yy_r  = (rho_r  - xx*cos(theta_r ))/sin(theta_r );
yy_h  = (rho_h  - xx*cos(theta_h ))/sin(theta_h );

figure; hold on; grid on; axis equal;
scatter(X, Y, 25, 'k', 'filled');
plot(xx, yy_gt, 'g-', 'LineWidth',2);
plot(xx, yy_ls, 'b--', 'LineWidth',2);
plot(xx, yy_r,  'r-.', 'LineWidth',2);
plot(xx, yy_h,  'm:', 'LineWidth',2);

legend('Data','GT','LS','RANSAC','Hough');
xlabel('x'); ylabel('y');
title('Line Fitting: Hough vs LS vs RANSAC');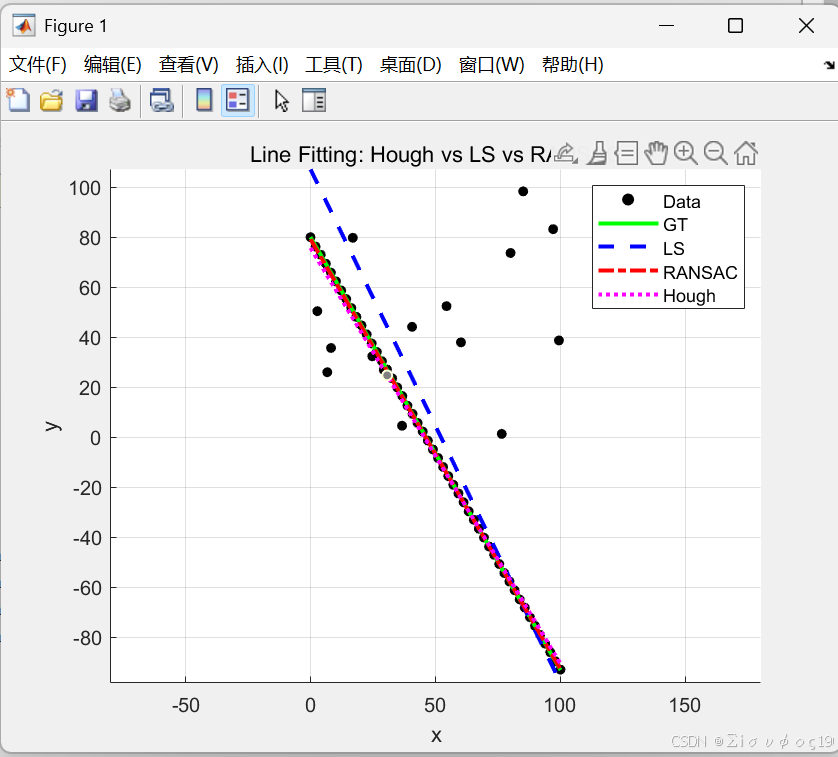
-
LS:被离群点明显拉歪
-
RANSAC:方向对,但不够精
-
霍夫:结构对,但位置"卡 bin"
-
GT:作为参考
六、统一误差计算(定量)
平均正交几何误差
参数误差

bash
%平均正交几何误差
err = @(th,rh) mean(abs(pts*[cos(th); sin(th)] - rh));

E_ls = err(theta_ls, rho_ls);
E_r  = err(theta_r,  rho_r );
E_h  = err(theta_h,  rho_h );


% 参数误差
dtheta_ls = abs(theta_ls - theta_gt);
drho_ls   = abs(rho_ls   - rho_gt);

dtheta_r  = abs(theta_r  - theta_gt);
drho_r    = abs(rho_r    - rho_gt);

dtheta_h  = abs(theta_h  - theta_gt);
drho_h    = abs(rho_h    - rho_gt);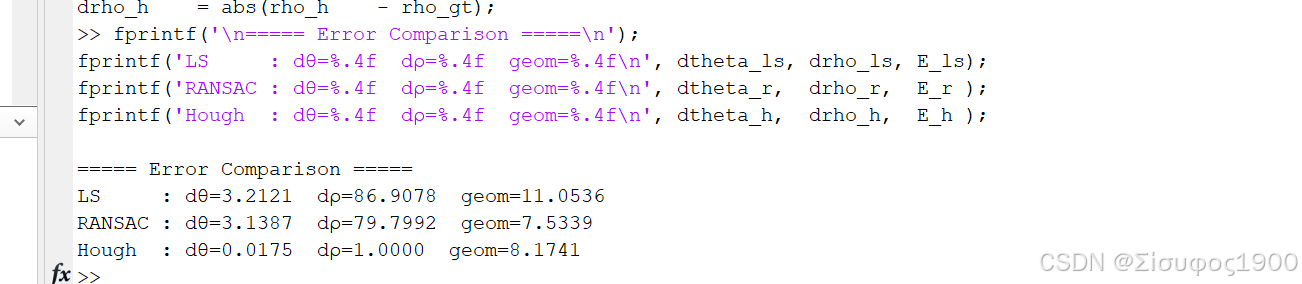
稳定结论顺序:
几何误差:RANSAC < Hough < LS (有离群点时)
参数精度:LS > RANSAC > Hough